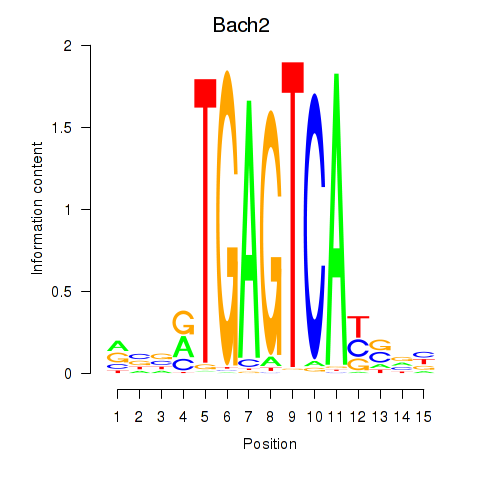
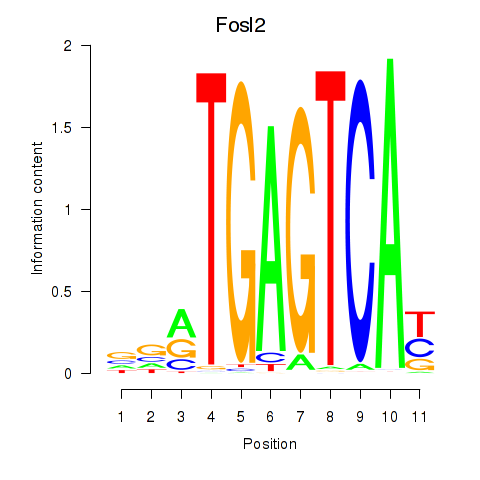
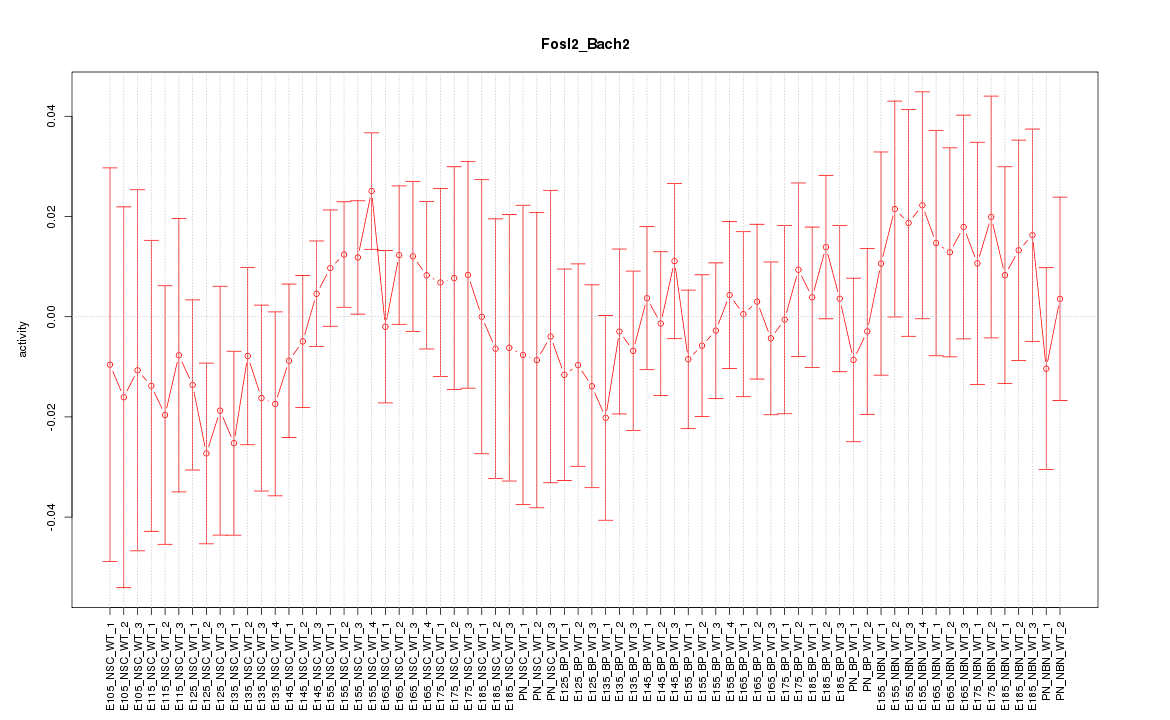
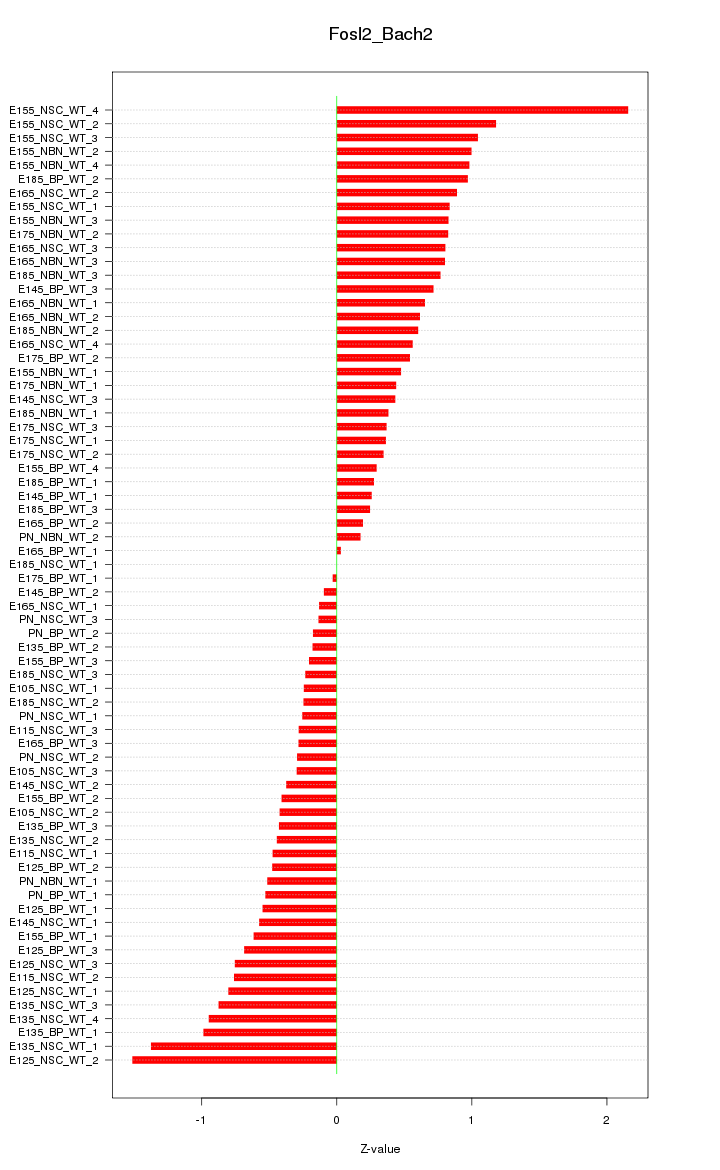
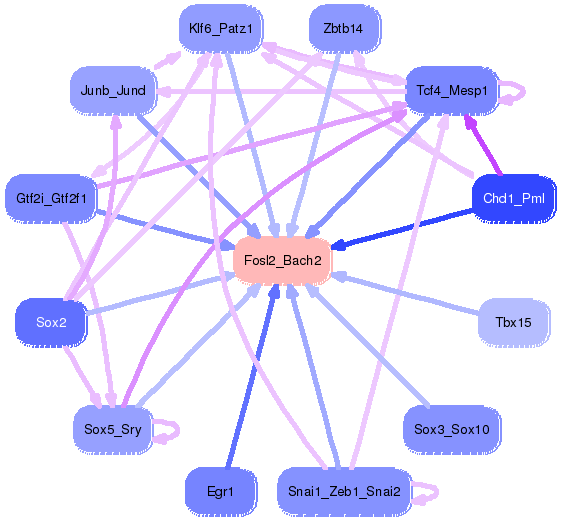
Motif ID: Fosl2_Bach2
Z-value: 0.668
Transcription factors associated with Fosl2_Bach2:
| Gene Symbol | Entrez ID | Gene Name |
|---|---|---|
| Bach2 | ENSMUSG00000040270.10 | Bach2 |
| Fosl2 | ENSMUSG00000029135.9 | Fosl2 |
Activity-expression correlation:
| Gene Symbol | Promoter | Pearson corr. coef. | P-value | Plot |
|---|---|---|---|---|
| Fosl2 | mm10_v2_chr5_+_32136458_32136505 | 0.77 | 4.2e-15 | Click! |
| Bach2 | mm10_v2_chr4_+_32238950_32238964 | 0.51 | 7.0e-06 | Click! |

Top targets:
Gene overrepresentation in biological_process category:
| Log-likelihood per target | Total log-likelihood | Term | Description |
|---|---|---|---|
| 1.7 | 6.8 | GO:1904177 | regulation of adipose tissue development(GO:1904177) |
| 1.3 | 11.6 | GO:0060665 | regulation of branching involved in salivary gland morphogenesis by mesenchymal-epithelial signaling(GO:0060665) |
| 1.1 | 4.4 | GO:2000774 | positive regulation of cellular senescence(GO:2000774) |
| 1.0 | 4.1 | GO:0021812 | neuronal-glial interaction involved in cerebral cortex radial glia guided migration(GO:0021812) |
| 1.0 | 6.1 | GO:1903056 | regulation of lens fiber cell differentiation(GO:1902746) positive regulation of lens fiber cell differentiation(GO:1902748) regulation of melanosome organization(GO:1903056) |
| 0.9 | 2.7 | GO:0032241 | positive regulation of nucleobase-containing compound transport(GO:0032241) regulation of nucleoside transport(GO:0032242) negative regulation of circadian sleep/wake cycle, non-REM sleep(GO:0042323) negative regulation of mucus secretion(GO:0070256) |
| 0.9 | 3.4 | GO:0003430 | growth plate cartilage chondrocyte growth(GO:0003430) |
| 0.7 | 6.9 | GO:0051152 | positive regulation of smooth muscle cell differentiation(GO:0051152) |
| 0.6 | 9.2 | GO:1902993 | positive regulation of beta-amyloid formation(GO:1902004) positive regulation of amyloid precursor protein catabolic process(GO:1902993) |
| 0.6 | 2.3 | GO:0035624 | receptor transactivation(GO:0035624) epidermal growth factor-activated receptor transactivation by G-protein coupled receptor signaling pathway(GO:0035625) |
| 0.5 | 3.2 | GO:0046103 | ADP biosynthetic process(GO:0006172) inosine biosynthetic process(GO:0046103) |
| 0.5 | 1.6 | GO:0043465 | regulation of fermentation(GO:0043465) negative regulation of fermentation(GO:1901003) |
| 0.5 | 4.1 | GO:0033564 | anterior/posterior axon guidance(GO:0033564) |
| 0.5 | 1.4 | GO:0086017 | Purkinje myocyte action potential(GO:0086017) |
| 0.5 | 1.8 | GO:0070885 | negative regulation of interleukin-17 production(GO:0032700) negative regulation of calcineurin-NFAT signaling cascade(GO:0070885) cellular response to copper ion(GO:0071280) |
| 0.4 | 4.9 | GO:2001135 | regulation of endocytic recycling(GO:2001135) |
| 0.4 | 1.3 | GO:0060478 | acrosomal vesicle exocytosis(GO:0060478) |
| 0.4 | 1.3 | GO:0048388 | endosomal lumen acidification(GO:0048388) synaptic vesicle lumen acidification(GO:0097401) |
| 0.4 | 0.4 | GO:0030862 | regulation of polarized epithelial cell differentiation(GO:0030860) positive regulation of polarized epithelial cell differentiation(GO:0030862) |
| 0.4 | 1.6 | GO:0038128 | ERBB2 signaling pathway(GO:0038128) |
| 0.4 | 1.1 | GO:0043988 | histone H3-S28 phosphorylation(GO:0043988) |
| 0.4 | 2.6 | GO:1900029 | positive regulation of ruffle assembly(GO:1900029) |
| 0.4 | 1.5 | GO:0035617 | stress granule disassembly(GO:0035617) |
| 0.4 | 5.1 | GO:0043011 | myeloid dendritic cell differentiation(GO:0043011) |
| 0.4 | 1.1 | GO:0061153 | trachea submucosa development(GO:0061152) trachea gland development(GO:0061153) |
| 0.3 | 11.3 | GO:0045746 | negative regulation of Notch signaling pathway(GO:0045746) |
| 0.3 | 1.5 | GO:0031915 | positive regulation of synaptic plasticity(GO:0031915) positive regulation of receptor binding(GO:1900122) |
| 0.3 | 1.8 | GO:0007021 | tubulin complex assembly(GO:0007021) |
| 0.3 | 3.2 | GO:1901621 | negative regulation of smoothened signaling pathway involved in dorsal/ventral neural tube patterning(GO:1901621) |
| 0.3 | 1.7 | GO:0032380 | regulation of intracellular lipid transport(GO:0032377) regulation of intracellular sterol transport(GO:0032380) regulation of intracellular cholesterol transport(GO:0032383) phospholipid efflux(GO:0033700) |
| 0.3 | 2.7 | GO:0090385 | phagosome-lysosome fusion(GO:0090385) |
| 0.3 | 0.8 | GO:0045110 | intermediate filament bundle assembly(GO:0045110) |
| 0.3 | 0.3 | GO:0030397 | membrane disassembly(GO:0030397) nuclear envelope disassembly(GO:0051081) |
| 0.3 | 1.1 | GO:0060715 | syncytiotrophoblast cell differentiation involved in labyrinthine layer development(GO:0060715) |
| 0.3 | 1.0 | GO:0031509 | telomeric heterochromatin assembly(GO:0031509) negative regulation of chromosome condensation(GO:1902340) |
| 0.2 | 2.5 | GO:0030049 | muscle filament sliding(GO:0030049) |
| 0.2 | 3.5 | GO:0061469 | regulation of type B pancreatic cell proliferation(GO:0061469) |
| 0.2 | 1.7 | GO:0007296 | vitellogenesis(GO:0007296) |
| 0.2 | 1.0 | GO:1901475 | pyruvate transmembrane transport(GO:1901475) |
| 0.2 | 1.7 | GO:0015862 | uridine transport(GO:0015862) |
| 0.2 | 1.0 | GO:1901524 | regulation of macromitophagy(GO:1901524) negative regulation of macromitophagy(GO:1901525) |
| 0.2 | 1.2 | GO:0051684 | maintenance of Golgi location(GO:0051684) |
| 0.2 | 0.7 | GO:0071544 | diphosphoinositol polyphosphate metabolic process(GO:0071543) diphosphoinositol polyphosphate catabolic process(GO:0071544) |
| 0.2 | 1.1 | GO:0060763 | mammary duct terminal end bud growth(GO:0060763) |
| 0.2 | 2.2 | GO:2001256 | regulation of store-operated calcium entry(GO:2001256) |
| 0.2 | 1.0 | GO:0032911 | nerve growth factor production(GO:0032902) negative regulation of transforming growth factor beta1 production(GO:0032911) |
| 0.2 | 1.0 | GO:0048133 | germ-line stem cell division(GO:0042078) male germ-line stem cell asymmetric division(GO:0048133) germline stem cell asymmetric division(GO:0098728) |
| 0.2 | 3.5 | GO:0099500 | synaptic vesicle fusion to presynaptic active zone membrane(GO:0031629) vesicle fusion to plasma membrane(GO:0099500) |
| 0.2 | 0.5 | GO:0051464 | positive regulation of cortisol secretion(GO:0051464) |
| 0.2 | 0.5 | GO:1901509 | regulation of endothelial tube morphogenesis(GO:1901509) |
| 0.2 | 1.0 | GO:0007197 | adenylate cyclase-inhibiting G-protein coupled acetylcholine receptor signaling pathway(GO:0007197) phospholipase C-activating G-protein coupled acetylcholine receptor signaling pathway(GO:0007207) |
| 0.2 | 6.0 | GO:0021952 | central nervous system projection neuron axonogenesis(GO:0021952) |
| 0.2 | 2.1 | GO:0034497 | protein localization to pre-autophagosomal structure(GO:0034497) |
| 0.2 | 1.1 | GO:0046085 | adenosine metabolic process(GO:0046085) |
| 0.2 | 0.6 | GO:0032792 | negative regulation of CREB transcription factor activity(GO:0032792) |
| 0.2 | 4.3 | GO:0031571 | mitotic G1 DNA damage checkpoint(GO:0031571) |
| 0.1 | 1.2 | GO:0061635 | regulation of protein complex stability(GO:0061635) |
| 0.1 | 2.5 | GO:0008090 | retrograde axonal transport(GO:0008090) |
| 0.1 | 1.6 | GO:0032482 | Rab protein signal transduction(GO:0032482) |
| 0.1 | 0.4 | GO:0002430 | complement receptor mediated signaling pathway(GO:0002430) |
| 0.1 | 0.7 | GO:1902031 | regulation of NADP metabolic process(GO:1902031) |
| 0.1 | 0.7 | GO:0043314 | negative regulation of neutrophil degranulation(GO:0043314) negative regulation of blood vessel remodeling(GO:0060313) |
| 0.1 | 0.9 | GO:0006686 | sphingomyelin biosynthetic process(GO:0006686) |
| 0.1 | 8.9 | GO:0072583 | clathrin-mediated endocytosis(GO:0072583) |
| 0.1 | 2.3 | GO:0006744 | ubiquinone biosynthetic process(GO:0006744) |
| 0.1 | 1.5 | GO:0006622 | protein targeting to lysosome(GO:0006622) |
| 0.1 | 1.0 | GO:0002903 | negative regulation of B cell apoptotic process(GO:0002903) |
| 0.1 | 0.6 | GO:0090164 | asymmetric Golgi ribbon formation(GO:0090164) |
| 0.1 | 2.0 | GO:0031115 | negative regulation of microtubule polymerization(GO:0031115) |
| 0.1 | 0.5 | GO:0071787 | endoplasmic reticulum tubular network assembly(GO:0071787) |
| 0.1 | 0.5 | GO:0002710 | negative regulation of T cell mediated immunity(GO:0002710) |
| 0.1 | 0.3 | GO:0010936 | negative regulation of macrophage cytokine production(GO:0010936) |
| 0.1 | 0.5 | GO:0035726 | common myeloid progenitor cell proliferation(GO:0035726) |
| 0.1 | 1.0 | GO:0051103 | DNA ligation involved in DNA repair(GO:0051103) |
| 0.1 | 1.0 | GO:0007250 | activation of NF-kappaB-inducing kinase activity(GO:0007250) |
| 0.1 | 3.3 | GO:0090162 | establishment of epithelial cell polarity(GO:0090162) |
| 0.1 | 3.6 | GO:1902668 | negative regulation of axon extension involved in axon guidance(GO:0048843) negative regulation of axon guidance(GO:1902668) |
| 0.1 | 0.4 | GO:0038032 | termination of G-protein coupled receptor signaling pathway(GO:0038032) |
| 0.1 | 0.6 | GO:0018243 | protein O-linked glycosylation via threonine(GO:0018243) |
| 0.1 | 0.3 | GO:1904426 | positive regulation of GTP binding(GO:1904426) regulation of hydrogen:potassium-exchanging ATPase activity(GO:1904451) positive regulation of hydrogen:potassium-exchanging ATPase activity(GO:1904453) |
| 0.1 | 1.6 | GO:0030890 | positive regulation of B cell proliferation(GO:0030890) |
| 0.1 | 0.5 | GO:0006646 | phosphatidylethanolamine biosynthetic process(GO:0006646) |
| 0.1 | 2.3 | GO:0035458 | cellular response to interferon-beta(GO:0035458) |
| 0.1 | 1.1 | GO:2001275 | positive regulation of glucose import in response to insulin stimulus(GO:2001275) |
| 0.1 | 0.5 | GO:1903847 | regulation of aorta morphogenesis(GO:1903847) positive regulation of aorta morphogenesis(GO:1903849) |
| 0.1 | 0.6 | GO:0019800 | peptide cross-linking via chondroitin 4-sulfate glycosaminoglycan(GO:0019800) positive regulation of mitochondrial depolarization(GO:0051901) |
| 0.1 | 5.0 | GO:0001578 | microtubule bundle formation(GO:0001578) |
| 0.1 | 1.4 | GO:0033198 | response to ATP(GO:0033198) |
| 0.1 | 1.2 | GO:0014067 | negative regulation of phosphatidylinositol 3-kinase signaling(GO:0014067) |
| 0.1 | 0.3 | GO:0061086 | negative regulation of histone H3-K27 methylation(GO:0061086) |
| 0.1 | 1.5 | GO:0061099 | negative regulation of protein tyrosine kinase activity(GO:0061099) |
| 0.1 | 0.4 | GO:0001675 | acrosome assembly(GO:0001675) |
| 0.1 | 0.5 | GO:0045056 | transcytosis(GO:0045056) |
| 0.1 | 0.2 | GO:0072344 | rescue of stalled ribosome(GO:0072344) |
| 0.1 | 0.7 | GO:0070935 | 3'-UTR-mediated mRNA stabilization(GO:0070935) |
| 0.0 | 0.5 | GO:2000766 | negative regulation of cytoplasmic translation(GO:2000766) |
| 0.0 | 1.4 | GO:0071625 | vocalization behavior(GO:0071625) |
| 0.0 | 0.8 | GO:0046069 | cGMP catabolic process(GO:0046069) |
| 0.0 | 1.3 | GO:0008045 | motor neuron axon guidance(GO:0008045) |
| 0.0 | 0.3 | GO:0031848 | protection from non-homologous end joining at telomere(GO:0031848) |
| 0.0 | 1.9 | GO:0010501 | RNA secondary structure unwinding(GO:0010501) |
| 0.0 | 0.3 | GO:0015074 | DNA integration(GO:0015074) |
| 0.0 | 0.2 | GO:1900748 | positive regulation of vascular endothelial growth factor signaling pathway(GO:1900748) |
| 0.0 | 0.4 | GO:0060670 | branching involved in labyrinthine layer morphogenesis(GO:0060670) |
| 0.0 | 0.3 | GO:0035871 | protein K11-linked deubiquitination(GO:0035871) |
| 0.0 | 1.4 | GO:1900026 | positive regulation of substrate adhesion-dependent cell spreading(GO:1900026) |
| 0.0 | 0.5 | GO:0044342 | type B pancreatic cell proliferation(GO:0044342) |
| 0.0 | 0.3 | GO:0046485 | ether lipid metabolic process(GO:0046485) |
| 0.0 | 0.3 | GO:0000185 | activation of MAPKKK activity(GO:0000185) |
| 0.0 | 0.1 | GO:1903800 | positive regulation of production of miRNAs involved in gene silencing by miRNA(GO:1903800) |
| 0.0 | 0.5 | GO:0031998 | regulation of fatty acid beta-oxidation(GO:0031998) |
| 0.0 | 0.4 | GO:0060742 | epithelial cell differentiation involved in prostate gland development(GO:0060742) |
| 0.0 | 1.9 | GO:0042475 | odontogenesis of dentin-containing tooth(GO:0042475) |
| 0.0 | 0.7 | GO:0006491 | N-glycan processing(GO:0006491) |
| 0.0 | 0.7 | GO:0072337 | modified amino acid transport(GO:0072337) |
| 0.0 | 0.1 | GO:0016344 | meiotic chromosome movement towards spindle pole(GO:0016344) |
| 0.0 | 0.5 | GO:0001886 | endothelial cell morphogenesis(GO:0001886) |
| 0.0 | 0.4 | GO:0044804 | nucleophagy(GO:0044804) |
| 0.0 | 0.1 | GO:2000189 | positive regulation of cholesterol homeostasis(GO:2000189) |
| 0.0 | 0.3 | GO:0006750 | glutathione biosynthetic process(GO:0006750) |
| 0.0 | 1.6 | GO:0010811 | positive regulation of cell-substrate adhesion(GO:0010811) |
| 0.0 | 0.3 | GO:0050774 | negative regulation of dendrite morphogenesis(GO:0050774) |
| 0.0 | 0.6 | GO:0060325 | face morphogenesis(GO:0060325) |
| 0.0 | 0.1 | GO:0016584 | nucleosome positioning(GO:0016584) |
| 0.0 | 2.2 | GO:0006906 | vesicle fusion(GO:0006906) |
| 0.0 | 0.3 | GO:0097576 | autophagosome maturation(GO:0097352) vacuole fusion(GO:0097576) |
| 0.0 | 0.3 | GO:0034113 | heterotypic cell-cell adhesion(GO:0034113) |
| 0.0 | 0.8 | GO:0051438 | regulation of ubiquitin-protein transferase activity(GO:0051438) |
| 0.0 | 2.6 | GO:0006275 | regulation of DNA replication(GO:0006275) |
| 0.0 | 0.5 | GO:0006829 | zinc II ion transport(GO:0006829) |
| 0.0 | 0.4 | GO:0006221 | pyrimidine nucleotide biosynthetic process(GO:0006221) |
| 0.0 | 3.5 | GO:0006417 | regulation of translation(GO:0006417) |
| 0.0 | 1.7 | GO:0030534 | adult behavior(GO:0030534) |
| 0.0 | 0.1 | GO:0016973 | poly(A)+ mRNA export from nucleus(GO:0016973) |
Gene overrepresentation in cellular_component category:
| Log-likelihood per target | Total log-likelihood | Term | Description |
|---|---|---|---|
| 1.0 | 4.1 | GO:0043259 | laminin-1 complex(GO:0005606) laminin-10 complex(GO:0043259) |
| 1.0 | 5.0 | GO:0000015 | phosphopyruvate hydratase complex(GO:0000015) |
| 1.0 | 6.8 | GO:0005638 | lamin filament(GO:0005638) |
| 0.8 | 3.4 | GO:0070032 | synaptobrevin 2-SNAP-25-syntaxin-1a-complexin I complex(GO:0070032) synaptobrevin 2-SNAP-25-syntaxin-1a-complexin II complex(GO:0070033) |
| 0.7 | 7.4 | GO:0030130 | clathrin coat of trans-Golgi network vesicle(GO:0030130) |
| 0.6 | 2.5 | GO:0031673 | H zone(GO:0031673) |
| 0.6 | 1.8 | GO:0097512 | cardiac myofibril(GO:0097512) |
| 0.5 | 3.5 | GO:0034366 | spherical high-density lipoprotein particle(GO:0034366) neurofibrillary tangle(GO:0097418) |
| 0.4 | 3.2 | GO:0001520 | outer dense fiber(GO:0001520) |
| 0.4 | 1.2 | GO:0044754 | amphisome(GO:0044753) autolysosome(GO:0044754) |
| 0.4 | 2.7 | GO:0016461 | unconventional myosin complex(GO:0016461) |
| 0.3 | 1.5 | GO:0071439 | clathrin complex(GO:0071439) |
| 0.2 | 1.9 | GO:0005883 | neurofilament(GO:0005883) |
| 0.2 | 17.6 | GO:0042734 | presynaptic membrane(GO:0042734) |
| 0.2 | 0.6 | GO:0036488 | CHOP-C/EBP complex(GO:0036488) |
| 0.2 | 1.0 | GO:0012510 | trans-Golgi network transport vesicle membrane(GO:0012510) |
| 0.2 | 10.5 | GO:0009925 | basal plasma membrane(GO:0009925) |
| 0.2 | 1.0 | GO:0043564 | Ku70:Ku80 complex(GO:0043564) |
| 0.2 | 2.4 | GO:0034045 | pre-autophagosomal structure membrane(GO:0034045) |
| 0.1 | 1.9 | GO:0043235 | receptor complex(GO:0043235) |
| 0.1 | 5.1 | GO:0032281 | AMPA glutamate receptor complex(GO:0032281) |
| 0.1 | 4.1 | GO:0032809 | neuronal cell body membrane(GO:0032809) |
| 0.1 | 1.0 | GO:0032279 | asymmetric synapse(GO:0032279) |
| 0.1 | 1.4 | GO:0031229 | integral component of nuclear inner membrane(GO:0005639) intrinsic component of nuclear inner membrane(GO:0031229) |
| 0.1 | 0.4 | GO:0070436 | Grb2-EGFR complex(GO:0070436) |
| 0.1 | 1.3 | GO:0042581 | specific granule(GO:0042581) |
| 0.1 | 1.5 | GO:0035253 | ciliary rootlet(GO:0035253) |
| 0.1 | 0.9 | GO:0000138 | Golgi trans cisterna(GO:0000138) |
| 0.1 | 1.4 | GO:0034706 | voltage-gated sodium channel complex(GO:0001518) sodium channel complex(GO:0034706) |
| 0.1 | 0.3 | GO:0005927 | muscle tendon junction(GO:0005927) |
| 0.1 | 1.0 | GO:0008385 | IkappaB kinase complex(GO:0008385) |
| 0.1 | 3.0 | GO:0072562 | blood microparticle(GO:0072562) |
| 0.1 | 6.2 | GO:0005604 | basement membrane(GO:0005604) |
| 0.1 | 2.0 | GO:0046658 | anchored component of plasma membrane(GO:0046658) |
| 0.1 | 0.8 | GO:0031462 | Cul2-RING ubiquitin ligase complex(GO:0031462) |
| 0.1 | 3.3 | GO:0031985 | Golgi cisterna(GO:0031985) |
| 0.1 | 0.3 | GO:0097513 | myosin II filament(GO:0097513) |
| 0.0 | 0.6 | GO:0098644 | complex of collagen trimers(GO:0098644) |
| 0.0 | 5.6 | GO:0055037 | recycling endosome(GO:0055037) |
| 0.0 | 3.6 | GO:0043198 | dendritic shaft(GO:0043198) |
| 0.0 | 0.3 | GO:0070419 | nonhomologous end joining complex(GO:0070419) |
| 0.0 | 0.3 | GO:0032593 | insulin-responsive compartment(GO:0032593) |
| 0.0 | 1.2 | GO:0032420 | stereocilium(GO:0032420) |
| 0.0 | 6.0 | GO:0014069 | postsynaptic density(GO:0014069) postsynaptic specialization(GO:0099572) |
| 0.0 | 6.6 | GO:0045211 | postsynaptic membrane(GO:0045211) |
| 0.0 | 0.3 | GO:0005641 | nuclear envelope lumen(GO:0005641) |
| 0.0 | 6.0 | GO:0016324 | apical plasma membrane(GO:0016324) |
| 0.0 | 1.0 | GO:0000788 | nuclear nucleosome(GO:0000788) |
| 0.0 | 1.2 | GO:0005581 | collagen trimer(GO:0005581) |
| 0.0 | 0.1 | GO:0030478 | actin cap(GO:0030478) |
| 0.0 | 0.7 | GO:0005868 | cytoplasmic dynein complex(GO:0005868) |
| 0.0 | 0.4 | GO:0036038 | MKS complex(GO:0036038) |
| 0.0 | 1.4 | GO:0001726 | ruffle(GO:0001726) |
| 0.0 | 0.2 | GO:0020005 | symbiont-containing vacuole membrane(GO:0020005) |
| 0.0 | 3.7 | GO:0031253 | cell projection membrane(GO:0031253) |
| 0.0 | 0.4 | GO:0097038 | perinuclear endoplasmic reticulum(GO:0097038) |
| 0.0 | 0.4 | GO:0097440 | apical dendrite(GO:0097440) |
| 0.0 | 2.3 | GO:0043679 | axon terminus(GO:0043679) |
| 0.0 | 0.4 | GO:0000407 | pre-autophagosomal structure(GO:0000407) |
| 0.0 | 1.4 | GO:0030139 | endocytic vesicle(GO:0030139) |
| 0.0 | 0.1 | GO:0030127 | COPII vesicle coat(GO:0030127) |
| 0.0 | 0.7 | GO:0016592 | mediator complex(GO:0016592) |
| 0.0 | 0.1 | GO:0016593 | Cdc73/Paf1 complex(GO:0016593) |
| 0.0 | 0.1 | GO:0019773 | proteasome core complex, alpha-subunit complex(GO:0019773) |
| 0.0 | 0.6 | GO:0016459 | myosin complex(GO:0016459) |
| 0.0 | 2.3 | GO:0009898 | cytoplasmic side of plasma membrane(GO:0009898) |
| 0.0 | 0.9 | GO:0072686 | mitotic spindle(GO:0072686) |
| 0.0 | 0.3 | GO:0035098 | ESC/E(Z) complex(GO:0035098) |
| 0.0 | 9.5 | GO:0030529 | intracellular ribonucleoprotein complex(GO:0030529) ribonucleoprotein complex(GO:1990904) |
Gene overrepresentation in molecular_function category:
| Log-likelihood per target | Total log-likelihood | Term | Description |
|---|---|---|---|
| 2.9 | 11.6 | GO:0005008 | hepatocyte growth factor-activated receptor activity(GO:0005008) |
| 0.8 | 7.4 | GO:0032050 | clathrin heavy chain binding(GO:0032050) |
| 0.8 | 2.3 | GO:0051379 | epinephrine binding(GO:0051379) |
| 0.7 | 4.1 | GO:0005042 | netrin receptor activity(GO:0005042) |
| 0.6 | 5.0 | GO:0004634 | phosphopyruvate hydratase activity(GO:0004634) |
| 0.5 | 2.1 | GO:0008853 | exodeoxyribonuclease III activity(GO:0008853) |
| 0.5 | 4.1 | GO:0043208 | glycosphingolipid binding(GO:0043208) |
| 0.5 | 1.0 | GO:0005128 | erythropoietin receptor binding(GO:0005128) |
| 0.4 | 2.7 | GO:0001609 | G-protein coupled adenosine receptor activity(GO:0001609) |
| 0.4 | 1.1 | GO:0035175 | histone kinase activity (H3-S10 specific)(GO:0035175) |
| 0.4 | 1.1 | GO:1990450 | linear polyubiquitin binding(GO:1990450) |
| 0.4 | 2.2 | GO:0031802 | type 5 metabotropic glutamate receptor binding(GO:0031802) |
| 0.4 | 1.1 | GO:0034647 | histone demethylase activity (H3-trimethyl-K4 specific)(GO:0034647) |
| 0.3 | 11.3 | GO:0001106 | RNA polymerase II transcription corepressor activity(GO:0001106) |
| 0.3 | 1.3 | GO:0072320 | volume-sensitive chloride channel activity(GO:0072320) |
| 0.3 | 7.4 | GO:0017075 | syntaxin-1 binding(GO:0017075) |
| 0.3 | 3.2 | GO:0004017 | adenylate kinase activity(GO:0004017) |
| 0.2 | 6.8 | GO:0008157 | protein phosphatase 1 binding(GO:0008157) |
| 0.2 | 1.0 | GO:0050833 | pyruvate transmembrane transporter activity(GO:0050833) |
| 0.2 | 1.4 | GO:0035381 | extracellular ATP-gated cation channel activity(GO:0004931) ATP-gated ion channel activity(GO:0035381) |
| 0.2 | 0.9 | GO:0033188 | sphingomyelin synthase activity(GO:0033188) ceramide cholinephosphotransferase activity(GO:0047493) |
| 0.2 | 0.7 | GO:0004471 | malic enzyme activity(GO:0004470) malate dehydrogenase (decarboxylating) (NAD+) activity(GO:0004471) |
| 0.2 | 0.9 | GO:0034714 | type III transforming growth factor beta receptor binding(GO:0034714) |
| 0.2 | 5.5 | GO:0009931 | calcium-dependent protein serine/threonine kinase activity(GO:0009931) |
| 0.2 | 6.7 | GO:0042805 | actinin binding(GO:0042805) |
| 0.2 | 1.4 | GO:0086006 | voltage-gated sodium channel activity involved in cardiac muscle cell action potential(GO:0086006) |
| 0.2 | 3.5 | GO:1990841 | promoter-specific chromatin binding(GO:1990841) |
| 0.2 | 3.1 | GO:0008253 | 5'-nucleotidase activity(GO:0008253) |
| 0.2 | 4.2 | GO:0030676 | Rac guanyl-nucleotide exchange factor activity(GO:0030676) |
| 0.2 | 0.5 | GO:0004966 | galanin receptor activity(GO:0004966) |
| 0.2 | 1.1 | GO:0008486 | diphosphoinositol-polyphosphate diphosphatase activity(GO:0008486) |
| 0.2 | 0.7 | GO:0015220 | choline transmembrane transporter activity(GO:0015220) |
| 0.2 | 3.2 | GO:0050811 | GABA receptor binding(GO:0050811) |
| 0.2 | 0.5 | GO:0048248 | CXCR3 chemokine receptor binding(GO:0048248) |
| 0.2 | 1.3 | GO:0043423 | 3-phosphoinositide-dependent protein kinase binding(GO:0043423) |
| 0.2 | 2.7 | GO:0005545 | 1-phosphatidylinositol binding(GO:0005545) |
| 0.2 | 1.8 | GO:0043008 | ATP-dependent protein binding(GO:0043008) |
| 0.2 | 1.0 | GO:0016907 | G-protein coupled acetylcholine receptor activity(GO:0016907) |
| 0.2 | 2.5 | GO:0008307 | structural constituent of muscle(GO:0008307) |
| 0.2 | 3.5 | GO:0051787 | misfolded protein binding(GO:0051787) |
| 0.1 | 1.2 | GO:0005225 | volume-sensitive anion channel activity(GO:0005225) |
| 0.1 | 2.5 | GO:0003708 | retinoic acid receptor activity(GO:0003708) |
| 0.1 | 6.1 | GO:0001205 | transcriptional activator activity, RNA polymerase II distal enhancer sequence-specific binding(GO:0001205) |
| 0.1 | 0.4 | GO:0004942 | anaphylatoxin receptor activity(GO:0004942) |
| 0.1 | 2.9 | GO:0017160 | Ral GTPase binding(GO:0017160) |
| 0.1 | 0.7 | GO:0008454 | alpha-1,3-mannosylglycoprotein 4-beta-N-acetylglucosaminyltransferase activity(GO:0008454) |
| 0.1 | 3.0 | GO:0008327 | methyl-CpG binding(GO:0008327) |
| 0.1 | 0.4 | GO:0003883 | CTP synthase activity(GO:0003883) |
| 0.1 | 1.0 | GO:0048406 | nerve growth factor binding(GO:0048406) |
| 0.1 | 0.5 | GO:0004305 | ethanolamine kinase activity(GO:0004305) |
| 0.1 | 2.4 | GO:0080025 | phosphatidylinositol-3,5-bisphosphate binding(GO:0080025) |
| 0.1 | 1.5 | GO:0035612 | AP-2 adaptor complex binding(GO:0035612) |
| 0.1 | 3.6 | GO:0030215 | semaphorin receptor binding(GO:0030215) |
| 0.1 | 0.5 | GO:1990715 | mRNA CDS binding(GO:1990715) |
| 0.1 | 0.8 | GO:0015643 | toxic substance binding(GO:0015643) |
| 0.1 | 0.5 | GO:0015379 | potassium:chloride symporter activity(GO:0015379) potassium ion symporter activity(GO:0022820) |
| 0.1 | 1.5 | GO:0001968 | fibronectin binding(GO:0001968) |
| 0.1 | 1.7 | GO:0005337 | nucleoside transmembrane transporter activity(GO:0005337) |
| 0.1 | 5.3 | GO:0005518 | collagen binding(GO:0005518) |
| 0.1 | 1.5 | GO:0003777 | microtubule motor activity(GO:0003777) |
| 0.1 | 0.8 | GO:0016443 | bidentate ribonuclease III activity(GO:0016443) |
| 0.1 | 7.2 | GO:0004860 | protein kinase inhibitor activity(GO:0004860) |
| 0.1 | 0.3 | GO:0030898 | actin-dependent ATPase activity(GO:0030898) |
| 0.1 | 0.3 | GO:0031800 | type 3 metabotropic glutamate receptor binding(GO:0031800) |
| 0.1 | 0.3 | GO:0017151 | DEAD/H-box RNA helicase binding(GO:0017151) |
| 0.1 | 0.1 | GO:1901567 | icosanoid binding(GO:0050542) arachidonic acid binding(GO:0050544) fatty acid derivative binding(GO:1901567) |
| 0.1 | 1.1 | GO:0044183 | protein binding involved in protein folding(GO:0044183) |
| 0.1 | 0.6 | GO:0008140 | cAMP response element binding protein binding(GO:0008140) |
| 0.1 | 2.7 | GO:0043531 | ADP binding(GO:0043531) |
| 0.1 | 1.7 | GO:0003785 | actin monomer binding(GO:0003785) |
| 0.1 | 1.2 | GO:0050750 | low-density lipoprotein particle receptor binding(GO:0050750) |
| 0.1 | 0.3 | GO:0019784 | NEDD8-specific protease activity(GO:0019784) |
| 0.1 | 1.2 | GO:0070530 | K63-linked polyubiquitin binding(GO:0070530) |
| 0.1 | 0.3 | GO:0052654 | branched-chain-amino-acid transaminase activity(GO:0004084) L-leucine transaminase activity(GO:0052654) L-valine transaminase activity(GO:0052655) L-isoleucine transaminase activity(GO:0052656) |
| 0.0 | 0.3 | GO:0000014 | single-stranded DNA endodeoxyribonuclease activity(GO:0000014) |
| 0.0 | 0.8 | GO:0030553 | cGMP binding(GO:0030553) |
| 0.0 | 0.4 | GO:0005078 | MAP-kinase scaffold activity(GO:0005078) |
| 0.0 | 2.4 | GO:0017022 | myosin binding(GO:0017022) |
| 0.0 | 0.9 | GO:0030159 | receptor signaling complex scaffold activity(GO:0030159) |
| 0.0 | 0.3 | GO:0017034 | Rap guanyl-nucleotide exchange factor activity(GO:0017034) |
| 0.0 | 0.4 | GO:0005168 | neurotrophin TRKA receptor binding(GO:0005168) |
| 0.0 | 1.1 | GO:0035255 | ionotropic glutamate receptor binding(GO:0035255) |
| 0.0 | 1.0 | GO:0071889 | 14-3-3 protein binding(GO:0071889) |
| 0.0 | 0.3 | GO:0004416 | hydroxyacylglutathione hydrolase activity(GO:0004416) |
| 0.0 | 1.5 | GO:0046875 | ephrin receptor binding(GO:0046875) |
| 0.0 | 0.1 | GO:0071074 | eukaryotic initiation factor eIF2 binding(GO:0071074) |
| 0.0 | 1.0 | GO:0031492 | nucleosomal DNA binding(GO:0031492) |
| 0.0 | 2.7 | GO:0005089 | Rho guanyl-nucleotide exchange factor activity(GO:0005089) |
| 0.0 | 4.1 | GO:0030165 | PDZ domain binding(GO:0030165) |
| 0.0 | 1.8 | GO:0004722 | protein serine/threonine phosphatase activity(GO:0004722) |
| 0.0 | 0.6 | GO:0005184 | neuropeptide hormone activity(GO:0005184) |
| 0.0 | 1.9 | GO:0005080 | protein kinase C binding(GO:0005080) |
| 0.0 | 1.9 | GO:0008186 | ATP-dependent RNA helicase activity(GO:0004004) RNA-dependent ATPase activity(GO:0008186) |
| 0.0 | 0.4 | GO:0004190 | aspartic-type endopeptidase activity(GO:0004190) aspartic-type peptidase activity(GO:0070001) |
| 0.0 | 1.3 | GO:0030276 | clathrin binding(GO:0030276) |
| 0.0 | 5.9 | GO:0008017 | microtubule binding(GO:0008017) |
| 0.0 | 0.6 | GO:0005112 | Notch binding(GO:0005112) |
| 0.0 | 5.2 | GO:0005096 | GTPase activator activity(GO:0005096) |
| 0.0 | 2.3 | GO:0017124 | SH3 domain binding(GO:0017124) |
| 0.0 | 0.7 | GO:0003774 | motor activity(GO:0003774) |
| 0.0 | 0.7 | GO:0017091 | AU-rich element binding(GO:0017091) |
| 0.0 | 0.5 | GO:0005385 | zinc ion transmembrane transporter activity(GO:0005385) |
| 0.0 | 0.3 | GO:0050253 | prenylcysteine methylesterase activity(GO:0010296) 1-oxa-2-oxocycloheptane lactonase activity(GO:0018731) sulfolactone hydrolase activity(GO:0018732) butyrolactone hydrolase activity(GO:0018734) endosulfan lactone lactonase activity(GO:0034892) L-ascorbate 6-phosphate lactonase activity(GO:0035460) Ser-tRNA(Thr) hydrolase activity(GO:0043905) Ala-tRNA(Pro) hydrolase activity(GO:0043906) Cys-tRNA(Pro) hydrolase activity(GO:0043907) Ser(Gly)-tRNA(Ala) hydrolase activity(GO:0043908) all-trans-retinyl-palmitate hydrolase, all-trans-retinol forming activity(GO:0047376) retinyl-palmitate esterase activity(GO:0050253) mannosyl-oligosaccharide 1,6-alpha-mannosidase activity(GO:0052767) mannosyl-oligosaccharide 1,3-alpha-mannosidase activity(GO:0052768) methyl indole-3-acetate esterase activity(GO:0080030) methyl salicylate esterase activity(GO:0080031) methyl jasmonate esterase activity(GO:0080032) |
| 0.0 | 0.3 | GO:0070577 | lysine-acetylated histone binding(GO:0070577) |
| 0.0 | 0.9 | GO:0008138 | protein tyrosine/serine/threonine phosphatase activity(GO:0008138) |
| 0.0 | 1.6 | GO:0042626 | ATPase activity, coupled to transmembrane movement of substances(GO:0042626) |
| 0.0 | 0.2 | GO:0048407 | platelet-derived growth factor binding(GO:0048407) |
| 0.0 | 0.3 | GO:0001786 | phosphatidylserine binding(GO:0001786) |
| 0.0 | 0.8 | GO:0001104 | RNA polymerase II transcription cofactor activity(GO:0001104) |
|
|
|
|