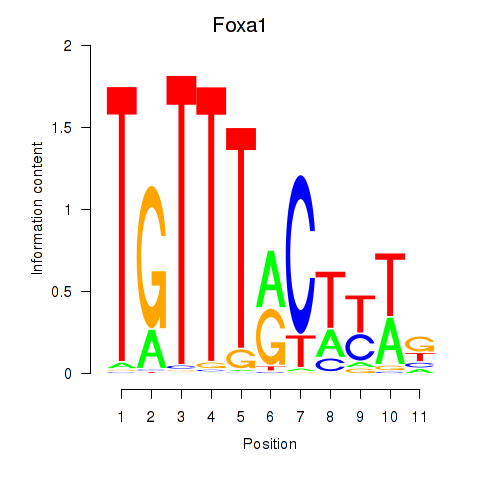
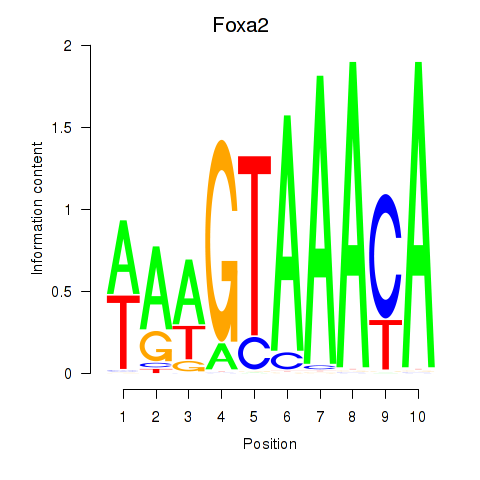
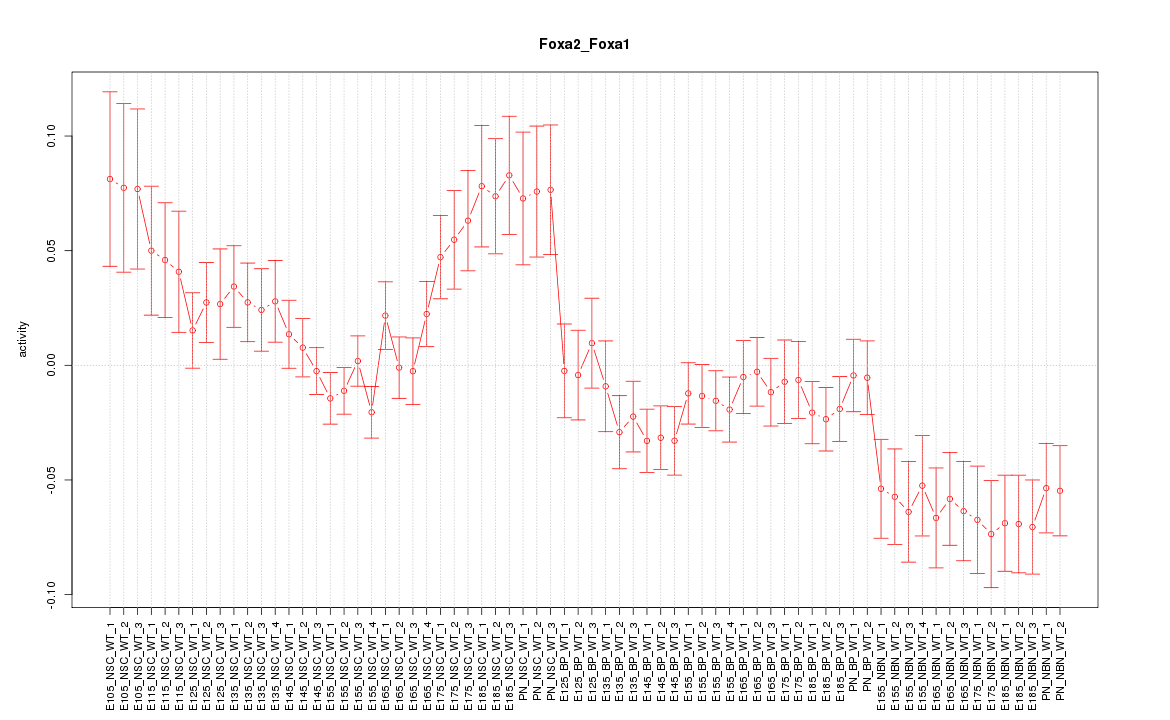
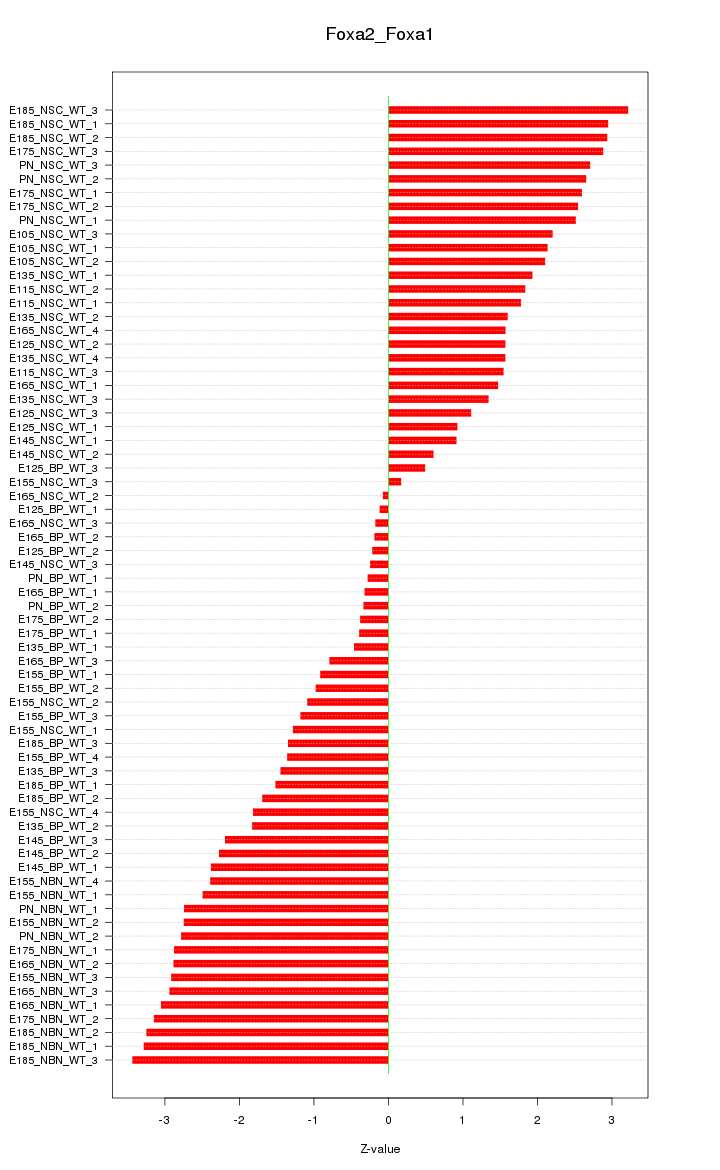
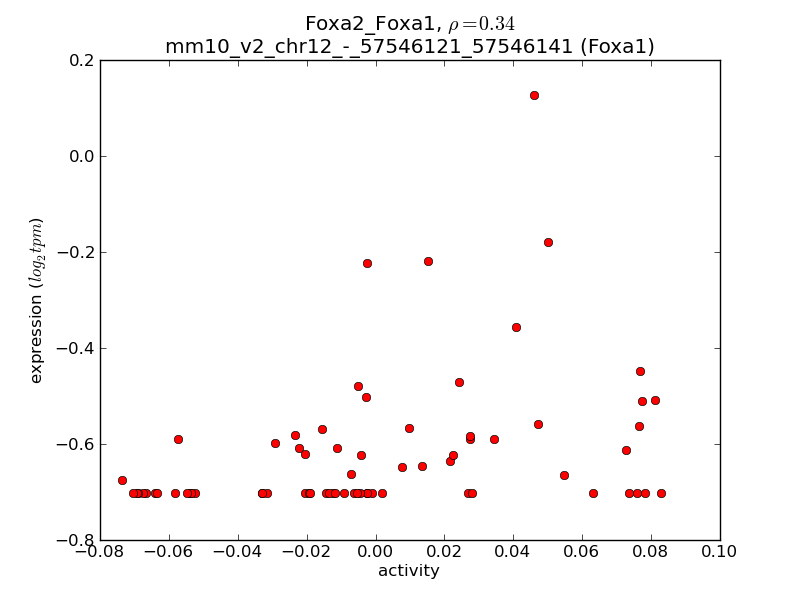
Motif ID: Foxa2_Foxa1
Z-value: 1.985
Transcription factors associated with Foxa2_Foxa1:
| Gene Symbol | Entrez ID | Gene Name |
|---|---|---|
| Foxa1 | ENSMUSG00000035451.6 | Foxa1 |
| Foxa2 | ENSMUSG00000037025.5 | Foxa2 |
Activity-expression correlation:
| Gene Symbol | Promoter | Pearson corr. coef. | P-value | Plot |
|---|---|---|---|---|
| Foxa2 | mm10_v2_chr2_-_148046896_148046991 | 0.45 | 7.9e-05 | Click! |
| Foxa1 | mm10_v2_chr12_-_57546121_57546141 | 0.34 | 3.5e-03 | Click! |

Top targets:
Gene overrepresentation in biological_process category:
| Log-likelihood per target | Total log-likelihood | Term | Description |
|---|---|---|---|
| 15.7 | 47.2 | GO:0021759 | globus pallidus development(GO:0021759) |
| 14.1 | 42.2 | GO:0035790 | platelet-derived growth factor receptor-alpha signaling pathway(GO:0035790) |
| 9.1 | 27.2 | GO:1902524 | negative regulation of interferon-alpha production(GO:0032687) interferon-alpha biosynthetic process(GO:0045349) regulation of interferon-alpha biosynthetic process(GO:0045354) negative regulation of interferon-beta biosynthetic process(GO:0045358) positive regulation of protein K48-linked ubiquitination(GO:1902524) |
| 9.0 | 36.1 | GO:0046552 | eye photoreceptor cell fate commitment(GO:0042706) photoreceptor cell fate commitment(GO:0046552) |
| 8.5 | 34.1 | GO:1904565 | response to 1-oleoyl-sn-glycerol 3-phosphate(GO:1904565) cellular response to 1-oleoyl-sn-glycerol 3-phosphate(GO:1904566) |
| 7.4 | 22.3 | GO:0060023 | soft palate development(GO:0060023) |
| 7.1 | 21.2 | GO:0072076 | hyaluranon cable assembly(GO:0036118) nephrogenic mesenchyme development(GO:0072076) negative regulation of glomerular mesangial cell proliferation(GO:0072125) negative regulation of glomerulus development(GO:0090194) regulation of hyaluranon cable assembly(GO:1900104) positive regulation of hyaluranon cable assembly(GO:1900106) |
| 5.5 | 16.6 | GO:0090258 | negative regulation of mitochondrial fission(GO:0090258) |
| 4.8 | 28.9 | GO:0032488 | Cdc42 protein signal transduction(GO:0032488) |
| 4.7 | 14.2 | GO:1904879 | positive regulation of calcium ion transmembrane transport via high voltage-gated calcium channel(GO:1904879) |
| 4.7 | 14.1 | GO:0021529 | spinal cord oligodendrocyte cell differentiation(GO:0021529) spinal cord oligodendrocyte cell fate specification(GO:0021530) |
| 4.6 | 23.2 | GO:0048133 | germ-line stem cell division(GO:0042078) male germ-line stem cell asymmetric division(GO:0048133) germline stem cell asymmetric division(GO:0098728) |
| 4.6 | 18.3 | GO:0072675 | osteoclast fusion(GO:0072675) |
| 4.6 | 13.7 | GO:0003278 | apoptotic process involved in heart morphogenesis(GO:0003278) |
| 4.1 | 16.5 | GO:0014846 | esophagus smooth muscle contraction(GO:0014846) negative regulation of prostatic bud formation(GO:0060686) |
| 4.1 | 12.2 | GO:0097402 | neuroblast migration(GO:0097402) |
| 4.0 | 15.9 | GO:0006867 | asparagine transport(GO:0006867) glutamine transport(GO:0006868) |
| 4.0 | 11.9 | GO:0042320 | regulation of circadian sleep/wake cycle, REM sleep(GO:0042320) circadian sleep/wake cycle, REM sleep(GO:0042747) positive regulation of circadian sleep/wake cycle, sleep(GO:0045938) |
| 3.8 | 11.3 | GO:0014738 | regulation of muscle hyperplasia(GO:0014738) muscle hyperplasia(GO:0014900) |
| 3.3 | 36.4 | GO:0042473 | outer ear morphogenesis(GO:0042473) |
| 3.2 | 25.6 | GO:0048625 | myoblast fate commitment(GO:0048625) |
| 3.2 | 35.0 | GO:0032525 | somite rostral/caudal axis specification(GO:0032525) |
| 3.1 | 18.4 | GO:0060665 | regulation of branching involved in salivary gland morphogenesis by mesenchymal-epithelial signaling(GO:0060665) |
| 3.0 | 30.0 | GO:2001214 | positive regulation of vasculogenesis(GO:2001214) |
| 2.9 | 5.9 | GO:0001705 | ectoderm formation(GO:0001705) |
| 2.7 | 5.4 | GO:0072095 | regulation of branch elongation involved in ureteric bud branching(GO:0072095) |
| 2.7 | 42.9 | GO:0048387 | negative regulation of retinoic acid receptor signaling pathway(GO:0048387) |
| 2.3 | 7.0 | GO:0045659 | regulation of neutrophil differentiation(GO:0045658) negative regulation of neutrophil differentiation(GO:0045659) |
| 2.2 | 8.8 | GO:2000675 | negative regulation of type B pancreatic cell apoptotic process(GO:2000675) |
| 2.2 | 6.6 | GO:0045819 | positive regulation of glycogen catabolic process(GO:0045819) |
| 2.1 | 6.4 | GO:1900158 | negative regulation of bone mineralization involved in bone maturation(GO:1900158) |
| 2.1 | 6.2 | GO:0021797 | forebrain anterior/posterior pattern specification(GO:0021797) |
| 2.0 | 10.2 | GO:2000483 | negative regulation of interleukin-8 secretion(GO:2000483) |
| 2.0 | 8.1 | GO:0071930 | negative regulation of transcription involved in G1/S transition of mitotic cell cycle(GO:0071930) |
| 2.0 | 20.1 | GO:0071763 | nuclear membrane organization(GO:0071763) |
| 2.0 | 2.0 | GO:0060681 | branch elongation involved in ureteric bud branching(GO:0060681) |
| 1.8 | 11.1 | GO:0046602 | regulation of mitotic centrosome separation(GO:0046602) |
| 1.7 | 19.2 | GO:0060539 | diaphragm development(GO:0060539) |
| 1.7 | 10.1 | GO:0097368 | establishment of Sertoli cell barrier(GO:0097368) |
| 1.6 | 8.0 | GO:0031860 | telomeric 3' overhang formation(GO:0031860) |
| 1.6 | 4.7 | GO:0032696 | neutrophil differentiation(GO:0030223) negative regulation of interleukin-13 production(GO:0032696) trachea submucosa development(GO:0061152) trachea gland development(GO:0061153) odontoblast differentiation(GO:0071895) regulation of estrogen receptor binding(GO:0071898) negative regulation of estrogen receptor binding(GO:0071899) |
| 1.5 | 7.7 | GO:2000680 | regulation of rubidium ion transport(GO:2000680) |
| 1.5 | 4.4 | GO:0035582 | sequestering of BMP in extracellular matrix(GO:0035582) |
| 1.5 | 8.8 | GO:0003383 | apical constriction(GO:0003383) |
| 1.5 | 4.4 | GO:0072356 | chromosome passenger complex localization to kinetochore(GO:0072356) |
| 1.4 | 46.5 | GO:0006270 | DNA replication initiation(GO:0006270) |
| 1.3 | 35.8 | GO:0007638 | mechanosensory behavior(GO:0007638) |
| 1.3 | 3.8 | GO:0038165 | oncostatin-M-mediated signaling pathway(GO:0038165) regulation of interleukin-6-mediated signaling pathway(GO:0070103) negative regulation of interleukin-6-mediated signaling pathway(GO:0070104) |
| 1.2 | 6.2 | GO:0038018 | Wnt receptor catabolic process(GO:0038018) |
| 1.2 | 6.2 | GO:0050847 | progesterone receptor signaling pathway(GO:0050847) |
| 1.2 | 4.9 | GO:2001032 | regulation of double-strand break repair via nonhomologous end joining(GO:2001032) |
| 1.1 | 5.7 | GO:0006447 | regulation of translational initiation by iron(GO:0006447) positive regulation of translational initiation by iron(GO:0045994) |
| 1.1 | 5.3 | GO:2000325 | regulation of ligand-dependent nuclear receptor transcription coactivator activity(GO:2000325) positive regulation of ligand-dependent nuclear receptor transcription coactivator activity(GO:2000327) |
| 1.0 | 20.8 | GO:1904355 | positive regulation of telomere capping(GO:1904355) |
| 1.0 | 2.9 | GO:0035701 | hematopoietic stem cell migration(GO:0035701) |
| 0.9 | 3.7 | GO:0002572 | pro-T cell differentiation(GO:0002572) |
| 0.9 | 7.1 | GO:0015074 | DNA integration(GO:0015074) |
| 0.8 | 15.6 | GO:2001224 | positive regulation of neuron migration(GO:2001224) |
| 0.8 | 5.4 | GO:0090091 | positive regulation of extracellular matrix disassembly(GO:0090091) |
| 0.8 | 7.7 | GO:0051574 | positive regulation of histone H3-K9 methylation(GO:0051574) |
| 0.8 | 2.3 | GO:0016332 | establishment or maintenance of polarity of embryonic epithelium(GO:0016332) |
| 0.8 | 3.8 | GO:0070574 | cadmium ion transport(GO:0015691) cadmium ion transmembrane transport(GO:0070574) |
| 0.7 | 6.5 | GO:0031339 | negative regulation of vesicle fusion(GO:0031339) |
| 0.7 | 9.1 | GO:0001672 | regulation of chromatin assembly or disassembly(GO:0001672) |
| 0.7 | 2.1 | GO:0007521 | muscle cell fate determination(GO:0007521) mammary placode formation(GO:0060596) |
| 0.6 | 6.3 | GO:0090557 | establishment of endothelial intestinal barrier(GO:0090557) |
| 0.6 | 2.5 | GO:0007412 | axon target recognition(GO:0007412) |
| 0.6 | 2.4 | GO:2000271 | positive regulation of fibroblast apoptotic process(GO:2000271) |
| 0.6 | 13.4 | GO:0006825 | copper ion transport(GO:0006825) |
| 0.6 | 12.6 | GO:0006883 | cellular sodium ion homeostasis(GO:0006883) |
| 0.6 | 13.9 | GO:1902043 | positive regulation of extrinsic apoptotic signaling pathway via death domain receptors(GO:1902043) |
| 0.5 | 4.2 | GO:0008063 | Toll signaling pathway(GO:0008063) |
| 0.5 | 2.0 | GO:0034392 | negative regulation of smooth muscle cell apoptotic process(GO:0034392) |
| 0.5 | 7.7 | GO:0048642 | negative regulation of skeletal muscle tissue development(GO:0048642) |
| 0.5 | 1.4 | GO:0042663 | regulation of endodermal cell fate specification(GO:0042663) |
| 0.5 | 2.7 | GO:0046909 | intermembrane transport(GO:0046909) |
| 0.4 | 2.7 | GO:2000210 | positive regulation of anoikis(GO:2000210) |
| 0.4 | 2.6 | GO:0033625 | positive regulation of integrin activation(GO:0033625) |
| 0.4 | 3.9 | GO:0030206 | chondroitin sulfate biosynthetic process(GO:0030206) |
| 0.4 | 4.5 | GO:0007221 | positive regulation of transcription of Notch receptor target(GO:0007221) |
| 0.4 | 1.6 | GO:0007171 | activation of transmembrane receptor protein tyrosine kinase activity(GO:0007171) |
| 0.4 | 3.2 | GO:0015868 | purine ribonucleotide transport(GO:0015868) |
| 0.3 | 2.0 | GO:0003065 | positive regulation of heart rate by epinephrine(GO:0003065) |
| 0.3 | 18.5 | GO:0006940 | regulation of smooth muscle contraction(GO:0006940) |
| 0.3 | 11.8 | GO:0050982 | detection of mechanical stimulus(GO:0050982) |
| 0.3 | 1.8 | GO:0016048 | detection of temperature stimulus(GO:0016048) |
| 0.3 | 3.8 | GO:0060746 | parental behavior(GO:0060746) |
| 0.3 | 2.6 | GO:0048386 | positive regulation of retinoic acid receptor signaling pathway(GO:0048386) |
| 0.3 | 1.3 | GO:0050747 | positive regulation of lipoprotein metabolic process(GO:0050747) |
| 0.3 | 1.9 | GO:0001887 | selenium compound metabolic process(GO:0001887) |
| 0.3 | 1.8 | GO:0015840 | urea transport(GO:0015840) urea transmembrane transport(GO:0071918) |
| 0.3 | 0.5 | GO:0060528 | secretory columnal luminar epithelial cell differentiation involved in prostate glandular acinus development(GO:0060528) |
| 0.2 | 13.8 | GO:0030500 | regulation of bone mineralization(GO:0030500) |
| 0.2 | 1.4 | GO:0052695 | cellular glucuronidation(GO:0052695) |
| 0.2 | 2.3 | GO:0009404 | toxin metabolic process(GO:0009404) |
| 0.2 | 4.7 | GO:0002011 | morphogenesis of an epithelial sheet(GO:0002011) |
| 0.2 | 6.7 | GO:0003333 | amino acid transmembrane transport(GO:0003333) |
| 0.2 | 1.6 | GO:0016188 | synaptic vesicle maturation(GO:0016188) |
| 0.2 | 1.6 | GO:0071493 | cellular response to UV-B(GO:0071493) |
| 0.2 | 50.6 | GO:0042060 | wound healing(GO:0042060) |
| 0.2 | 2.3 | GO:0033572 | transferrin transport(GO:0033572) |
| 0.2 | 1.0 | GO:0030644 | cellular chloride ion homeostasis(GO:0030644) |
| 0.2 | 7.5 | GO:0002066 | columnar/cuboidal epithelial cell development(GO:0002066) |
| 0.2 | 9.8 | GO:0048663 | neuron fate commitment(GO:0048663) |
| 0.2 | 4.3 | GO:0019432 | triglyceride biosynthetic process(GO:0019432) |
| 0.1 | 1.0 | GO:1903301 | positive regulation of glucokinase activity(GO:0033133) positive regulation of hexokinase activity(GO:1903301) |
| 0.1 | 1.9 | GO:1990403 | embryonic brain development(GO:1990403) |
| 0.1 | 3.9 | GO:2000463 | positive regulation of excitatory postsynaptic potential(GO:2000463) |
| 0.1 | 0.9 | GO:0002689 | negative regulation of leukocyte chemotaxis(GO:0002689) |
| 0.1 | 2.3 | GO:0045653 | negative regulation of megakaryocyte differentiation(GO:0045653) |
| 0.1 | 0.7 | GO:0006046 | N-acetylglucosamine catabolic process(GO:0006046) |
| 0.1 | 6.2 | GO:0050868 | negative regulation of T cell activation(GO:0050868) |
| 0.1 | 1.8 | GO:0060972 | left/right pattern formation(GO:0060972) |
| 0.1 | 0.2 | GO:0071896 | protein localization to adherens junction(GO:0071896) |
| 0.1 | 5.5 | GO:0043268 | positive regulation of potassium ion transport(GO:0043268) |
| 0.1 | 3.1 | GO:0045214 | sarcomere organization(GO:0045214) |
| 0.1 | 0.5 | GO:0051967 | negative regulation of synaptic transmission, glutamatergic(GO:0051967) |
| 0.1 | 0.7 | GO:0006686 | sphingomyelin biosynthetic process(GO:0006686) |
| 0.1 | 9.2 | GO:0030326 | embryonic limb morphogenesis(GO:0030326) embryonic appendage morphogenesis(GO:0035113) |
| 0.1 | 2.5 | GO:0090200 | positive regulation of release of cytochrome c from mitochondria(GO:0090200) |
| 0.1 | 1.1 | GO:0017144 | drug metabolic process(GO:0017144) |
| 0.1 | 4.0 | GO:0030490 | maturation of SSU-rRNA(GO:0030490) |
| 0.1 | 3.8 | GO:0007029 | endoplasmic reticulum organization(GO:0007029) |
| 0.1 | 0.6 | GO:0000083 | regulation of transcription involved in G1/S transition of mitotic cell cycle(GO:0000083) |
| 0.1 | 0.3 | GO:0009597 | detection of virus(GO:0009597) |
| 0.1 | 2.3 | GO:0007026 | negative regulation of microtubule depolymerization(GO:0007026) |
| 0.1 | 1.3 | GO:0006625 | protein targeting to peroxisome(GO:0006625) peroxisomal transport(GO:0043574) protein localization to peroxisome(GO:0072662) establishment of protein localization to peroxisome(GO:0072663) |
| 0.1 | 1.7 | GO:1902230 | negative regulation of intrinsic apoptotic signaling pathway in response to DNA damage(GO:1902230) |
| 0.1 | 0.6 | GO:0060394 | negative regulation of pathway-restricted SMAD protein phosphorylation(GO:0060394) |
| 0.0 | 1.9 | GO:0030324 | lung development(GO:0030324) |
| 0.0 | 5.5 | GO:0051297 | centrosome organization(GO:0051297) |
| 0.0 | 0.6 | GO:0033194 | response to hydroperoxide(GO:0033194) |
| 0.0 | 0.9 | GO:0030865 | cortical cytoskeleton organization(GO:0030865) |
| 0.0 | 0.9 | GO:0030514 | negative regulation of BMP signaling pathway(GO:0030514) |
| 0.0 | 0.2 | GO:0032020 | ISG15-protein conjugation(GO:0032020) |
| 0.0 | 0.5 | GO:0016486 | peptide hormone processing(GO:0016486) |
| 0.0 | 3.9 | GO:0006814 | sodium ion transport(GO:0006814) |
| 0.0 | 1.1 | GO:0008360 | regulation of cell shape(GO:0008360) |
| 0.0 | 2.6 | GO:0051028 | mRNA transport(GO:0051028) |
| 0.0 | 0.5 | GO:0051591 | response to cAMP(GO:0051591) |
| 0.0 | 0.2 | GO:0071025 | RNA surveillance(GO:0071025) |
Gene overrepresentation in cellular_component category:
| Log-likelihood per target | Total log-likelihood | Term | Description |
|---|---|---|---|
| 7.5 | 30.0 | GO:0031466 | Cul5-RING ubiquitin ligase complex(GO:0031466) |
| 3.5 | 14.1 | GO:0097487 | multivesicular body, internal vesicle(GO:0097487) |
| 2.8 | 25.6 | GO:0070369 | beta-catenin-TCF7L2 complex(GO:0070369) |
| 2.3 | 4.7 | GO:1990907 | beta-catenin-TCF complex(GO:1990907) |
| 2.1 | 18.5 | GO:0030478 | actin cap(GO:0030478) |
| 1.6 | 8.1 | GO:0035189 | Rb-E2F complex(GO:0035189) |
| 1.4 | 14.2 | GO:1990454 | L-type voltage-gated calcium channel complex(GO:1990454) |
| 1.3 | 8.0 | GO:0030870 | Mre11 complex(GO:0030870) |
| 1.3 | 3.8 | GO:0005896 | interleukin-6 receptor complex(GO:0005896) |
| 1.3 | 40.1 | GO:0046658 | anchored component of plasma membrane(GO:0046658) |
| 1.1 | 8.8 | GO:0033269 | internode region of axon(GO:0033269) |
| 1.0 | 10.1 | GO:0030285 | integral component of synaptic vesicle membrane(GO:0030285) intrinsic component of synaptic vesicle membrane(GO:0098563) |
| 1.0 | 14.6 | GO:0042555 | MCM complex(GO:0042555) |
| 0.7 | 4.9 | GO:0001940 | male pronucleus(GO:0001940) |
| 0.7 | 27.8 | GO:0005719 | nuclear euchromatin(GO:0005719) |
| 0.6 | 3.1 | GO:1990357 | terminal web(GO:1990357) |
| 0.5 | 1.6 | GO:0070557 | PCNA-p21 complex(GO:0070557) |
| 0.5 | 41.2 | GO:0005902 | microvillus(GO:0005902) |
| 0.5 | 4.1 | GO:0046581 | intercellular canaliculus(GO:0046581) |
| 0.4 | 4.4 | GO:1990023 | mitotic spindle midzone(GO:1990023) |
| 0.4 | 35.7 | GO:0031225 | anchored component of membrane(GO:0031225) |
| 0.3 | 1.0 | GO:0043540 | 6-phosphofructo-2-kinase/fructose-2,6-biphosphatase complex(GO:0043540) |
| 0.3 | 11.8 | GO:0030904 | retromer complex(GO:0030904) |
| 0.3 | 34.1 | GO:0043198 | dendritic shaft(GO:0043198) |
| 0.3 | 103.1 | GO:0031012 | extracellular matrix(GO:0031012) |
| 0.3 | 3.7 | GO:0005922 | connexon complex(GO:0005922) |
| 0.2 | 2.6 | GO:0097470 | ribbon synapse(GO:0097470) |
| 0.2 | 2.6 | GO:0005688 | U6 snRNP(GO:0005688) |
| 0.2 | 2.7 | GO:0070822 | Sin3-type complex(GO:0070822) |
| 0.2 | 1.1 | GO:0000308 | cytoplasmic cyclin-dependent protein kinase holoenzyme complex(GO:0000308) |
| 0.2 | 2.0 | GO:0005862 | muscle thin filament tropomyosin(GO:0005862) |
| 0.2 | 8.4 | GO:0000315 | organellar large ribosomal subunit(GO:0000315) mitochondrial large ribosomal subunit(GO:0005762) |
| 0.2 | 0.7 | GO:0031230 | intrinsic component of cell outer membrane(GO:0031230) integral component of cell outer membrane(GO:0045203) |
| 0.2 | 1.8 | GO:0044292 | dendrite terminus(GO:0044292) |
| 0.2 | 13.6 | GO:0017053 | transcriptional repressor complex(GO:0017053) |
| 0.2 | 68.7 | GO:0005667 | transcription factor complex(GO:0005667) |
| 0.2 | 8.0 | GO:0005876 | spindle microtubule(GO:0005876) |
| 0.1 | 7.4 | GO:0001750 | photoreceptor outer segment(GO:0001750) |
| 0.1 | 15.5 | GO:0016324 | apical plasma membrane(GO:0016324) |
| 0.1 | 5.0 | GO:0001772 | immunological synapse(GO:0001772) |
| 0.1 | 18.3 | GO:0043296 | apical junction complex(GO:0043296) |
| 0.1 | 22.6 | GO:0030426 | growth cone(GO:0030426) |
| 0.1 | 1.9 | GO:0000242 | pericentriolar material(GO:0000242) |
| 0.1 | 0.4 | GO:0001652 | granular component(GO:0001652) |
| 0.1 | 20.5 | GO:0016323 | basolateral plasma membrane(GO:0016323) |
| 0.1 | 6.4 | GO:0032432 | actin filament bundle(GO:0032432) |
| 0.1 | 0.5 | GO:0032983 | kainate selective glutamate receptor complex(GO:0032983) |
| 0.1 | 0.4 | GO:0001674 | female germ cell nucleus(GO:0001674) |
| 0.1 | 6.3 | GO:0005901 | caveola(GO:0005901) |
| 0.1 | 1.3 | GO:0031526 | brush border membrane(GO:0031526) |
| 0.1 | 2.3 | GO:0030667 | secretory granule membrane(GO:0030667) |
| 0.1 | 10.2 | GO:0045121 | membrane raft(GO:0045121) membrane microdomain(GO:0098857) |
| 0.1 | 1.2 | GO:0005852 | eukaryotic translation initiation factor 3 complex(GO:0005852) |
| 0.1 | 1.5 | GO:0032587 | ruffle membrane(GO:0032587) |
| 0.1 | 1.5 | GO:0016592 | mediator complex(GO:0016592) |
| 0.0 | 1.6 | GO:0031594 | neuromuscular junction(GO:0031594) |
| 0.0 | 1.5 | GO:0030686 | 90S preribosome(GO:0030686) |
| 0.0 | 1.5 | GO:0030864 | cortical actin cytoskeleton(GO:0030864) |
| 0.0 | 2.1 | GO:0000786 | nucleosome(GO:0000786) |
| 0.0 | 1.1 | GO:0000118 | histone deacetylase complex(GO:0000118) |
| 0.0 | 2.8 | GO:0030496 | midbody(GO:0030496) |
| 0.0 | 72.9 | GO:0005654 | nucleoplasm(GO:0005654) |
| 0.0 | 0.6 | GO:0005581 | collagen trimer(GO:0005581) |
| 0.0 | 0.4 | GO:0042470 | melanosome(GO:0042470) pigment granule(GO:0048770) |
| 0.0 | 6.5 | GO:0005925 | focal adhesion(GO:0005925) |
| 0.0 | 6.5 | GO:0005635 | nuclear envelope(GO:0005635) |
| 0.0 | 1.7 | GO:0030659 | cytoplasmic vesicle membrane(GO:0030659) |
| 0.0 | 2.7 | GO:0005929 | cilium(GO:0005929) |
Gene overrepresentation in molecular_function category:
| Log-likelihood per target | Total log-likelihood | Term | Description |
|---|---|---|---|
| 12.6 | 50.5 | GO:0032422 | purine-rich negative regulatory element binding(GO:0032422) |
| 8.4 | 42.2 | GO:0038085 | vascular endothelial growth factor binding(GO:0038085) |
| 7.2 | 43.3 | GO:0035727 | lysophosphatidic acid binding(GO:0035727) lysophosphatidic acid receptor activity(GO:0070915) |
| 3.9 | 47.2 | GO:0001161 | intronic transcription regulatory region sequence-specific DNA binding(GO:0001161) |
| 3.3 | 16.5 | GO:0008449 | N-acetylglucosamine-6-sulfatase activity(GO:0008449) |
| 3.2 | 15.9 | GO:0015186 | L-asparagine transmembrane transporter activity(GO:0015182) L-glutamine transmembrane transporter activity(GO:0015186) |
| 2.8 | 14.2 | GO:0086056 | voltage-gated calcium channel activity involved in AV node cell action potential(GO:0086056) |
| 2.7 | 13.4 | GO:0016724 | ferroxidase activity(GO:0004322) oxidoreductase activity, oxidizing metal ions, oxygen as acceptor(GO:0016724) |
| 2.5 | 7.5 | GO:0008502 | melatonin receptor activity(GO:0008502) |
| 2.2 | 6.6 | GO:0000402 | open form four-way junction DNA binding(GO:0000401) crossed form four-way junction DNA binding(GO:0000402) |
| 2.1 | 21.2 | GO:0070700 | BMP receptor binding(GO:0070700) |
| 1.6 | 35.6 | GO:0070410 | co-SMAD binding(GO:0070410) |
| 1.6 | 16.0 | GO:0001134 | transcription factor activity, transcription factor recruiting(GO:0001134) |
| 1.5 | 4.4 | GO:0016015 | morphogen activity(GO:0016015) |
| 1.4 | 4.3 | GO:0008195 | phosphatidate phosphatase activity(GO:0008195) |
| 1.3 | 3.8 | GO:0004923 | leukemia inhibitory factor receptor activity(GO:0004923) oncostatin-M receptor activity(GO:0004924) |
| 1.2 | 29.0 | GO:0045295 | gamma-catenin binding(GO:0045295) |
| 1.0 | 16.6 | GO:1990841 | promoter-specific chromatin binding(GO:1990841) |
| 1.0 | 2.9 | GO:0016494 | C-X-C chemokine receptor activity(GO:0016494) |
| 0.9 | 5.7 | GO:0070644 | vitamin D response element binding(GO:0070644) |
| 0.9 | 18.4 | GO:0042056 | chemoattractant activity(GO:0042056) |
| 0.9 | 20.1 | GO:0005521 | lamin binding(GO:0005521) |
| 0.8 | 8.0 | GO:0000014 | single-stranded DNA endodeoxyribonuclease activity(GO:0000014) |
| 0.8 | 2.3 | GO:0016715 | oxidoreductase activity, acting on paired donors, with incorporation or reduction of molecular oxygen, reduced ascorbate as one donor, and incorporation of one atom of oxygen(GO:0016715) |
| 0.7 | 11.1 | GO:0008574 | ATP-dependent microtubule motor activity, plus-end-directed(GO:0008574) |
| 0.7 | 17.5 | GO:0050431 | transforming growth factor beta binding(GO:0050431) |
| 0.7 | 33.5 | GO:0016538 | cyclin-dependent protein serine/threonine kinase regulator activity(GO:0016538) |
| 0.7 | 2.0 | GO:0031826 | type 2A serotonin receptor binding(GO:0031826) |
| 0.7 | 12.2 | GO:0001222 | transcription corepressor binding(GO:0001222) |
| 0.7 | 14.7 | GO:0005520 | insulin-like growth factor binding(GO:0005520) |
| 0.7 | 7.3 | GO:0044323 | retinoic acid-responsive element binding(GO:0044323) |
| 0.6 | 5.4 | GO:0038062 | protein tyrosine kinase collagen receptor activity(GO:0038062) |
| 0.5 | 4.1 | GO:0103116 | alpha-D-galactofuranose transporter activity(GO:0103116) |
| 0.5 | 3.9 | GO:0015165 | pyrimidine nucleotide-sugar transmembrane transporter activity(GO:0015165) |
| 0.4 | 7.0 | GO:0055106 | ubiquitin-protein transferase regulator activity(GO:0055106) |
| 0.4 | 1.6 | GO:0005176 | ErbB-2 class receptor binding(GO:0005176) |
| 0.4 | 6.4 | GO:0031005 | filamin binding(GO:0031005) |
| 0.4 | 3.5 | GO:0001206 | transcriptional repressor activity, RNA polymerase II distal enhancer sequence-specific binding(GO:0001206) |
| 0.3 | 6.2 | GO:0017081 | chloride channel regulator activity(GO:0017081) |
| 0.3 | 12.1 | GO:0005109 | frizzled binding(GO:0005109) |
| 0.3 | 5.3 | GO:0004535 | poly(A)-specific ribonuclease activity(GO:0004535) |
| 0.3 | 12.8 | GO:0051059 | NF-kappaB binding(GO:0051059) |
| 0.3 | 6.4 | GO:0071855 | neuropeptide receptor binding(GO:0071855) |
| 0.3 | 1.8 | GO:0015265 | urea channel activity(GO:0015265) |
| 0.3 | 3.6 | GO:0031492 | nucleosomal DNA binding(GO:0031492) |
| 0.3 | 11.8 | GO:0017112 | Rab guanyl-nucleotide exchange factor activity(GO:0017112) |
| 0.3 | 14.6 | GO:0004003 | ATP-dependent DNA helicase activity(GO:0004003) |
| 0.3 | 7.2 | GO:0001786 | phosphatidylserine binding(GO:0001786) |
| 0.3 | 1.1 | GO:0031735 | CCR10 chemokine receptor binding(GO:0031735) receptor agonist activity(GO:0048018) |
| 0.3 | 8.8 | GO:0030332 | cyclin binding(GO:0030332) |
| 0.3 | 3.2 | GO:0005243 | gap junction channel activity(GO:0005243) |
| 0.3 | 3.6 | GO:0015197 | peptide transporter activity(GO:0015197) |
| 0.2 | 3.9 | GO:0015129 | lactate transmembrane transporter activity(GO:0015129) |
| 0.2 | 5.0 | GO:0004012 | phospholipid-translocating ATPase activity(GO:0004012) |
| 0.2 | 8.8 | GO:0032266 | phosphatidylinositol-3-phosphate binding(GO:0032266) |
| 0.2 | 87.8 | GO:0001159 | core promoter proximal region DNA binding(GO:0001159) |
| 0.2 | 1.3 | GO:0008429 | phosphatidylethanolamine binding(GO:0008429) |
| 0.2 | 11.0 | GO:0004869 | cysteine-type endopeptidase inhibitor activity(GO:0004869) |
| 0.2 | 1.1 | GO:0008392 | arachidonic acid monooxygenase activity(GO:0008391) arachidonic acid epoxygenase activity(GO:0008392) |
| 0.2 | 2.6 | GO:0048027 | mRNA 5'-UTR binding(GO:0048027) |
| 0.2 | 7.2 | GO:0030215 | semaphorin receptor binding(GO:0030215) |
| 0.2 | 0.7 | GO:0033188 | sphingomyelin synthase activity(GO:0033188) ceramide cholinephosphotransferase activity(GO:0047493) |
| 0.2 | 3.1 | GO:0008307 | structural constituent of muscle(GO:0008307) |
| 0.2 | 2.0 | GO:0044548 | S100 protein binding(GO:0044548) |
| 0.1 | 1.0 | GO:0070095 | fructose-6-phosphate binding(GO:0070095) |
| 0.1 | 26.4 | GO:0004930 | G-protein coupled receptor activity(GO:0004930) |
| 0.1 | 3.8 | GO:0005385 | zinc ion transmembrane transporter activity(GO:0005385) |
| 0.1 | 2.2 | GO:0004000 | adenosine deaminase activity(GO:0004000) |
| 0.1 | 13.5 | GO:0005178 | integrin binding(GO:0005178) |
| 0.1 | 0.4 | GO:0016716 | oxidoreductase activity, acting on paired donors, with incorporation or reduction of molecular oxygen, another compound as one donor, and incorporation of one atom of oxygen(GO:0016716) |
| 0.1 | 1.9 | GO:0008430 | selenium binding(GO:0008430) |
| 0.1 | 0.5 | GO:0015277 | kainate selective glutamate receptor activity(GO:0015277) |
| 0.1 | 16.5 | GO:0051015 | actin filament binding(GO:0051015) |
| 0.1 | 3.9 | GO:0035255 | ionotropic glutamate receptor binding(GO:0035255) |
| 0.1 | 1.5 | GO:0043325 | phosphatidylinositol-3,4-bisphosphate binding(GO:0043325) |
| 0.1 | 7.2 | GO:0030165 | PDZ domain binding(GO:0030165) |
| 0.1 | 0.6 | GO:0034713 | type I transforming growth factor beta receptor binding(GO:0034713) |
| 0.1 | 1.6 | GO:0019706 | protein-cysteine S-palmitoyltransferase activity(GO:0019706) |
| 0.0 | 0.2 | GO:0004839 | ubiquitin activating enzyme activity(GO:0004839) |
| 0.0 | 1.1 | GO:0031491 | nucleosome binding(GO:0031491) |
| 0.0 | 1.5 | GO:0001104 | RNA polymerase II transcription cofactor activity(GO:0001104) |
| 0.0 | 2.3 | GO:0048365 | Rac GTPase binding(GO:0048365) |
| 0.0 | 0.8 | GO:0050253 | prenylcysteine methylesterase activity(GO:0010296) 1-oxa-2-oxocycloheptane lactonase activity(GO:0018731) sulfolactone hydrolase activity(GO:0018732) butyrolactone hydrolase activity(GO:0018734) endosulfan lactone lactonase activity(GO:0034892) L-ascorbate 6-phosphate lactonase activity(GO:0035460) Ser-tRNA(Thr) hydrolase activity(GO:0043905) Ala-tRNA(Pro) hydrolase activity(GO:0043906) Cys-tRNA(Pro) hydrolase activity(GO:0043907) Ser(Gly)-tRNA(Ala) hydrolase activity(GO:0043908) all-trans-retinyl-palmitate hydrolase, all-trans-retinol forming activity(GO:0047376) retinyl-palmitate esterase activity(GO:0050253) mannosyl-oligosaccharide 1,6-alpha-mannosidase activity(GO:0052767) mannosyl-oligosaccharide 1,3-alpha-mannosidase activity(GO:0052768) methyl indole-3-acetate esterase activity(GO:0080030) methyl salicylate esterase activity(GO:0080031) methyl jasmonate esterase activity(GO:0080032) |
| 0.0 | 2.6 | GO:0051287 | NAD binding(GO:0051287) |
| 0.0 | 4.3 | GO:0015293 | symporter activity(GO:0015293) |
| 0.0 | 2.0 | GO:0001047 | core promoter binding(GO:0001047) |
| 0.0 | 8.4 | GO:0003735 | structural constituent of ribosome(GO:0003735) |
| 0.0 | 2.7 | GO:0001227 | transcriptional repressor activity, RNA polymerase II transcription regulatory region sequence-specific binding(GO:0001227) |
| 0.0 | 0.4 | GO:0016863 | intramolecular oxidoreductase activity, transposing C=C bonds(GO:0016863) |
| 0.0 | 1.0 | GO:0016860 | intramolecular oxidoreductase activity(GO:0016860) |
| 0.0 | 2.3 | GO:0042393 | histone binding(GO:0042393) |
| 0.0 | 0.6 | GO:0050136 | NADH dehydrogenase (ubiquinone) activity(GO:0008137) NADH dehydrogenase (quinone) activity(GO:0050136) |
| 0.0 | 0.7 | GO:0016811 | hydrolase activity, acting on carbon-nitrogen (but not peptide) bonds, in linear amides(GO:0016811) |
| 0.0 | 5.1 | GO:0031625 | ubiquitin protein ligase binding(GO:0031625) |
| 0.0 | 0.4 | GO:0015036 | disulfide oxidoreductase activity(GO:0015036) |
| 0.0 | 1.2 | GO:0003743 | translation initiation factor activity(GO:0003743) |
| 0.0 | 1.6 | GO:0019210 | protein kinase inhibitor activity(GO:0004860) kinase inhibitor activity(GO:0019210) |
| 0.0 | 1.4 | GO:0015020 | glucuronosyltransferase activity(GO:0015020) |
| 0.0 | 1.4 | GO:0003697 | single-stranded DNA binding(GO:0003697) |
| 0.0 | 1.1 | GO:0031593 | polyubiquitin binding(GO:0031593) |
| 0.0 | 0.5 | GO:0001077 | transcriptional activator activity, RNA polymerase II core promoter proximal region sequence-specific binding(GO:0001077) |
| 0.0 | 0.4 | GO:0034945 | dihydrolipoamide branched chain acyltransferase activity(GO:0004147) palmitoleoyl [acyl-carrier-protein]-dependent acyltransferase activity(GO:0008951) serine O-acyltransferase activity(GO:0016412) O-succinyltransferase activity(GO:0016750) sinapoyltransferase activity(GO:0016752) O-sinapoyltransferase activity(GO:0016753) peptidyl-lysine N6-myristoyltransferase activity(GO:0018030) peptidyl-lysine N6-palmitoyltransferase activity(GO:0018031) benzoyl acetate-CoA thiolase activity(GO:0018711) 3-hydroxybutyryl-CoA thiolase activity(GO:0018712) 3-ketopimelyl-CoA thiolase activity(GO:0018713) N-palmitoyltransferase activity(GO:0019105) acyl-CoA N-acyltransferase activity(GO:0019186) protein-cysteine S-myristoyltransferase activity(GO:0019705) glucosaminyl-phosphotidylinositol O-acyltransferase activity(GO:0032216) ergosterol O-acyltransferase activity(GO:0034737) lanosterol O-acyltransferase activity(GO:0034738) naphthyl-2-oxomethyl-succinyl-CoA succinyl transferase activity(GO:0034848) 2,4,4-trimethyl-3-oxopentanoyl-CoA 2-C-propanoyl transferase activity(GO:0034851) 2-methylhexanoyl-CoA C-acetyltransferase activity(GO:0034915) butyryl-CoA 2-C-propionyltransferase activity(GO:0034919) 2,6-dimethyl-5-methylene-3-oxo-heptanoyl-CoA C-acetyltransferase activity(GO:0034945) L-2-aminoadipate N-acetyltransferase activity(GO:0043741) keto acid formate lyase activity(GO:0043806) Ras palmitoyltransferase activity(GO:0043849) azetidine-2-carboxylic acid acetyltransferase activity(GO:0046941) peptidyl-lysine N-acetyltransferase activity, acting on acetyl phosphate as donor(GO:0052858) acetyl-CoA:L-lysine N6-acetyltransferase(GO:0090595) |
| 0.0 | 0.2 | GO:0017048 | Rho GTPase binding(GO:0017048) |
|
|
|
|