| 5.5 |
21.8 |
GO:0071449 |
cellular response to lipid hydroperoxide(GO:0071449) |
| 5.3 |
15.8 |
GO:0097402 |
neuroblast migration(GO:0097402) |
| 4.7 |
14.1 |
GO:0035790 |
platelet-derived growth factor receptor-alpha signaling pathway(GO:0035790) |
| 4.4 |
13.1 |
GO:0021759 |
globus pallidus development(GO:0021759) |
| 3.8 |
3.8 |
GO:0070366 |
regulation of hepatocyte differentiation(GO:0070366) |
| 3.8 |
7.6 |
GO:0014016 |
neuroblast differentiation(GO:0014016) |
| 3.5 |
27.6 |
GO:0048625 |
myoblast fate commitment(GO:0048625) |
| 3.4 |
13.7 |
GO:0043490 |
malate-aspartate shuttle(GO:0043490) |
| 3.4 |
16.9 |
GO:0015671 |
oxygen transport(GO:0015671) |
| 3.1 |
9.4 |
GO:0070634 |
transepithelial ammonium transport(GO:0070634) |
| 3.0 |
9.0 |
GO:0060244 |
negative regulation of cell proliferation involved in contact inhibition(GO:0060244) |
| 2.9 |
8.6 |
GO:0043988 |
histone H3-S28 phosphorylation(GO:0043988) |
| 2.8 |
8.4 |
GO:0090425 |
hepatocyte cell migration(GO:0002194) branching involved in pancreas morphogenesis(GO:0061114) acinar cell differentiation(GO:0090425) positive regulation of forebrain neuron differentiation(GO:2000979) |
| 2.7 |
2.7 |
GO:1990086 |
lens fiber cell apoptotic process(GO:1990086) |
| 2.7 |
10.9 |
GO:0060032 |
notochord regression(GO:0060032) |
| 2.7 |
8.0 |
GO:0006566 |
threonine metabolic process(GO:0006566) |
| 2.7 |
8.0 |
GO:0010986 |
positive regulation of lipoprotein particle clearance(GO:0010986) |
| 2.6 |
2.6 |
GO:0045404 |
positive regulation of interleukin-4 biosynthetic process(GO:0045404) |
| 2.6 |
10.6 |
GO:0046552 |
eye photoreceptor cell fate commitment(GO:0042706) photoreceptor cell fate commitment(GO:0046552) |
| 2.6 |
2.6 |
GO:0072103 |
glomerulus vasculature morphogenesis(GO:0072103) glomerular capillary formation(GO:0072104) |
| 2.6 |
12.8 |
GO:0034441 |
plasma lipoprotein particle oxidation(GO:0034441) |
| 2.4 |
2.4 |
GO:0072204 |
cell-cell signaling involved in kidney development(GO:0060995) Wnt signaling pathway involved in kidney development(GO:0061289) canonical Wnt signaling pathway involved in metanephric kidney development(GO:0061290) cell-cell signaling involved in metanephros development(GO:0072204) |
| 2.4 |
7.1 |
GO:0035910 |
ascending aorta development(GO:0035905) ascending aorta morphogenesis(GO:0035910) |
| 2.2 |
8.9 |
GO:0047484 |
regulation of response to osmotic stress(GO:0047484) |
| 2.2 |
26.2 |
GO:0044458 |
motile cilium assembly(GO:0044458) |
| 2.2 |
13.0 |
GO:0032488 |
Cdc42 protein signal transduction(GO:0032488) |
| 2.1 |
10.7 |
GO:0021914 |
negative regulation of smoothened signaling pathway involved in ventral spinal cord patterning(GO:0021914) |
| 2.1 |
6.3 |
GO:0045349 |
interferon-alpha biosynthetic process(GO:0045349) regulation of interferon-alpha biosynthetic process(GO:0045354) |
| 2.0 |
22.0 |
GO:0061032 |
visceral serous pericardium development(GO:0061032) |
| 2.0 |
7.9 |
GO:0070318 |
positive regulation of G0 to G1 transition(GO:0070318) |
| 2.0 |
7.9 |
GO:1902990 |
mitotic telomere maintenance via semi-conservative replication(GO:1902990) |
| 1.9 |
1.9 |
GO:0072602 |
interleukin-4 secretion(GO:0072602) |
| 1.9 |
7.6 |
GO:0032901 |
positive regulation of neurotrophin production(GO:0032901) |
| 1.9 |
7.5 |
GO:0046121 |
deoxyribonucleoside catabolic process(GO:0046121) |
| 1.9 |
3.7 |
GO:0060242 |
contact inhibition(GO:0060242) |
| 1.9 |
3.7 |
GO:0021529 |
spinal cord oligodendrocyte cell differentiation(GO:0021529) spinal cord oligodendrocyte cell fate specification(GO:0021530) |
| 1.9 |
5.6 |
GO:0009177 |
deoxyribonucleoside monophosphate biosynthetic process(GO:0009157) pyrimidine deoxyribonucleoside monophosphate biosynthetic process(GO:0009177) |
| 1.9 |
11.1 |
GO:1902998 |
macrophage proliferation(GO:0061517) microglial cell proliferation(GO:0061518) regulation of neuronal signal transduction(GO:1902847) positive regulation of tau-protein kinase activity(GO:1902949) positive regulation of neurofibrillary tangle assembly(GO:1902998) |
| 1.8 |
11.0 |
GO:0051987 |
positive regulation of attachment of spindle microtubules to kinetochore(GO:0051987) |
| 1.8 |
3.6 |
GO:0021938 |
smoothened signaling pathway involved in regulation of cerebellar granule cell precursor cell proliferation(GO:0021938) |
| 1.8 |
5.4 |
GO:0030421 |
defecation(GO:0030421) |
| 1.8 |
8.9 |
GO:0006287 |
base-excision repair, gap-filling(GO:0006287) |
| 1.8 |
16.0 |
GO:1900169 |
regulation of glucocorticoid mediated signaling pathway(GO:1900169) |
| 1.7 |
5.2 |
GO:0032650 |
regulation of interleukin-1 alpha production(GO:0032650) positive regulation of interleukin-1 alpha production(GO:0032730) interleukin-1 alpha secretion(GO:0050703) |
| 1.7 |
6.9 |
GO:0021698 |
cerebellar cortex structural organization(GO:0021698) |
| 1.7 |
5.2 |
GO:1903225 |
negative regulation of endodermal cell differentiation(GO:1903225) |
| 1.7 |
6.9 |
GO:0035878 |
nail development(GO:0035878) |
| 1.7 |
5.1 |
GO:0036292 |
DNA rewinding(GO:0036292) |
| 1.7 |
5.0 |
GO:0045819 |
positive regulation of glycogen catabolic process(GO:0045819) |
| 1.7 |
8.3 |
GO:0072015 |
glomerular visceral epithelial cell development(GO:0072015) glomerular epithelial cell development(GO:0072310) |
| 1.6 |
6.5 |
GO:0002339 |
B cell selection(GO:0002339) |
| 1.6 |
8.1 |
GO:0021553 |
olfactory nerve development(GO:0021553) |
| 1.6 |
3.2 |
GO:1990705 |
cholangiocyte proliferation(GO:1990705) |
| 1.6 |
4.8 |
GO:0045938 |
positive regulation of circadian sleep/wake cycle, sleep(GO:0045938) |
| 1.6 |
4.8 |
GO:2000040 |
regulation of planar cell polarity pathway involved in axis elongation(GO:2000040) negative regulation of planar cell polarity pathway involved in axis elongation(GO:2000041) |
| 1.6 |
3.1 |
GO:0048143 |
astrocyte activation(GO:0048143) |
| 1.5 |
4.6 |
GO:0006553 |
lysine metabolic process(GO:0006553) |
| 1.5 |
9.1 |
GO:0010528 |
regulation of transposition(GO:0010528) negative regulation of transposition(GO:0010529) |
| 1.5 |
18.2 |
GO:0051988 |
regulation of attachment of spindle microtubules to kinetochore(GO:0051988) |
| 1.5 |
15.2 |
GO:0015721 |
bile acid and bile salt transport(GO:0015721) |
| 1.5 |
12.0 |
GO:0033314 |
mitotic DNA replication checkpoint(GO:0033314) |
| 1.5 |
7.5 |
GO:0036151 |
phosphatidylcholine acyl-chain remodeling(GO:0036151) |
| 1.5 |
2.9 |
GO:0045909 |
regulation of vasodilation(GO:0042312) positive regulation of vasodilation(GO:0045909) |
| 1.5 |
5.8 |
GO:0014834 |
skeletal muscle satellite cell maintenance involved in skeletal muscle regeneration(GO:0014834) |
| 1.5 |
7.3 |
GO:0030951 |
establishment or maintenance of microtubule cytoskeleton polarity(GO:0030951) |
| 1.4 |
5.7 |
GO:0090324 |
negative regulation of oxidative phosphorylation(GO:0090324) |
| 1.4 |
21.5 |
GO:0038065 |
collagen-activated signaling pathway(GO:0038065) |
| 1.4 |
7.2 |
GO:0046601 |
positive regulation of centriole replication(GO:0046601) |
| 1.4 |
4.3 |
GO:0021893 |
cerebral cortex GABAergic interneuron fate commitment(GO:0021893) |
| 1.4 |
4.3 |
GO:0051933 |
amino acid neurotransmitter reuptake(GO:0051933) glutamate reuptake(GO:0051935) |
| 1.4 |
9.9 |
GO:0001887 |
selenium compound metabolic process(GO:0001887) |
| 1.4 |
5.6 |
GO:0014846 |
esophagus smooth muscle contraction(GO:0014846) |
| 1.4 |
5.6 |
GO:0033088 |
negative regulation of immature T cell proliferation in thymus(GO:0033088) |
| 1.4 |
13.9 |
GO:2001214 |
positive regulation of vasculogenesis(GO:2001214) |
| 1.4 |
4.2 |
GO:0036388 |
pre-replicative complex assembly involved in nuclear cell cycle DNA replication(GO:0006267) pre-replicative complex assembly(GO:0036388) pre-replicative complex assembly involved in cell cycle DNA replication(GO:1902299) |
| 1.4 |
6.9 |
GO:0033029 |
regulation of neutrophil apoptotic process(GO:0033029) |
| 1.4 |
6.9 |
GO:0048133 |
germ-line stem cell division(GO:0042078) male germ-line stem cell asymmetric division(GO:0048133) germline stem cell asymmetric division(GO:0098728) |
| 1.4 |
4.1 |
GO:0001869 |
regulation of complement activation, lectin pathway(GO:0001868) negative regulation of complement activation, lectin pathway(GO:0001869) |
| 1.4 |
6.9 |
GO:0051045 |
negative regulation of membrane protein ectodomain proteolysis(GO:0051045) |
| 1.4 |
9.6 |
GO:0006590 |
thyroid hormone generation(GO:0006590) |
| 1.4 |
4.1 |
GO:0048698 |
negative regulation of collateral sprouting in absence of injury(GO:0048698) |
| 1.4 |
4.1 |
GO:0060282 |
positive regulation of oocyte development(GO:0060282) |
| 1.4 |
5.4 |
GO:1904565 |
response to 1-oleoyl-sn-glycerol 3-phosphate(GO:1904565) cellular response to 1-oleoyl-sn-glycerol 3-phosphate(GO:1904566) |
| 1.3 |
1.3 |
GO:0021593 |
rhombomere morphogenesis(GO:0021593) |
| 1.3 |
6.7 |
GO:0034421 |
post-translational protein acetylation(GO:0034421) |
| 1.3 |
4.0 |
GO:0032918 |
polyamine acetylation(GO:0032917) spermidine acetylation(GO:0032918) |
| 1.3 |
10.5 |
GO:0014816 |
skeletal muscle satellite cell differentiation(GO:0014816) |
| 1.3 |
3.9 |
GO:0006601 |
creatine biosynthetic process(GO:0006601) |
| 1.3 |
11.7 |
GO:0021780 |
oligodendrocyte cell fate specification(GO:0021778) oligodendrocyte cell fate commitment(GO:0021779) glial cell fate specification(GO:0021780) |
| 1.3 |
1.3 |
GO:0045617 |
negative regulation of keratinocyte differentiation(GO:0045617) |
| 1.3 |
3.8 |
GO:2000393 |
negative regulation of lamellipodium morphogenesis(GO:2000393) |
| 1.3 |
3.8 |
GO:0038203 |
TORC2 signaling(GO:0038203) |
| 1.3 |
16.4 |
GO:0007076 |
mitotic chromosome condensation(GO:0007076) |
| 1.3 |
8.8 |
GO:0016127 |
cholesterol catabolic process(GO:0006707) sterol catabolic process(GO:0016127) |
| 1.3 |
3.8 |
GO:0046061 |
dATP catabolic process(GO:0046061) |
| 1.2 |
1.2 |
GO:0046544 |
development of secondary male sexual characteristics(GO:0046544) |
| 1.2 |
8.7 |
GO:0048702 |
embryonic neurocranium morphogenesis(GO:0048702) |
| 1.2 |
6.2 |
GO:0051387 |
negative regulation of neurotrophin TRK receptor signaling pathway(GO:0051387) |
| 1.2 |
3.7 |
GO:0015938 |
coenzyme A catabolic process(GO:0015938) nucleoside bisphosphate catabolic process(GO:0033869) ribonucleoside bisphosphate catabolic process(GO:0034031) purine nucleoside bisphosphate catabolic process(GO:0034034) |
| 1.2 |
3.7 |
GO:0006546 |
glycine catabolic process(GO:0006546) glycine decarboxylation via glycine cleavage system(GO:0019464) |
| 1.2 |
4.9 |
GO:0042360 |
vitamin E metabolic process(GO:0042360) |
| 1.2 |
1.2 |
GO:1903351 |
response to dopamine(GO:1903350) cellular response to dopamine(GO:1903351) |
| 1.2 |
6.1 |
GO:1904690 |
regulation of cap-independent translational initiation(GO:1903677) positive regulation of cap-independent translational initiation(GO:1903679) regulation of cytoplasmic translational initiation(GO:1904688) positive regulation of cytoplasmic translational initiation(GO:1904690) |
| 1.2 |
8.5 |
GO:2000051 |
negative regulation of non-canonical Wnt signaling pathway(GO:2000051) |
| 1.2 |
2.4 |
GO:0060523 |
prostate epithelial cord elongation(GO:0060523) |
| 1.2 |
3.6 |
GO:0006065 |
UDP-glucuronate biosynthetic process(GO:0006065) |
| 1.2 |
19.2 |
GO:0048387 |
negative regulation of retinoic acid receptor signaling pathway(GO:0048387) |
| 1.2 |
11.8 |
GO:0060710 |
chorio-allantoic fusion(GO:0060710) |
| 1.2 |
17.5 |
GO:0008608 |
attachment of spindle microtubules to kinetochore(GO:0008608) |
| 1.2 |
11.6 |
GO:0060501 |
positive regulation of epithelial cell proliferation involved in lung morphogenesis(GO:0060501) |
| 1.2 |
4.7 |
GO:0033580 |
protein glycosylation at cell surface(GO:0033575) protein galactosylation at cell surface(GO:0033580) protein galactosylation(GO:0042125) |
| 1.2 |
7.0 |
GO:0031145 |
anaphase-promoting complex-dependent catabolic process(GO:0031145) |
| 1.1 |
4.6 |
GO:0036518 |
chemorepulsion of dopaminergic neuron axon(GO:0036518) |
| 1.1 |
4.5 |
GO:0014012 |
peripheral nervous system axon regeneration(GO:0014012) |
| 1.1 |
1.1 |
GO:0072106 |
regulation of branch elongation involved in ureteric bud branching(GO:0072095) regulation of ureteric bud formation(GO:0072106) positive regulation of ureteric bud formation(GO:0072107) mesenchymal cell proliferation involved in ureter development(GO:0072198) regulation of mesenchymal cell proliferation involved in ureter development(GO:0072199) |
| 1.1 |
4.4 |
GO:0002337 |
B-1a B cell differentiation(GO:0002337) |
| 1.1 |
5.5 |
GO:2000298 |
regulation of Rho-dependent protein serine/threonine kinase activity(GO:2000298) |
| 1.1 |
3.3 |
GO:0035519 |
protein K29-linked ubiquitination(GO:0035519) |
| 1.1 |
3.3 |
GO:2000569 |
T-helper 2 cell activation(GO:0035712) positive regulation of T-helper 17 type immune response(GO:2000318) regulation of T-helper 2 cell activation(GO:2000569) positive regulation of T-helper 2 cell activation(GO:2000570) |
| 1.1 |
5.3 |
GO:0034080 |
CENP-A containing nucleosome assembly(GO:0034080) CENP-A containing chromatin organization(GO:0061641) |
| 1.1 |
3.2 |
GO:0006285 |
base-excision repair, AP site formation(GO:0006285) |
| 1.1 |
9.6 |
GO:0006183 |
GTP biosynthetic process(GO:0006183) |
| 1.1 |
3.2 |
GO:1903795 |
regulation of inorganic anion transmembrane transport(GO:1903795) |
| 1.1 |
8.4 |
GO:0048664 |
neuron fate determination(GO:0048664) |
| 1.0 |
2.1 |
GO:0021797 |
forebrain anterior/posterior pattern specification(GO:0021797) |
| 1.0 |
3.1 |
GO:0006059 |
hexitol metabolic process(GO:0006059) |
| 1.0 |
4.1 |
GO:1903251 |
multi-ciliated epithelial cell differentiation(GO:1903251) |
| 1.0 |
3.1 |
GO:0006578 |
amino-acid betaine biosynthetic process(GO:0006578) |
| 1.0 |
3.1 |
GO:0032877 |
positive regulation of DNA endoreduplication(GO:0032877) |
| 1.0 |
3.1 |
GO:0090258 |
negative regulation of mitochondrial fission(GO:0090258) |
| 1.0 |
3.0 |
GO:0001951 |
intestinal D-glucose absorption(GO:0001951) terminal web assembly(GO:1902896) |
| 1.0 |
3.0 |
GO:0006269 |
DNA replication, synthesis of RNA primer(GO:0006269) |
| 1.0 |
3.0 |
GO:0048352 |
neural plate mediolateral regionalization(GO:0021998) mesoderm structural organization(GO:0048338) paraxial mesoderm structural organization(GO:0048352) |
| 1.0 |
3.0 |
GO:0006931 |
substrate-dependent cell migration, cell attachment to substrate(GO:0006931) |
| 1.0 |
3.0 |
GO:0000087 |
mitotic M phase(GO:0000087) |
| 1.0 |
6.0 |
GO:0003433 |
chondrocyte development involved in endochondral bone morphogenesis(GO:0003433) |
| 1.0 |
5.0 |
GO:2001170 |
negative regulation of ATP biosynthetic process(GO:2001170) |
| 1.0 |
5.0 |
GO:0070345 |
negative regulation of fat cell proliferation(GO:0070345) |
| 1.0 |
3.0 |
GO:0019343 |
cysteine biosynthetic process via cystathionine(GO:0019343) cysteine biosynthetic process(GO:0019344) |
| 1.0 |
1.0 |
GO:2000048 |
negative regulation of cell-cell adhesion mediated by cadherin(GO:2000048) |
| 1.0 |
2.9 |
GO:0014826 |
vein smooth muscle contraction(GO:0014826) |
| 1.0 |
2.9 |
GO:0034035 |
purine ribonucleoside bisphosphate metabolic process(GO:0034035) |
| 1.0 |
2.9 |
GO:0052428 |
modulation of molecular function in other organism(GO:0044359) negative regulation of molecular function in other organism(GO:0044362) negative regulation of molecular function in other organism involved in symbiotic interaction(GO:0052204) modulation of molecular function in other organism involved in symbiotic interaction(GO:0052205) negative regulation by host of symbiont molecular function(GO:0052405) modification by host of symbiont molecular function(GO:0052428) |
| 1.0 |
3.8 |
GO:1900147 |
Schwann cell migration(GO:0036135) regulation of Schwann cell migration(GO:1900147) |
| 0.9 |
10.4 |
GO:0051307 |
meiotic chromosome separation(GO:0051307) |
| 0.9 |
2.8 |
GO:0007084 |
mitotic nuclear envelope reassembly(GO:0007084) |
| 0.9 |
3.7 |
GO:0090244 |
Wnt signaling pathway involved in somitogenesis(GO:0090244) |
| 0.9 |
6.5 |
GO:0085020 |
protein K6-linked ubiquitination(GO:0085020) |
| 0.9 |
4.6 |
GO:0072513 |
positive regulation of secondary heart field cardioblast proliferation(GO:0072513) |
| 0.9 |
2.8 |
GO:1904706 |
negative regulation of vascular smooth muscle cell proliferation(GO:1904706) |
| 0.9 |
2.8 |
GO:0060923 |
cardiac muscle cell fate commitment(GO:0060923) |
| 0.9 |
2.7 |
GO:1903232 |
melanosome assembly(GO:1903232) |
| 0.9 |
1.8 |
GO:0006573 |
valine metabolic process(GO:0006573) |
| 0.9 |
2.7 |
GO:2000054 |
regulation of Wnt signaling pathway involved in dorsal/ventral axis specification(GO:2000053) negative regulation of Wnt signaling pathway involved in dorsal/ventral axis specification(GO:2000054) |
| 0.9 |
3.6 |
GO:2000042 |
negative regulation of double-strand break repair via homologous recombination(GO:2000042) |
| 0.9 |
2.7 |
GO:0070269 |
pyroptosis(GO:0070269) |
| 0.9 |
2.7 |
GO:0033566 |
gamma-tubulin complex localization(GO:0033566) |
| 0.9 |
7.1 |
GO:0044351 |
macropinocytosis(GO:0044351) |
| 0.9 |
6.2 |
GO:2000348 |
regulation of CD40 signaling pathway(GO:2000348) |
| 0.9 |
1.8 |
GO:0006011 |
UDP-glucose metabolic process(GO:0006011) |
| 0.9 |
9.6 |
GO:0071578 |
zinc II ion transmembrane import(GO:0071578) |
| 0.9 |
0.9 |
GO:0098763 |
mitotic cell cycle phase(GO:0098763) |
| 0.9 |
1.7 |
GO:0002765 |
immune response-inhibiting signal transduction(GO:0002765) |
| 0.8 |
0.8 |
GO:0035989 |
tendon development(GO:0035989) |
| 0.8 |
0.8 |
GO:0042660 |
positive regulation of cell fate specification(GO:0042660) |
| 0.8 |
2.5 |
GO:0061743 |
motor learning(GO:0061743) |
| 0.8 |
0.8 |
GO:1901856 |
negative regulation of cellular respiration(GO:1901856) |
| 0.8 |
0.8 |
GO:0007352 |
zygotic specification of dorsal/ventral axis(GO:0007352) |
| 0.8 |
3.4 |
GO:0021847 |
ventricular zone neuroblast division(GO:0021847) |
| 0.8 |
2.5 |
GO:0072139 |
glomerular parietal epithelial cell differentiation(GO:0072139) |
| 0.8 |
0.8 |
GO:0032687 |
negative regulation of interferon-alpha production(GO:0032687) |
| 0.8 |
4.2 |
GO:0046602 |
regulation of mitotic centrosome separation(GO:0046602) |
| 0.8 |
5.8 |
GO:0000920 |
cell separation after cytokinesis(GO:0000920) |
| 0.8 |
2.5 |
GO:0070278 |
extracellular matrix constituent secretion(GO:0070278) |
| 0.8 |
1.6 |
GO:0021913 |
regulation of transcription from RNA polymerase II promoter involved in spinal cord motor neuron fate specification(GO:0021912) regulation of transcription from RNA polymerase II promoter involved in ventral spinal cord interneuron specification(GO:0021913) |
| 0.8 |
4.9 |
GO:0032264 |
IMP salvage(GO:0032264) |
| 0.8 |
5.7 |
GO:0032534 |
regulation of microvillus assembly(GO:0032534) |
| 0.8 |
8.0 |
GO:0009404 |
toxin metabolic process(GO:0009404) |
| 0.8 |
6.4 |
GO:0032876 |
negative regulation of DNA endoreduplication(GO:0032876) |
| 0.8 |
1.6 |
GO:0060364 |
frontal suture morphogenesis(GO:0060364) |
| 0.8 |
1.6 |
GO:2001046 |
regulation of integrin-mediated signaling pathway(GO:2001044) positive regulation of integrin-mediated signaling pathway(GO:2001046) |
| 0.8 |
3.2 |
GO:0090086 |
negative regulation of protein deubiquitination(GO:0090086) |
| 0.8 |
1.6 |
GO:0060762 |
regulation of branching involved in mammary gland duct morphogenesis(GO:0060762) |
| 0.8 |
7.1 |
GO:0097070 |
ductus arteriosus closure(GO:0097070) |
| 0.8 |
2.4 |
GO:0001978 |
regulation of systemic arterial blood pressure by carotid sinus baroreceptor feedback(GO:0001978) |
| 0.8 |
4.7 |
GO:0002553 |
histamine production involved in inflammatory response(GO:0002349) histamine secretion involved in inflammatory response(GO:0002441) histamine secretion by mast cell(GO:0002553) |
| 0.8 |
2.4 |
GO:0016598 |
protein arginylation(GO:0016598) |
| 0.8 |
3.9 |
GO:0019254 |
carnitine metabolic process, CoA-linked(GO:0019254) |
| 0.8 |
21.0 |
GO:0030212 |
hyaluronan metabolic process(GO:0030212) |
| 0.8 |
3.1 |
GO:0006842 |
tricarboxylic acid transport(GO:0006842) succinate transport(GO:0015744) citrate transport(GO:0015746) |
| 0.8 |
7.0 |
GO:0042136 |
neurotransmitter biosynthetic process(GO:0042136) |
| 0.8 |
2.3 |
GO:0046469 |
platelet activating factor biosynthetic process(GO:0006663) platelet activating factor metabolic process(GO:0046469) |
| 0.8 |
2.3 |
GO:0072257 |
metanephric nephron tubule epithelial cell differentiation(GO:0072257) regulation of metanephric nephron tubule epithelial cell differentiation(GO:0072307) |
| 0.8 |
3.1 |
GO:0001550 |
ovarian cumulus expansion(GO:0001550) fused antrum stage(GO:0048165) |
| 0.8 |
2.3 |
GO:0097461 |
ferric iron import(GO:0033216) ferric iron import into cell(GO:0097461) |
| 0.8 |
2.3 |
GO:0015889 |
cobalamin transport(GO:0015889) |
| 0.8 |
3.1 |
GO:0071475 |
cellular hyperosmotic salinity response(GO:0071475) |
| 0.8 |
6.9 |
GO:0031274 |
positive regulation of pseudopodium assembly(GO:0031274) |
| 0.8 |
5.3 |
GO:0010273 |
detoxification of copper ion(GO:0010273) detoxification of inorganic compound(GO:0061687) stress response to copper ion(GO:1990169) |
| 0.8 |
1.5 |
GO:0055099 |
response to high density lipoprotein particle(GO:0055099) |
| 0.8 |
2.3 |
GO:1903519 |
negative regulation of interleukin-1 beta secretion(GO:0050713) apoptotic process involved in mammary gland involution(GO:0060057) positive regulation of apoptotic process involved in mammary gland involution(GO:0060058) positive regulation of apoptotic process involved in morphogenesis(GO:1902339) regulation of mammary gland involution(GO:1903519) positive regulation of mammary gland involution(GO:1903521) positive regulation of apoptotic process involved in development(GO:1904747) |
| 0.8 |
2.3 |
GO:0031120 |
snRNA pseudouridine synthesis(GO:0031120) |
| 0.8 |
3.0 |
GO:2000483 |
negative regulation of interleukin-8 secretion(GO:2000483) |
| 0.8 |
6.1 |
GO:0009143 |
nucleoside triphosphate catabolic process(GO:0009143) |
| 0.8 |
3.8 |
GO:0000022 |
mitotic spindle elongation(GO:0000022) mitotic spindle midzone assembly(GO:0051256) |
| 0.8 |
6.8 |
GO:0045719 |
negative regulation of glycogen biosynthetic process(GO:0045719) negative regulation of glycogen metabolic process(GO:0070874) |
| 0.7 |
6.0 |
GO:0048386 |
positive regulation of retinoic acid receptor signaling pathway(GO:0048386) |
| 0.7 |
2.2 |
GO:0070103 |
regulation of interleukin-6-mediated signaling pathway(GO:0070103) negative regulation of interleukin-6-mediated signaling pathway(GO:0070104) |
| 0.7 |
2.2 |
GO:0046084 |
adenine metabolic process(GO:0046083) adenine biosynthetic process(GO:0046084) |
| 0.7 |
7.9 |
GO:0048733 |
sebaceous gland development(GO:0048733) |
| 0.7 |
5.7 |
GO:0050957 |
equilibrioception(GO:0050957) |
| 0.7 |
5.7 |
GO:0006012 |
galactose metabolic process(GO:0006012) |
| 0.7 |
2.1 |
GO:0032836 |
glomerular basement membrane development(GO:0032836) |
| 0.7 |
4.9 |
GO:0032596 |
protein transport into membrane raft(GO:0032596) |
| 0.7 |
1.4 |
GO:0003104 |
positive regulation of glomerular filtration(GO:0003104) |
| 0.7 |
2.8 |
GO:0042167 |
heme catabolic process(GO:0042167) pigment catabolic process(GO:0046149) |
| 0.7 |
1.4 |
GO:0043366 |
beta selection(GO:0043366) |
| 0.7 |
2.8 |
GO:1903026 |
negative regulation of RNA polymerase II regulatory region sequence-specific DNA binding(GO:1903026) |
| 0.7 |
7.6 |
GO:0007221 |
positive regulation of transcription of Notch receptor target(GO:0007221) |
| 0.7 |
2.8 |
GO:2000757 |
negative regulation of peptidyl-lysine acetylation(GO:2000757) |
| 0.7 |
3.4 |
GO:0042640 |
anagen(GO:0042640) |
| 0.7 |
3.4 |
GO:0019249 |
lactate biosynthetic process from pyruvate(GO:0019244) lactate biosynthetic process(GO:0019249) |
| 0.7 |
7.5 |
GO:0032291 |
central nervous system myelination(GO:0022010) axon ensheathment in central nervous system(GO:0032291) |
| 0.7 |
1.4 |
GO:2001137 |
positive regulation of endocytic recycling(GO:2001137) |
| 0.7 |
5.4 |
GO:0010815 |
bradykinin catabolic process(GO:0010815) |
| 0.7 |
1.4 |
GO:0006545 |
glycine biosynthetic process(GO:0006545) |
| 0.7 |
2.0 |
GO:0043456 |
regulation of pentose-phosphate shunt(GO:0043456) |
| 0.7 |
1.4 |
GO:0014738 |
regulation of muscle hyperplasia(GO:0014738) muscle hyperplasia(GO:0014900) |
| 0.7 |
1.4 |
GO:0060029 |
convergent extension involved in organogenesis(GO:0060029) |
| 0.7 |
2.7 |
GO:1903288 |
regulation of potassium ion import(GO:1903286) positive regulation of potassium ion import(GO:1903288) |
| 0.7 |
6.7 |
GO:0032367 |
intracellular cholesterol transport(GO:0032367) |
| 0.7 |
3.4 |
GO:0072526 |
pyridine-containing compound catabolic process(GO:0072526) |
| 0.7 |
2.7 |
GO:0036462 |
TRAIL-activated apoptotic signaling pathway(GO:0036462) |
| 0.7 |
3.3 |
GO:0019230 |
proprioception(GO:0019230) |
| 0.7 |
2.0 |
GO:0003245 |
cardiac muscle tissue growth involved in heart morphogenesis(GO:0003245) |
| 0.7 |
5.3 |
GO:0060056 |
mammary gland involution(GO:0060056) |
| 0.7 |
0.7 |
GO:0033087 |
negative regulation of immature T cell proliferation(GO:0033087) |
| 0.7 |
19.3 |
GO:0006270 |
DNA replication initiation(GO:0006270) |
| 0.7 |
3.3 |
GO:2000258 |
negative regulation of complement activation(GO:0045916) negative regulation of protein activation cascade(GO:2000258) |
| 0.7 |
2.0 |
GO:0048496 |
maintenance of organ identity(GO:0048496) |
| 0.7 |
2.0 |
GO:1904996 |
positive regulation of leukocyte adhesion to vascular endothelial cell(GO:1904996) |
| 0.7 |
0.7 |
GO:0072070 |
loop of Henle development(GO:0072070) metanephric loop of Henle development(GO:0072236) |
| 0.7 |
14.4 |
GO:0001913 |
T cell mediated cytotoxicity(GO:0001913) |
| 0.7 |
3.3 |
GO:0035331 |
negative regulation of hippo signaling(GO:0035331) |
| 0.6 |
1.3 |
GO:0051004 |
regulation of lipoprotein lipase activity(GO:0051004) |
| 0.6 |
1.9 |
GO:0035106 |
operant conditioning(GO:0035106) |
| 0.6 |
4.5 |
GO:1904667 |
negative regulation of ubiquitin protein ligase activity(GO:1904667) |
| 0.6 |
9.0 |
GO:0048642 |
negative regulation of skeletal muscle tissue development(GO:0048642) |
| 0.6 |
16.8 |
GO:0002089 |
lens morphogenesis in camera-type eye(GO:0002089) |
| 0.6 |
0.6 |
GO:1990379 |
lipid transport across blood brain barrier(GO:1990379) |
| 0.6 |
2.6 |
GO:0000255 |
allantoin metabolic process(GO:0000255) creatine metabolic process(GO:0006600) |
| 0.6 |
1.9 |
GO:0010871 |
negative regulation of receptor biosynthetic process(GO:0010871) |
| 0.6 |
8.9 |
GO:0006388 |
tRNA splicing, via endonucleolytic cleavage and ligation(GO:0006388) |
| 0.6 |
1.9 |
GO:1904879 |
positive regulation of calcium ion transmembrane transport via high voltage-gated calcium channel(GO:1904879) |
| 0.6 |
7.0 |
GO:0019985 |
translesion synthesis(GO:0019985) |
| 0.6 |
1.9 |
GO:0043101 |
purine-containing compound salvage(GO:0043101) |
| 0.6 |
1.9 |
GO:1902528 |
regulation of protein linear polyubiquitination(GO:1902528) positive regulation of protein linear polyubiquitination(GO:1902530) |
| 0.6 |
1.9 |
GO:0007525 |
somatic muscle development(GO:0007525) |
| 0.6 |
1.3 |
GO:0097527 |
necroptotic signaling pathway(GO:0097527) |
| 0.6 |
5.6 |
GO:0034501 |
protein localization to kinetochore(GO:0034501) |
| 0.6 |
1.9 |
GO:0002408 |
myeloid dendritic cell chemotaxis(GO:0002408) |
| 0.6 |
1.9 |
GO:0048478 |
replication fork protection(GO:0048478) |
| 0.6 |
1.8 |
GO:1903903 |
striated muscle atrophy(GO:0014891) regulation of establishment of T cell polarity(GO:1903903) |
| 0.6 |
0.6 |
GO:0050857 |
positive regulation of antigen receptor-mediated signaling pathway(GO:0050857) positive regulation of T cell receptor signaling pathway(GO:0050862) |
| 0.6 |
2.4 |
GO:0070779 |
D-aspartate transport(GO:0070777) D-aspartate import(GO:0070779) |
| 0.6 |
7.9 |
GO:0006309 |
apoptotic DNA fragmentation(GO:0006309) |
| 0.6 |
1.8 |
GO:1901097 |
negative regulation of autophagosome maturation(GO:1901097) |
| 0.6 |
3.0 |
GO:0033632 |
regulation of cell-cell adhesion mediated by integrin(GO:0033632) |
| 0.6 |
2.4 |
GO:0014029 |
neural crest formation(GO:0014029) |
| 0.6 |
2.4 |
GO:0009068 |
aspartate family amino acid catabolic process(GO:0009068) |
| 0.6 |
1.8 |
GO:0002036 |
regulation of L-glutamate transport(GO:0002036) |
| 0.6 |
1.8 |
GO:0035330 |
regulation of hippo signaling(GO:0035330) |
| 0.6 |
3.5 |
GO:0048549 |
positive regulation of pinocytosis(GO:0048549) |
| 0.6 |
2.9 |
GO:0006167 |
AMP biosynthetic process(GO:0006167) |
| 0.6 |
0.6 |
GO:0033630 |
positive regulation of cell adhesion mediated by integrin(GO:0033630) |
| 0.6 |
8.2 |
GO:0042994 |
cytoplasmic sequestering of transcription factor(GO:0042994) |
| 0.6 |
2.9 |
GO:1904721 |
regulation of mRNA cleavage(GO:0031437) negative regulation of mRNA cleavage(GO:0031438) negative regulation of immunoglobulin secretion(GO:0051025) negative regulation of ribonuclease activity(GO:0060701) negative regulation of endoribonuclease activity(GO:0060702) regulation of mRNA endonucleolytic cleavage involved in unfolded protein response(GO:1904720) negative regulation of mRNA endonucleolytic cleavage involved in unfolded protein response(GO:1904721) |
| 0.6 |
8.8 |
GO:0051043 |
regulation of membrane protein ectodomain proteolysis(GO:0051043) |
| 0.6 |
1.2 |
GO:0048861 |
leukemia inhibitory factor signaling pathway(GO:0048861) |
| 0.6 |
2.3 |
GO:0042938 |
dipeptide transport(GO:0042938) |
| 0.6 |
1.7 |
GO:0030862 |
neuroblast division in subventricular zone(GO:0021849) regulation of polarized epithelial cell differentiation(GO:0030860) positive regulation of polarized epithelial cell differentiation(GO:0030862) |
| 0.6 |
2.9 |
GO:0043586 |
tongue development(GO:0043586) |
| 0.6 |
8.0 |
GO:2001224 |
positive regulation of neuron migration(GO:2001224) |
| 0.6 |
1.1 |
GO:0060447 |
bud outgrowth involved in lung branching(GO:0060447) |
| 0.6 |
1.1 |
GO:0006369 |
termination of RNA polymerase II transcription(GO:0006369) |
| 0.6 |
12.6 |
GO:0000038 |
very long-chain fatty acid metabolic process(GO:0000038) |
| 0.6 |
1.1 |
GO:0045014 |
carbon catabolite repression of transcription(GO:0045013) negative regulation of transcription by glucose(GO:0045014) |
| 0.6 |
1.7 |
GO:0031536 |
positive regulation of exit from mitosis(GO:0031536) |
| 0.6 |
2.3 |
GO:0048539 |
bone marrow development(GO:0048539) |
| 0.6 |
0.6 |
GO:0033762 |
response to glucagon(GO:0033762) |
| 0.6 |
1.7 |
GO:0006532 |
aspartate biosynthetic process(GO:0006532) |
| 0.6 |
2.3 |
GO:0019800 |
peptide cross-linking via chondroitin 4-sulfate glycosaminoglycan(GO:0019800) |
| 0.6 |
9.0 |
GO:0060134 |
prepulse inhibition(GO:0060134) |
| 0.6 |
16.3 |
GO:0051310 |
metaphase plate congression(GO:0051310) |
| 0.6 |
2.8 |
GO:0071670 |
smooth muscle cell chemotaxis(GO:0071670) |
| 0.6 |
4.5 |
GO:0015868 |
purine ribonucleotide transport(GO:0015868) |
| 0.6 |
7.2 |
GO:0032211 |
negative regulation of telomere maintenance via telomerase(GO:0032211) |
| 0.6 |
0.6 |
GO:0072048 |
pattern specification involved in kidney development(GO:0061004) renal system pattern specification(GO:0072048) |
| 0.6 |
1.7 |
GO:0006564 |
L-serine biosynthetic process(GO:0006564) |
| 0.6 |
6.6 |
GO:0032060 |
bleb assembly(GO:0032060) |
| 0.5 |
2.7 |
GO:2000255 |
negative regulation of male germ cell proliferation(GO:2000255) |
| 0.5 |
3.8 |
GO:1900262 |
regulation of DNA-directed DNA polymerase activity(GO:1900262) positive regulation of DNA-directed DNA polymerase activity(GO:1900264) |
| 0.5 |
0.5 |
GO:0034242 |
negative regulation of syncytium formation by plasma membrane fusion(GO:0034242) |
| 0.5 |
1.6 |
GO:2000781 |
positive regulation of double-strand break repair(GO:2000781) |
| 0.5 |
2.2 |
GO:0003365 |
establishment of cell polarity involved in ameboidal cell migration(GO:0003365) |
| 0.5 |
1.6 |
GO:0072488 |
ammonium transmembrane transport(GO:0072488) |
| 0.5 |
1.6 |
GO:0001561 |
fatty acid alpha-oxidation(GO:0001561) |
| 0.5 |
5.4 |
GO:0030388 |
fructose 1,6-bisphosphate metabolic process(GO:0030388) |
| 0.5 |
1.6 |
GO:1900747 |
negative regulation of vascular endothelial growth factor signaling pathway(GO:1900747) |
| 0.5 |
2.2 |
GO:2000525 |
regulation of T cell costimulation(GO:2000523) positive regulation of T cell costimulation(GO:2000525) |
| 0.5 |
8.1 |
GO:1902043 |
positive regulation of extrinsic apoptotic signaling pathway via death domain receptors(GO:1902043) |
| 0.5 |
1.6 |
GO:1990046 |
positive regulation of mitochondrial DNA replication(GO:0090297) regulation of cardiolipin metabolic process(GO:1900208) positive regulation of cardiolipin metabolic process(GO:1900210) stress-induced mitochondrial fusion(GO:1990046) |
| 0.5 |
2.1 |
GO:0018242 |
protein O-linked glycosylation via serine(GO:0018242) |
| 0.5 |
2.1 |
GO:0097211 |
response to gonadotropin-releasing hormone(GO:0097210) cellular response to gonadotropin-releasing hormone(GO:0097211) |
| 0.5 |
0.5 |
GO:0010643 |
cell communication by chemical coupling(GO:0010643) |
| 0.5 |
1.1 |
GO:0060576 |
intestinal epithelial cell development(GO:0060576) |
| 0.5 |
2.6 |
GO:0061365 |
positive regulation of triglyceride lipase activity(GO:0061365) |
| 0.5 |
2.1 |
GO:2001032 |
regulation of double-strand break repair via nonhomologous end joining(GO:2001032) |
| 0.5 |
0.5 |
GO:0048736 |
appendage development(GO:0048736) limb development(GO:0060173) |
| 0.5 |
3.1 |
GO:2000254 |
regulation of male germ cell proliferation(GO:2000254) |
| 0.5 |
2.1 |
GO:0043415 |
positive regulation of skeletal muscle tissue regeneration(GO:0043415) |
| 0.5 |
1.0 |
GO:0019405 |
alditol catabolic process(GO:0019405) |
| 0.5 |
1.5 |
GO:0071394 |
cellular response to testosterone stimulus(GO:0071394) |
| 0.5 |
8.7 |
GO:0042347 |
negative regulation of NF-kappaB import into nucleus(GO:0042347) |
| 0.5 |
3.6 |
GO:0031119 |
tRNA pseudouridine synthesis(GO:0031119) |
| 0.5 |
1.5 |
GO:0009812 |
flavonoid metabolic process(GO:0009812) flavonoid biosynthetic process(GO:0009813) flavonoid glucuronidation(GO:0052696) |
| 0.5 |
3.0 |
GO:0001980 |
regulation of systemic arterial blood pressure by ischemic conditions(GO:0001980) |
| 0.5 |
6.0 |
GO:0009954 |
proximal/distal pattern formation(GO:0009954) |
| 0.5 |
1.0 |
GO:1903054 |
negative regulation of extracellular matrix organization(GO:1903054) |
| 0.5 |
2.0 |
GO:2000346 |
negative regulation of hepatocyte proliferation(GO:2000346) |
| 0.5 |
1.5 |
GO:0050861 |
positive regulation of B cell receptor signaling pathway(GO:0050861) |
| 0.5 |
3.0 |
GO:0045218 |
zonula adherens maintenance(GO:0045218) |
| 0.5 |
2.0 |
GO:0031424 |
keratinization(GO:0031424) |
| 0.5 |
1.5 |
GO:0003273 |
cell migration involved in endocardial cushion formation(GO:0003273) |
| 0.5 |
2.9 |
GO:0042730 |
fibrinolysis(GO:0042730) |
| 0.5 |
2.9 |
GO:2000392 |
regulation of lamellipodium morphogenesis(GO:2000392) |
| 0.5 |
1.0 |
GO:0060023 |
soft palate development(GO:0060023) |
| 0.5 |
3.9 |
GO:0002318 |
myeloid progenitor cell differentiation(GO:0002318) |
| 0.5 |
1.9 |
GO:0042905 |
9-cis-retinoic acid biosynthetic process(GO:0042904) 9-cis-retinoic acid metabolic process(GO:0042905) |
| 0.5 |
1.9 |
GO:0010510 |
regulation of acetyl-CoA biosynthetic process from pyruvate(GO:0010510) |
| 0.5 |
5.3 |
GO:0032000 |
positive regulation of fatty acid beta-oxidation(GO:0032000) |
| 0.5 |
1.9 |
GO:0016266 |
O-glycan processing(GO:0016266) |
| 0.5 |
9.1 |
GO:0050434 |
positive regulation of viral transcription(GO:0050434) |
| 0.5 |
1.9 |
GO:0046909 |
intermembrane transport(GO:0046909) |
| 0.5 |
1.4 |
GO:0010389 |
regulation of G2/M transition of mitotic cell cycle(GO:0010389) regulation of cell cycle G2/M phase transition(GO:1902749) |
| 0.5 |
1.4 |
GO:0060217 |
hemangioblast cell differentiation(GO:0060217) |
| 0.5 |
4.7 |
GO:0070986 |
left/right axis specification(GO:0070986) |
| 0.5 |
0.5 |
GO:1903224 |
regulation of endodermal cell differentiation(GO:1903224) |
| 0.5 |
4.3 |
GO:0007042 |
lysosomal lumen acidification(GO:0007042) |
| 0.5 |
1.9 |
GO:0090027 |
negative regulation of monocyte chemotaxis(GO:0090027) |
| 0.5 |
3.8 |
GO:0071801 |
regulation of podosome assembly(GO:0071801) |
| 0.5 |
4.2 |
GO:0046033 |
AMP metabolic process(GO:0046033) |
| 0.5 |
2.3 |
GO:0070125 |
mitochondrial translational elongation(GO:0070125) |
| 0.5 |
26.2 |
GO:0006635 |
fatty acid beta-oxidation(GO:0006635) |
| 0.5 |
0.9 |
GO:0007161 |
calcium-independent cell-matrix adhesion(GO:0007161) |
| 0.5 |
0.5 |
GO:0034427 |
nuclear-transcribed mRNA catabolic process, exonucleolytic, 3'-5'(GO:0034427) U4 snRNA 3'-end processing(GO:0034475) DNA deamination(GO:0045006) polyadenylation-dependent snoRNA 3'-end processing(GO:0071051) |
| 0.5 |
1.4 |
GO:0071680 |
response to indole-3-methanol(GO:0071680) cellular response to indole-3-methanol(GO:0071681) |
| 0.5 |
3.7 |
GO:0033353 |
S-adenosylmethionine cycle(GO:0033353) |
| 0.5 |
7.3 |
GO:0071398 |
cellular response to fatty acid(GO:0071398) |
| 0.5 |
1.8 |
GO:1903265 |
positive regulation of tumor necrosis factor-mediated signaling pathway(GO:1903265) |
| 0.5 |
2.3 |
GO:0045654 |
positive regulation of megakaryocyte differentiation(GO:0045654) |
| 0.5 |
1.4 |
GO:0046168 |
glycerol-3-phosphate catabolic process(GO:0046168) |
| 0.5 |
1.4 |
GO:0032474 |
otolith morphogenesis(GO:0032474) |
| 0.5 |
0.9 |
GO:0070425 |
negative regulation of nucleotide-binding oligomerization domain containing signaling pathway(GO:0070425) negative regulation of nucleotide-binding oligomerization domain containing 2 signaling pathway(GO:0070433) |
| 0.4 |
5.8 |
GO:0006851 |
mitochondrial calcium ion transport(GO:0006851) |
| 0.4 |
0.4 |
GO:0032929 |
negative regulation of superoxide anion generation(GO:0032929) |
| 0.4 |
4.9 |
GO:0035116 |
embryonic hindlimb morphogenesis(GO:0035116) |
| 0.4 |
1.3 |
GO:2000675 |
negative regulation of type B pancreatic cell apoptotic process(GO:2000675) |
| 0.4 |
4.0 |
GO:0009134 |
nucleoside diphosphate catabolic process(GO:0009134) ribonucleoside diphosphate catabolic process(GO:0009191) |
| 0.4 |
3.6 |
GO:1904707 |
positive regulation of vascular smooth muscle cell proliferation(GO:1904707) |
| 0.4 |
6.6 |
GO:0042178 |
xenobiotic catabolic process(GO:0042178) |
| 0.4 |
8.3 |
GO:0051127 |
positive regulation of actin nucleation(GO:0051127) |
| 0.4 |
0.9 |
GO:0007262 |
STAT protein import into nucleus(GO:0007262) |
| 0.4 |
3.1 |
GO:0006517 |
protein deglycosylation(GO:0006517) |
| 0.4 |
0.4 |
GO:0061309 |
cardiac neural crest cell development involved in outflow tract morphogenesis(GO:0061309) |
| 0.4 |
2.6 |
GO:0097368 |
establishment of Sertoli cell barrier(GO:0097368) |
| 0.4 |
0.9 |
GO:0090071 |
negative regulation of ribosome biogenesis(GO:0090071) |
| 0.4 |
1.7 |
GO:0060352 |
cell adhesion molecule production(GO:0060352) |
| 0.4 |
1.3 |
GO:0009948 |
anterior/posterior axis specification(GO:0009948) |
| 0.4 |
1.3 |
GO:0035795 |
negative regulation of mitochondrial membrane permeability(GO:0035795) |
| 0.4 |
1.7 |
GO:1904491 |
protein localization to ciliary transition zone(GO:1904491) |
| 0.4 |
0.4 |
GO:0016126 |
sterol biosynthetic process(GO:0016126) |
| 0.4 |
1.3 |
GO:0002934 |
desmosome organization(GO:0002934) |
| 0.4 |
5.1 |
GO:0010569 |
regulation of double-strand break repair via homologous recombination(GO:0010569) |
| 0.4 |
7.6 |
GO:0006825 |
copper ion transport(GO:0006825) |
| 0.4 |
0.4 |
GO:0003406 |
retinal pigment epithelium development(GO:0003406) |
| 0.4 |
1.7 |
GO:0001676 |
long-chain fatty acid metabolic process(GO:0001676) |
| 0.4 |
2.9 |
GO:0007016 |
cytoskeletal anchoring at plasma membrane(GO:0007016) |
| 0.4 |
2.9 |
GO:0035881 |
amacrine cell differentiation(GO:0035881) |
| 0.4 |
0.4 |
GO:0010940 |
positive regulation of necrotic cell death(GO:0010940) |
| 0.4 |
2.5 |
GO:0006452 |
translational frameshifting(GO:0006452) positive regulation of translational termination(GO:0045905) |
| 0.4 |
0.4 |
GO:0006296 |
nucleotide-excision repair, DNA incision, 5'-to lesion(GO:0006296) |
| 0.4 |
1.2 |
GO:0060907 |
positive regulation of macrophage cytokine production(GO:0060907) |
| 0.4 |
4.5 |
GO:0048368 |
lateral mesoderm development(GO:0048368) |
| 0.4 |
1.7 |
GO:0090467 |
L-arginine import(GO:0043091) arginine import(GO:0090467) L-arginine transport(GO:1902023) |
| 0.4 |
1.2 |
GO:0043383 |
negative T cell selection(GO:0043383) negative thymic T cell selection(GO:0045060) |
| 0.4 |
2.1 |
GO:0051409 |
response to nitrosative stress(GO:0051409) |
| 0.4 |
1.2 |
GO:0018158 |
protein oxidation(GO:0018158) |
| 0.4 |
1.2 |
GO:1902044 |
regulation of Fas signaling pathway(GO:1902044) negative regulation of Fas signaling pathway(GO:1902045) |
| 0.4 |
2.5 |
GO:0048227 |
plasma membrane to endosome transport(GO:0048227) |
| 0.4 |
0.4 |
GO:0030497 |
fatty acid elongation(GO:0030497) |
| 0.4 |
0.8 |
GO:0019676 |
ammonia assimilation cycle(GO:0019676) |
| 0.4 |
0.8 |
GO:0044339 |
canonical Wnt signaling pathway involved in osteoblast differentiation(GO:0044339) |
| 0.4 |
2.4 |
GO:0015840 |
urea transport(GO:0015840) urea transmembrane transport(GO:0071918) |
| 0.4 |
2.0 |
GO:0071038 |
nuclear polyadenylation-dependent tRNA catabolic process(GO:0071038) |
| 0.4 |
0.8 |
GO:0097296 |
activation of cysteine-type endopeptidase activity involved in apoptotic signaling pathway(GO:0097296) |
| 0.4 |
1.2 |
GO:0007066 |
female meiosis sister chromatid cohesion(GO:0007066) |
| 0.4 |
0.4 |
GO:0097435 |
fibril organization(GO:0097435) |
| 0.4 |
0.8 |
GO:0010838 |
positive regulation of keratinocyte proliferation(GO:0010838) |
| 0.4 |
0.4 |
GO:0032497 |
detection of lipopolysaccharide(GO:0032497) |
| 0.4 |
1.2 |
GO:0045915 |
positive regulation of catecholamine metabolic process(GO:0045915) positive regulation of dopamine metabolic process(GO:0045964) |
| 0.4 |
3.6 |
GO:0071763 |
nuclear membrane organization(GO:0071763) |
| 0.4 |
1.2 |
GO:0009125 |
nucleoside monophosphate catabolic process(GO:0009125) |
| 0.4 |
2.0 |
GO:0034196 |
acylglycerol transport(GO:0034196) triglyceride transport(GO:0034197) |
| 0.4 |
5.6 |
GO:0003417 |
growth plate cartilage development(GO:0003417) |
| 0.4 |
0.8 |
GO:0002457 |
T cell antigen processing and presentation(GO:0002457) |
| 0.4 |
0.8 |
GO:1901858 |
regulation of mitochondrial DNA metabolic process(GO:1901858) |
| 0.4 |
1.6 |
GO:0007406 |
negative regulation of neuroblast proliferation(GO:0007406) |
| 0.4 |
2.8 |
GO:0060179 |
male mating behavior(GO:0060179) |
| 0.4 |
0.4 |
GO:0045472 |
response to ether(GO:0045472) |
| 0.4 |
0.4 |
GO:2000504 |
positive regulation of blood vessel remodeling(GO:2000504) |
| 0.4 |
2.3 |
GO:0006730 |
one-carbon metabolic process(GO:0006730) |
| 0.4 |
0.8 |
GO:0021546 |
rhombomere development(GO:0021546) |
| 0.4 |
2.3 |
GO:0036376 |
sodium ion export from cell(GO:0036376) |
| 0.4 |
0.8 |
GO:0060279 |
positive regulation of ovulation(GO:0060279) |
| 0.4 |
1.9 |
GO:0015670 |
carbon dioxide transport(GO:0015670) |
| 0.4 |
1.2 |
GO:0002184 |
cytoplasmic translational termination(GO:0002184) |
| 0.4 |
1.5 |
GO:0021830 |
interneuron migration from the subpallium to the cortex(GO:0021830) |
| 0.4 |
6.9 |
GO:0014009 |
glial cell proliferation(GO:0014009) |
| 0.4 |
2.7 |
GO:2000645 |
negative regulation of receptor catabolic process(GO:2000645) |
| 0.4 |
2.3 |
GO:0042984 |
amyloid precursor protein biosynthetic process(GO:0042983) regulation of amyloid precursor protein biosynthetic process(GO:0042984) |
| 0.4 |
1.1 |
GO:1903896 |
positive regulation of IRE1-mediated unfolded protein response(GO:1903896) positive regulation of PERK-mediated unfolded protein response(GO:1903899) |
| 0.4 |
11.8 |
GO:0034723 |
DNA replication-dependent nucleosome assembly(GO:0006335) DNA replication-dependent nucleosome organization(GO:0034723) |
| 0.4 |
0.4 |
GO:0045900 |
negative regulation of translational elongation(GO:0045900) |
| 0.4 |
0.4 |
GO:0043654 |
recognition of apoptotic cell(GO:0043654) |
| 0.4 |
1.9 |
GO:0050651 |
dermatan sulfate proteoglycan biosynthetic process(GO:0050651) |
| 0.4 |
1.9 |
GO:0045743 |
positive regulation of fibroblast growth factor receptor signaling pathway(GO:0045743) |
| 0.4 |
1.9 |
GO:0046135 |
pyrimidine ribonucleoside catabolic process(GO:0046133) pyrimidine nucleoside catabolic process(GO:0046135) |
| 0.4 |
2.3 |
GO:0019321 |
pentose metabolic process(GO:0019321) |
| 0.4 |
3.0 |
GO:0010606 |
positive regulation of cytoplasmic mRNA processing body assembly(GO:0010606) |
| 0.4 |
1.8 |
GO:0046329 |
negative regulation of JNK cascade(GO:0046329) |
| 0.4 |
0.4 |
GO:0002309 |
T cell proliferation involved in immune response(GO:0002309) |
| 0.4 |
1.1 |
GO:2000705 |
regulation of dense core granule biogenesis(GO:2000705) |
| 0.4 |
2.2 |
GO:0008300 |
isoprenoid catabolic process(GO:0008300) |
| 0.4 |
11.9 |
GO:0006911 |
phagocytosis, engulfment(GO:0006911) |
| 0.4 |
3.6 |
GO:0042345 |
regulation of NF-kappaB import into nucleus(GO:0042345) NF-kappaB import into nucleus(GO:0042348) |
| 0.4 |
0.7 |
GO:1902031 |
regulation of NADP metabolic process(GO:1902031) |
| 0.4 |
0.4 |
GO:0032224 |
positive regulation of synaptic transmission, cholinergic(GO:0032224) |
| 0.4 |
0.7 |
GO:0000707 |
meiotic DNA recombinase assembly(GO:0000707) strand invasion(GO:0042148) |
| 0.4 |
4.3 |
GO:0019262 |
N-acetylneuraminate catabolic process(GO:0019262) |
| 0.4 |
1.1 |
GO:0002331 |
pre-B cell allelic exclusion(GO:0002331) |
| 0.4 |
0.4 |
GO:0032713 |
negative regulation of interleukin-4 production(GO:0032713) |
| 0.4 |
1.4 |
GO:0045903 |
positive regulation of translational fidelity(GO:0045903) |
| 0.4 |
1.1 |
GO:2000049 |
positive regulation of cell-cell adhesion mediated by cadherin(GO:2000049) |
| 0.4 |
0.4 |
GO:1904154 |
positive regulation of retrograde protein transport, ER to cytosol(GO:1904154) |
| 0.4 |
4.3 |
GO:0060055 |
angiogenesis involved in wound healing(GO:0060055) |
| 0.4 |
2.5 |
GO:0017196 |
N-terminal peptidyl-methionine acetylation(GO:0017196) |
| 0.4 |
1.1 |
GO:0033313 |
meiotic cell cycle checkpoint(GO:0033313) |
| 0.4 |
0.4 |
GO:0031590 |
wybutosine metabolic process(GO:0031590) wybutosine biosynthetic process(GO:0031591) |
| 0.4 |
4.6 |
GO:1902857 |
positive regulation of nonmotile primary cilium assembly(GO:1902857) |
| 0.4 |
1.1 |
GO:0002016 |
regulation of blood volume by renin-angiotensin(GO:0002016) |
| 0.4 |
1.4 |
GO:0098535 |
de novo centriole assembly(GO:0098535) |
| 0.3 |
1.0 |
GO:0003349 |
epicardium-derived cardiac endothelial cell differentiation(GO:0003349) |
| 0.3 |
0.3 |
GO:0071224 |
cellular response to peptidoglycan(GO:0071224) |
| 0.3 |
4.8 |
GO:0019369 |
arachidonic acid metabolic process(GO:0019369) |
| 0.3 |
6.9 |
GO:0097150 |
neuronal stem cell population maintenance(GO:0097150) |
| 0.3 |
6.4 |
GO:0006607 |
NLS-bearing protein import into nucleus(GO:0006607) |
| 0.3 |
2.0 |
GO:0016255 |
attachment of GPI anchor to protein(GO:0016255) |
| 0.3 |
2.0 |
GO:0070475 |
rRNA base methylation(GO:0070475) |
| 0.3 |
9.4 |
GO:0030488 |
tRNA methylation(GO:0030488) |
| 0.3 |
0.3 |
GO:0045358 |
negative regulation of interferon-beta biosynthetic process(GO:0045358) |
| 0.3 |
0.3 |
GO:0060414 |
aorta smooth muscle tissue morphogenesis(GO:0060414) |
| 0.3 |
2.0 |
GO:0060164 |
regulation of timing of neuron differentiation(GO:0060164) |
| 0.3 |
1.0 |
GO:0060809 |
mesodermal to mesenchymal transition involved in gastrulation(GO:0060809) |
| 0.3 |
1.3 |
GO:0046836 |
glycolipid transport(GO:0046836) |
| 0.3 |
2.6 |
GO:0033211 |
adiponectin-activated signaling pathway(GO:0033211) |
| 0.3 |
5.3 |
GO:0042491 |
auditory receptor cell differentiation(GO:0042491) |
| 0.3 |
1.0 |
GO:0009174 |
UMP biosynthetic process(GO:0006222) pyrimidine ribonucleoside monophosphate metabolic process(GO:0009173) pyrimidine ribonucleoside monophosphate biosynthetic process(GO:0009174) UMP metabolic process(GO:0046049) |
| 0.3 |
4.6 |
GO:0060441 |
epithelial tube branching involved in lung morphogenesis(GO:0060441) |
| 0.3 |
1.6 |
GO:0006681 |
galactosylceramide metabolic process(GO:0006681) galactolipid metabolic process(GO:0019374) |
| 0.3 |
0.7 |
GO:0046391 |
5-phosphoribose 1-diphosphate biosynthetic process(GO:0006015) 5-phosphoribose 1-diphosphate metabolic process(GO:0046391) |
| 0.3 |
1.3 |
GO:0019287 |
isopentenyl diphosphate biosynthetic process(GO:0009240) isopentenyl diphosphate biosynthetic process, mevalonate pathway(GO:0019287) isopentenyl diphosphate metabolic process(GO:0046490) |
| 0.3 |
10.4 |
GO:0003341 |
cilium movement(GO:0003341) |
| 0.3 |
1.0 |
GO:1903966 |
monounsaturated fatty acid metabolic process(GO:1903964) monounsaturated fatty acid biosynthetic process(GO:1903966) |
| 0.3 |
2.3 |
GO:0042095 |
interferon-gamma biosynthetic process(GO:0042095) |
| 0.3 |
1.0 |
GO:0008594 |
photoreceptor cell morphogenesis(GO:0008594) |
| 0.3 |
9.0 |
GO:0006284 |
base-excision repair(GO:0006284) |
| 0.3 |
2.6 |
GO:0006004 |
fucose metabolic process(GO:0006004) |
| 0.3 |
5.1 |
GO:0006516 |
glycoprotein catabolic process(GO:0006516) |
| 0.3 |
1.3 |
GO:0035022 |
positive regulation of Rac protein signal transduction(GO:0035022) |
| 0.3 |
0.9 |
GO:0035964 |
COPI-coated vesicle budding(GO:0035964) |
| 0.3 |
1.6 |
GO:0015788 |
UDP-N-acetylglucosamine transport(GO:0015788) |
| 0.3 |
2.5 |
GO:0010839 |
negative regulation of keratinocyte proliferation(GO:0010839) |
| 0.3 |
3.8 |
GO:1900383 |
regulation of synaptic plasticity by receptor localization to synapse(GO:1900383) |
| 0.3 |
0.6 |
GO:0090370 |
negative regulation of cholesterol efflux(GO:0090370) |
| 0.3 |
3.8 |
GO:0032967 |
positive regulation of collagen biosynthetic process(GO:0032967) |
| 0.3 |
7.8 |
GO:0032611 |
interleukin-1 beta production(GO:0032611) |
| 0.3 |
0.3 |
GO:0072497 |
mesenchymal stem cell differentiation(GO:0072497) regulation of mesenchymal stem cell differentiation(GO:2000739) |
| 0.3 |
0.3 |
GO:0070315 |
G1 to G0 transition involved in cell differentiation(GO:0070315) |
| 0.3 |
1.6 |
GO:0000050 |
urea cycle(GO:0000050) urea metabolic process(GO:0019627) |
| 0.3 |
5.0 |
GO:0045880 |
positive regulation of smoothened signaling pathway(GO:0045880) |
| 0.3 |
0.6 |
GO:0045780 |
positive regulation of tissue remodeling(GO:0034105) positive regulation of bone resorption(GO:0045780) positive regulation of bone remodeling(GO:0046852) |
| 0.3 |
3.4 |
GO:0010883 |
regulation of lipid storage(GO:0010883) |
| 0.3 |
1.5 |
GO:0044854 |
plasma membrane raft assembly(GO:0044854) plasma membrane raft organization(GO:0044857) caveola assembly(GO:0070836) |
| 0.3 |
1.8 |
GO:1902166 |
negative regulation of intrinsic apoptotic signaling pathway in response to DNA damage by p53 class mediator(GO:1902166) |
| 0.3 |
3.1 |
GO:0040034 |
regulation of development, heterochronic(GO:0040034) |
| 0.3 |
0.9 |
GO:0070498 |
interleukin-1-mediated signaling pathway(GO:0070498) |
| 0.3 |
11.0 |
GO:0000725 |
double-strand break repair via homologous recombination(GO:0000724) recombinational repair(GO:0000725) |
| 0.3 |
0.6 |
GO:0030220 |
platelet formation(GO:0030220) platelet morphogenesis(GO:0036344) |
| 0.3 |
2.1 |
GO:0036297 |
interstrand cross-link repair(GO:0036297) |
| 0.3 |
0.9 |
GO:0006265 |
DNA topological change(GO:0006265) |
| 0.3 |
0.9 |
GO:0034729 |
histone H3-K79 methylation(GO:0034729) |
| 0.3 |
2.4 |
GO:0001672 |
regulation of chromatin assembly or disassembly(GO:0001672) |
| 0.3 |
1.2 |
GO:0002949 |
tRNA threonylcarbamoyladenosine modification(GO:0002949) |
| 0.3 |
3.3 |
GO:0090435 |
protein localization to nuclear envelope(GO:0090435) |
| 0.3 |
2.9 |
GO:0044406 |
adhesion of symbiont to host(GO:0044406) |
| 0.3 |
0.9 |
GO:0034184 |
positive regulation of maintenance of sister chromatid cohesion(GO:0034093) positive regulation of maintenance of mitotic sister chromatid cohesion(GO:0034184) |
| 0.3 |
1.7 |
GO:0031547 |
brain-derived neurotrophic factor receptor signaling pathway(GO:0031547) |
| 0.3 |
0.6 |
GO:0015712 |
hexose phosphate transport(GO:0015712) glucose-6-phosphate transport(GO:0015760) |
| 0.3 |
0.6 |
GO:0006298 |
mismatch repair(GO:0006298) |
| 0.3 |
0.6 |
GO:0035864 |
response to potassium ion(GO:0035864) cellular response to potassium ion(GO:0035865) |
| 0.3 |
1.4 |
GO:1901029 |
negative regulation of mitochondrial outer membrane permeabilization involved in apoptotic signaling pathway(GO:1901029) |
| 0.3 |
0.6 |
GO:2000224 |
testosterone biosynthetic process(GO:0061370) regulation of testosterone biosynthetic process(GO:2000224) |
| 0.3 |
0.9 |
GO:0031990 |
mRNA export from nucleus in response to heat stress(GO:0031990) |
| 0.3 |
0.3 |
GO:0038161 |
prolactin signaling pathway(GO:0038161) |
| 0.3 |
0.3 |
GO:0045040 |
outer mitochondrial membrane organization(GO:0007008) protein import into mitochondrial outer membrane(GO:0045040) |
| 0.3 |
1.4 |
GO:0071360 |
cellular response to exogenous dsRNA(GO:0071360) |
| 0.3 |
0.9 |
GO:0046900 |
tetrahydrofolylpolyglutamate metabolic process(GO:0046900) |
| 0.3 |
1.4 |
GO:0033008 |
positive regulation of mast cell activation involved in immune response(GO:0033008) positive regulation of mast cell degranulation(GO:0043306) |
| 0.3 |
0.9 |
GO:0006428 |
isoleucyl-tRNA aminoacylation(GO:0006428) |
| 0.3 |
0.3 |
GO:0060602 |
branch elongation of an epithelium(GO:0060602) |
| 0.3 |
2.0 |
GO:0001833 |
inner cell mass cell proliferation(GO:0001833) |
| 0.3 |
2.0 |
GO:0035563 |
positive regulation of chromatin binding(GO:0035563) |
| 0.3 |
1.1 |
GO:0034440 |
lipid oxidation(GO:0034440) |
| 0.3 |
0.3 |
GO:0070973 |
protein localization to endoplasmic reticulum exit site(GO:0070973) |
| 0.3 |
0.3 |
GO:0050859 |
negative regulation of B cell receptor signaling pathway(GO:0050859) |
| 0.3 |
0.3 |
GO:0045852 |
pH elevation(GO:0045852) intracellular pH elevation(GO:0051454) |
| 0.3 |
0.8 |
GO:0044539 |
long-chain fatty acid import(GO:0044539) |
| 0.3 |
0.3 |
GO:0032196 |
transposition(GO:0032196) |
| 0.3 |
0.3 |
GO:0006824 |
cobalt ion transport(GO:0006824) |
| 0.3 |
2.5 |
GO:0046499 |
S-adenosylmethioninamine metabolic process(GO:0046499) |
| 0.3 |
3.3 |
GO:0000463 |
maturation of LSU-rRNA from tricistronic rRNA transcript (SSU-rRNA, 5.8S rRNA, LSU-rRNA)(GO:0000463) |
| 0.3 |
2.5 |
GO:0048712 |
negative regulation of astrocyte differentiation(GO:0048712) |
| 0.3 |
2.2 |
GO:0046643 |
regulation of gamma-delta T cell differentiation(GO:0045586) regulation of gamma-delta T cell activation(GO:0046643) |
| 0.3 |
0.3 |
GO:0006297 |
nucleotide-excision repair, DNA gap filling(GO:0006297) |
| 0.3 |
1.4 |
GO:0060330 |
regulation of response to interferon-gamma(GO:0060330) |
| 0.3 |
1.4 |
GO:0006924 |
activation-induced cell death of T cells(GO:0006924) |
| 0.3 |
1.9 |
GO:0007296 |
vitellogenesis(GO:0007296) |
| 0.3 |
0.3 |
GO:0002756 |
MyD88-independent toll-like receptor signaling pathway(GO:0002756) |
| 0.3 |
1.3 |
GO:0060050 |
positive regulation of protein glycosylation(GO:0060050) |
| 0.3 |
1.9 |
GO:0033689 |
negative regulation of osteoblast proliferation(GO:0033689) |
| 0.3 |
0.5 |
GO:0009071 |
serine family amino acid catabolic process(GO:0009071) |
| 0.3 |
11.4 |
GO:2000134 |
negative regulation of G1/S transition of mitotic cell cycle(GO:2000134) |
| 0.3 |
0.5 |
GO:0072012 |
glomerulus vasculature development(GO:0072012) |
| 0.3 |
1.6 |
GO:0006271 |
DNA strand elongation involved in DNA replication(GO:0006271) |
| 0.3 |
0.3 |
GO:0006189 |
'de novo' IMP biosynthetic process(GO:0006189) |
| 0.3 |
0.3 |
GO:0042776 |
mitochondrial ATP synthesis coupled proton transport(GO:0042776) |
| 0.3 |
6.5 |
GO:0050873 |
brown fat cell differentiation(GO:0050873) |
| 0.3 |
2.1 |
GO:0051574 |
positive regulation of histone H3-K9 methylation(GO:0051574) |
| 0.3 |
1.0 |
GO:0035063 |
nuclear speck organization(GO:0035063) |
| 0.3 |
0.8 |
GO:0045659 |
eosinophil differentiation(GO:0030222) regulation of neutrophil differentiation(GO:0045658) negative regulation of neutrophil differentiation(GO:0045659) |
| 0.3 |
0.3 |
GO:0008611 |
ether lipid biosynthetic process(GO:0008611) glycerol ether biosynthetic process(GO:0046504) cellular lipid biosynthetic process(GO:0097384) ether biosynthetic process(GO:1901503) |
| 0.3 |
1.3 |
GO:0070933 |
histone H4 deacetylation(GO:0070933) |
| 0.3 |
0.5 |
GO:1902965 |
regulation of protein localization to early endosome(GO:1902965) positive regulation of protein localization to early endosome(GO:1902966) |
| 0.3 |
2.0 |
GO:0003062 |
regulation of heart rate by chemical signal(GO:0003062) |
| 0.3 |
3.8 |
GO:0046597 |
negative regulation of viral entry into host cell(GO:0046597) |
| 0.3 |
0.8 |
GO:1901724 |
positive regulation of cell proliferation involved in kidney development(GO:1901724) |
| 0.3 |
39.3 |
GO:0007059 |
chromosome segregation(GO:0007059) |
| 0.3 |
0.5 |
GO:0048631 |
regulation of skeletal muscle tissue growth(GO:0048631) positive regulation of skeletal muscle tissue growth(GO:0048633) |
| 0.3 |
0.8 |
GO:0071404 |
cellular response to lipoprotein particle stimulus(GO:0071402) cellular response to low-density lipoprotein particle stimulus(GO:0071404) |
| 0.3 |
2.3 |
GO:0051290 |
protein heterotetramerization(GO:0051290) |
| 0.2 |
1.7 |
GO:0018344 |
protein geranylgeranylation(GO:0018344) |
| 0.2 |
3.5 |
GO:0045943 |
positive regulation of transcription from RNA polymerase I promoter(GO:0045943) |
| 0.2 |
0.7 |
GO:0006933 |
negative regulation of cell adhesion involved in substrate-bound cell migration(GO:0006933) |
| 0.2 |
2.5 |
GO:0044872 |
lipoprotein transport(GO:0042953) lipoprotein localization(GO:0044872) |
| 0.2 |
1.5 |
GO:0009081 |
branched-chain amino acid metabolic process(GO:0009081) branched-chain amino acid catabolic process(GO:0009083) |
| 0.2 |
1.5 |
GO:0090136 |
epithelial cell-cell adhesion(GO:0090136) |
| 0.2 |
1.2 |
GO:0014886 |
transition between slow and fast fiber(GO:0014886) |
| 0.2 |
0.2 |
GO:0036490 |
regulation of translation in response to endoplasmic reticulum stress(GO:0036490) regulation of translation initiation in response to endoplasmic reticulum stress(GO:0036491) eiF2alpha phosphorylation in response to endoplasmic reticulum stress(GO:0036492) |
| 0.2 |
1.0 |
GO:0051661 |
maintenance of centrosome location(GO:0051661) |
| 0.2 |
1.0 |
GO:0034285 |
response to sucrose(GO:0009744) response to disaccharide(GO:0034285) |
| 0.2 |
1.4 |
GO:0032688 |
negative regulation of interferon-beta production(GO:0032688) |
| 0.2 |
0.5 |
GO:0006348 |
chromatin silencing at telomere(GO:0006348) |
| 0.2 |
0.5 |
GO:1902947 |
regulation of tau-protein kinase activity(GO:1902947) |
| 0.2 |
0.5 |
GO:0006610 |
ribosomal protein import into nucleus(GO:0006610) |
| 0.2 |
0.2 |
GO:0033122 |
regulation of purine nucleotide catabolic process(GO:0033121) negative regulation of purine nucleotide catabolic process(GO:0033122) |
| 0.2 |
0.9 |
GO:0035934 |
corticosterone secretion(GO:0035934) |
| 0.2 |
1.9 |
GO:2000353 |
positive regulation of endothelial cell apoptotic process(GO:2000353) |
| 0.2 |
2.6 |
GO:0035855 |
megakaryocyte development(GO:0035855) |
| 0.2 |
0.7 |
GO:0070120 |
ciliary neurotrophic factor-mediated signaling pathway(GO:0070120) |
| 0.2 |
0.7 |
GO:0032055 |
negative regulation of translation in response to stress(GO:0032055) |
| 0.2 |
1.4 |
GO:0060391 |
positive regulation of SMAD protein import into nucleus(GO:0060391) |
| 0.2 |
0.9 |
GO:0000183 |
chromatin silencing at rDNA(GO:0000183) |
| 0.2 |
0.9 |
GO:0035426 |
extracellular matrix-cell signaling(GO:0035426) |
| 0.2 |
0.9 |
GO:0051096 |
regulation of helicase activity(GO:0051095) positive regulation of helicase activity(GO:0051096) |
| 0.2 |
0.2 |
GO:0071474 |
cellular hyperosmotic response(GO:0071474) |
| 0.2 |
0.5 |
GO:0006268 |
DNA unwinding involved in DNA replication(GO:0006268) |
| 0.2 |
0.5 |
GO:0010701 |
positive regulation of norepinephrine secretion(GO:0010701) |
| 0.2 |
0.7 |
GO:1901341 |
activation of store-operated calcium channel activity(GO:0032237) positive regulation of store-operated calcium channel activity(GO:1901341) |
| 0.2 |
1.1 |
GO:0044375 |
regulation of peroxisome size(GO:0044375) |
| 0.2 |
0.7 |
GO:0006556 |
S-adenosylmethionine biosynthetic process(GO:0006556) |
| 0.2 |
1.1 |
GO:0070171 |
negative regulation of odontogenesis(GO:0042483) negative regulation of tooth mineralization(GO:0070171) |
| 0.2 |
3.1 |
GO:0018126 |
protein hydroxylation(GO:0018126) |
| 0.2 |
0.7 |
GO:0030210 |
heparin biosynthetic process(GO:0030210) |
| 0.2 |
1.8 |
GO:0051451 |
myoblast migration(GO:0051451) |
| 0.2 |
2.0 |
GO:1904407 |
positive regulation of nitric oxide biosynthetic process(GO:0045429) positive regulation of nitric oxide metabolic process(GO:1904407) |
| 0.2 |
6.7 |
GO:0008631 |
intrinsic apoptotic signaling pathway in response to oxidative stress(GO:0008631) |
| 0.2 |
0.7 |
GO:0090038 |
negative regulation of protein kinase C signaling(GO:0090038) |
| 0.2 |
0.2 |
GO:0016078 |
tRNA catabolic process(GO:0016078) |
| 0.2 |
0.2 |
GO:1990564 |
protein polyufmylation(GO:1990564) protein K69-linked ufmylation(GO:1990592) |
| 0.2 |
0.6 |
GO:0048254 |
snoRNA localization(GO:0048254) |
| 0.2 |
2.3 |
GO:0010574 |
regulation of vascular endothelial growth factor production(GO:0010574) |
| 0.2 |
0.4 |
GO:2001053 |
regulation of mesenchymal cell apoptotic process(GO:2001053) negative regulation of mesenchymal cell apoptotic process(GO:2001054) |
| 0.2 |
2.5 |
GO:0046902 |
regulation of mitochondrial membrane permeability(GO:0046902) regulation of membrane permeability(GO:0090559) |
| 0.2 |
0.4 |
GO:0036493 |
positive regulation of translation in response to endoplasmic reticulum stress(GO:0036493) |
| 0.2 |
0.4 |
GO:0030240 |
skeletal muscle thin filament assembly(GO:0030240) |
| 0.2 |
1.5 |
GO:0006363 |
termination of RNA polymerase I transcription(GO:0006363) |
| 0.2 |
0.8 |
GO:0034433 |
steroid esterification(GO:0034433) sterol esterification(GO:0034434) cholesterol esterification(GO:0034435) |
| 0.2 |
3.1 |
GO:0048873 |
homeostasis of number of cells within a tissue(GO:0048873) |
| 0.2 |
2.1 |
GO:0045974 |
miRNA mediated inhibition of translation(GO:0035278) negative regulation of translation, ncRNA-mediated(GO:0040033) regulation of translation, ncRNA-mediated(GO:0045974) |
| 0.2 |
1.0 |
GO:1900086 |
regulation of peptidyl-tyrosine autophosphorylation(GO:1900084) positive regulation of peptidyl-tyrosine autophosphorylation(GO:1900086) |
| 0.2 |
1.6 |
GO:0060707 |
trophoblast giant cell differentiation(GO:0060707) |
| 0.2 |
1.2 |
GO:0031936 |
negative regulation of chromatin silencing(GO:0031936) |
| 0.2 |
1.2 |
GO:0014823 |
response to activity(GO:0014823) |
| 0.2 |
1.8 |
GO:1900364 |
negative regulation of mRNA polyadenylation(GO:1900364) |
| 0.2 |
0.4 |
GO:1905153 |
regulation of membrane invagination(GO:1905153) |
| 0.2 |
1.6 |
GO:0035520 |
monoubiquitinated protein deubiquitination(GO:0035520) |
| 0.2 |
1.0 |
GO:0032460 |
negative regulation of protein oligomerization(GO:0032460) negative regulation of protein homooligomerization(GO:0032463) |
| 0.2 |
0.4 |
GO:0048302 |
regulation of isotype switching to IgG isotypes(GO:0048302) positive regulation of isotype switching to IgG isotypes(GO:0048304) |
| 0.2 |
1.0 |
GO:0090383 |
phagosome acidification(GO:0090383) |
| 0.2 |
2.0 |
GO:0090557 |
establishment of endothelial intestinal barrier(GO:0090557) |
| 0.2 |
0.2 |
GO:1903774 |
positive regulation of viral budding via host ESCRT complex(GO:1903774) |
| 0.2 |
1.2 |
GO:0050766 |
positive regulation of phagocytosis(GO:0050766) |
| 0.2 |
1.0 |
GO:0009411 |
response to UV(GO:0009411) |
| 0.2 |
1.0 |
GO:0006177 |
GMP biosynthetic process(GO:0006177) |
| 0.2 |
0.4 |
GO:1903298 |
regulation of hypoxia-induced intrinsic apoptotic signaling pathway(GO:1903297) negative regulation of hypoxia-induced intrinsic apoptotic signaling pathway(GO:1903298) intrinsic apoptotic signaling pathway in response to hypoxia(GO:1990144) |
| 0.2 |
1.0 |
GO:0003084 |
positive regulation of systemic arterial blood pressure(GO:0003084) |
| 0.2 |
1.2 |
GO:0001886 |
endothelial cell morphogenesis(GO:0001886) |
| 0.2 |
2.9 |
GO:0070816 |
phosphorylation of RNA polymerase II C-terminal domain(GO:0070816) |
| 0.2 |
1.5 |
GO:0000290 |
deadenylation-dependent decapping of nuclear-transcribed mRNA(GO:0000290) |
| 0.2 |
1.9 |
GO:0000054 |
ribosomal subunit export from nucleus(GO:0000054) ribosome localization(GO:0033750) establishment of ribosome localization(GO:0033753) |
| 0.2 |
0.2 |
GO:0030656 |
regulation of vitamin metabolic process(GO:0030656) |
| 0.2 |
2.1 |
GO:0010866 |
regulation of triglyceride biosynthetic process(GO:0010866) |
| 0.2 |
0.6 |
GO:0010636 |
positive regulation of mitochondrial fusion(GO:0010636) |
| 0.2 |
1.5 |
GO:0036123 |
histone H3-K9 dimethylation(GO:0036123) |
| 0.2 |
7.2 |
GO:0006749 |
glutathione metabolic process(GO:0006749) |
| 0.2 |
0.6 |
GO:2001045 |
closure of optic fissure(GO:0061386) negative regulation of integrin-mediated signaling pathway(GO:2001045) |
| 0.2 |
0.6 |
GO:1903753 |
cortical microtubule organization(GO:0043622) establishment of centrosome localization(GO:0051660) negative regulation of p38MAPK cascade(GO:1903753) |
| 0.2 |
2.2 |
GO:1902692 |
regulation of neuroblast proliferation(GO:1902692) |
| 0.2 |
2.0 |
GO:0001522 |
pseudouridine synthesis(GO:0001522) |
| 0.2 |
1.9 |
GO:0044342 |
type B pancreatic cell proliferation(GO:0044342) |
| 0.2 |
1.1 |
GO:0000083 |
regulation of transcription involved in G1/S transition of mitotic cell cycle(GO:0000083) |
| 0.2 |
0.6 |
GO:0006030 |
chitin metabolic process(GO:0006030) chitin catabolic process(GO:0006032) |
| 0.2 |
0.7 |
GO:1902932 |
positive regulation of alcohol biosynthetic process(GO:1902932) |
| 0.2 |
0.6 |
GO:2000779 |
regulation of double-strand break repair(GO:2000779) |
| 0.2 |
0.6 |
GO:1903846 |
positive regulation of transforming growth factor beta receptor signaling pathway(GO:0030511) positive regulation of cellular response to transforming growth factor beta stimulus(GO:1903846) |
| 0.2 |
0.2 |
GO:0043032 |
positive regulation of macrophage activation(GO:0043032) |
| 0.2 |
0.7 |
GO:1903077 |
negative regulation of protein localization to plasma membrane(GO:1903077) negative regulation of protein localization to cell periphery(GO:1904376) |
| 0.2 |
0.4 |
GO:0032914 |
positive regulation of transforming growth factor beta1 production(GO:0032914) |
| 0.2 |
0.2 |
GO:0008228 |
opsonization(GO:0008228) |
| 0.2 |
1.3 |
GO:0030382 |
sperm mitochondrion organization(GO:0030382) |
| 0.2 |
0.5 |
GO:2000271 |
positive regulation of fibroblast apoptotic process(GO:2000271) |
| 0.2 |
0.4 |
GO:0046666 |
retinal cell programmed cell death(GO:0046666) |
| 0.2 |
1.6 |
GO:0046697 |
decidualization(GO:0046697) |
| 0.2 |
0.2 |
GO:0061484 |
hematopoietic stem cell homeostasis(GO:0061484) |
| 0.2 |
0.4 |
GO:0090135 |
actin filament branching(GO:0090135) |
| 0.2 |
0.7 |
GO:0070837 |
dehydroascorbic acid transport(GO:0070837) |
| 0.2 |
1.1 |
GO:0009396 |
folic acid-containing compound biosynthetic process(GO:0009396) |
| 0.2 |
2.8 |
GO:1901185 |
negative regulation of ERBB signaling pathway(GO:1901185) |
| 0.2 |
0.2 |
GO:0010572 |
positive regulation of platelet activation(GO:0010572) |
| 0.2 |
1.0 |
GO:2001199 |
negative regulation of dendritic cell differentiation(GO:2001199) |
| 0.2 |
0.2 |
GO:0042256 |
mature ribosome assembly(GO:0042256) |
| 0.2 |
0.5 |
GO:0006597 |
spermine biosynthetic process(GO:0006597) |
| 0.2 |
1.9 |
GO:0060394 |
negative regulation of pathway-restricted SMAD protein phosphorylation(GO:0060394) |
| 0.2 |
0.7 |
GO:0042454 |
ribonucleoside catabolic process(GO:0042454) |
| 0.2 |
0.2 |
GO:0050853 |
B cell receptor signaling pathway(GO:0050853) |
| 0.2 |
6.6 |
GO:0050728 |
negative regulation of inflammatory response(GO:0050728) |
| 0.2 |
0.7 |
GO:0000395 |
mRNA 5'-splice site recognition(GO:0000395) |
| 0.2 |
0.5 |
GO:0070166 |
enamel mineralization(GO:0070166) |
| 0.2 |
0.3 |
GO:0070625 |
zymogen granule exocytosis(GO:0070625) |
| 0.2 |
0.3 |
GO:0055070 |
copper ion homeostasis(GO:0055070) |
| 0.2 |
1.2 |
GO:0051639 |
actin filament network formation(GO:0051639) |
| 0.2 |
2.0 |
GO:0042474 |
middle ear morphogenesis(GO:0042474) |
| 0.2 |
0.3 |
GO:1990928 |
response to amino acid starvation(GO:1990928) |
| 0.2 |
0.7 |
GO:0019695 |
choline metabolic process(GO:0019695) |
| 0.2 |
0.3 |
GO:0032695 |
negative regulation of interleukin-12 production(GO:0032695) |
| 0.2 |
0.8 |
GO:0010633 |
negative regulation of epithelial cell migration(GO:0010633) |
| 0.2 |
1.0 |
GO:0007512 |
adult heart development(GO:0007512) |
| 0.2 |
1.7 |
GO:0045899 |
positive regulation of RNA polymerase II transcriptional preinitiation complex assembly(GO:0045899) |
| 0.2 |
7.5 |
GO:0030490 |
maturation of SSU-rRNA(GO:0030490) |
| 0.2 |
2.6 |
GO:0051497 |
negative regulation of stress fiber assembly(GO:0051497) |
| 0.2 |
0.3 |
GO:0036337 |
Fas signaling pathway(GO:0036337) |
| 0.2 |
5.7 |
GO:0000387 |
spliceosomal snRNP assembly(GO:0000387) |
| 0.2 |
3.9 |
GO:0016578 |
histone deubiquitination(GO:0016578) |
| 0.2 |
1.6 |
GO:0002063 |
chondrocyte development(GO:0002063) |
| 0.2 |
1.1 |
GO:0006729 |
tetrahydrobiopterin biosynthetic process(GO:0006729) tetrahydrobiopterin metabolic process(GO:0046146) |
| 0.2 |
0.5 |
GO:0032439 |
endosome localization(GO:0032439) |
| 0.2 |
0.5 |
GO:0001711 |
endodermal cell fate commitment(GO:0001711) |
| 0.2 |
3.1 |
GO:0043171 |
peptide catabolic process(GO:0043171) |
| 0.2 |
1.0 |
GO:1900119 |
positive regulation of execution phase of apoptosis(GO:1900119) |
| 0.2 |
1.1 |
GO:0048251 |
elastic fiber assembly(GO:0048251) |
| 0.2 |
0.8 |
GO:0090074 |
negative regulation of protein homodimerization activity(GO:0090074) |
| 0.2 |
0.3 |
GO:0032202 |
telomere assembly(GO:0032202) |
| 0.2 |
0.5 |
GO:0038018 |
Wnt receptor catabolic process(GO:0038018) |
| 0.2 |
0.8 |
GO:0046548 |
retinal rod cell development(GO:0046548) |
| 0.2 |
1.6 |
GO:0042246 |
tissue regeneration(GO:0042246) |
| 0.2 |
2.7 |
GO:0008156 |
negative regulation of DNA replication(GO:0008156) |
| 0.2 |
2.3 |
GO:0042407 |
cristae formation(GO:0042407) |
| 0.2 |
0.8 |
GO:0034982 |
mitochondrial protein processing(GO:0034982) |
| 0.2 |
2.2 |
GO:0030150 |
protein import into mitochondrial matrix(GO:0030150) |
| 0.2 |
1.7 |
GO:0048384 |
retinoic acid receptor signaling pathway(GO:0048384) |
| 0.2 |
4.4 |
GO:0035567 |
non-canonical Wnt signaling pathway(GO:0035567) |
| 0.2 |
3.9 |
GO:0000027 |
ribosomal large subunit assembly(GO:0000027) |
| 0.2 |
4.2 |
GO:0032728 |
positive regulation of interferon-beta production(GO:0032728) |
| 0.1 |
0.6 |
GO:0005981 |
regulation of glycogen catabolic process(GO:0005981) |
| 0.1 |
0.3 |
GO:0071073 |
positive regulation of phospholipid biosynthetic process(GO:0071073) |
| 0.1 |
0.4 |
GO:0018298 |
protein-chromophore linkage(GO:0018298) |
| 0.1 |
0.3 |
GO:0042590 |
antigen processing and presentation of exogenous peptide antigen via MHC class I(GO:0042590) |
| 0.1 |
0.1 |
GO:0032392 |
DNA geometric change(GO:0032392) DNA duplex unwinding(GO:0032508) |
| 0.1 |
0.1 |
GO:0060290 |
transdifferentiation(GO:0060290) |
| 0.1 |
0.4 |
GO:0006419 |
alanyl-tRNA aminoacylation(GO:0006419) |
| 0.1 |
3.8 |
GO:0005978 |
glycogen biosynthetic process(GO:0005978) glucan biosynthetic process(GO:0009250) |
| 0.1 |
2.0 |
GO:0045600 |
positive regulation of fat cell differentiation(GO:0045600) |
| 0.1 |
0.7 |
GO:0032472 |
Golgi calcium ion transport(GO:0032472) |
| 0.1 |
1.0 |
GO:0006693 |
prostanoid metabolic process(GO:0006692) prostaglandin metabolic process(GO:0006693) |
| 0.1 |
1.3 |
GO:0051570 |
regulation of histone H3-K9 methylation(GO:0051570) |
| 0.1 |
1.3 |
GO:0042753 |
positive regulation of circadian rhythm(GO:0042753) |
| 0.1 |
0.9 |
GO:0046415 |
urate metabolic process(GO:0046415) |
| 0.1 |
0.1 |
GO:1904357 |
negative regulation of telomere maintenance via telomere lengthening(GO:1904357) |
| 0.1 |
0.1 |
GO:0032532 |
regulation of microvillus length(GO:0032532) |
| 0.1 |
0.4 |
GO:0033615 |
mitochondrial proton-transporting ATP synthase complex assembly(GO:0033615) |
| 0.1 |
0.4 |
GO:0090185 |
negative regulation of kidney development(GO:0090185) |
| 0.1 |
1.1 |
GO:0010216 |
maintenance of DNA methylation(GO:0010216) |
| 0.1 |
0.7 |
GO:0042866 |
pyruvate biosynthetic process(GO:0042866) |
| 0.1 |
1.7 |
GO:0000305 |
response to oxygen radical(GO:0000305) |
| 0.1 |
0.4 |
GO:2000983 |
regulation of ATP citrate synthase activity(GO:2000983) negative regulation of ATP citrate synthase activity(GO:2000984) |
| 0.1 |
0.3 |
GO:0060075 |
regulation of resting membrane potential(GO:0060075) |
| 0.1 |
0.3 |
GO:0052695 |
cellular glucuronidation(GO:0052695) |
| 0.1 |
0.4 |
GO:0071294 |
cellular response to zinc ion(GO:0071294) |
| 0.1 |
0.3 |
GO:0050872 |
white fat cell differentiation(GO:0050872) |
| 0.1 |
0.3 |
GO:0050904 |
diapedesis(GO:0050904) |
| 0.1 |
0.4 |
GO:1900025 |
negative regulation of substrate adhesion-dependent cell spreading(GO:1900025) |
| 0.1 |
8.7 |
GO:0010811 |
positive regulation of cell-substrate adhesion(GO:0010811) |
| 0.1 |
0.7 |
GO:0014054 |
positive regulation of gamma-aminobutyric acid secretion(GO:0014054) |
| 0.1 |
0.1 |
GO:0030224 |
monocyte differentiation(GO:0030224) |
| 0.1 |
0.5 |
GO:0019276 |
UDP-N-acetylgalactosamine metabolic process(GO:0019276) |
| 0.1 |
0.8 |
GO:0010172 |
embryonic body morphogenesis(GO:0010172) |
| 0.1 |
0.4 |
GO:0042573 |
retinoic acid metabolic process(GO:0042573) |
| 0.1 |
0.5 |
GO:0006741 |
NADP biosynthetic process(GO:0006741) |
| 0.1 |
1.9 |
GO:0007638 |
mechanosensory behavior(GO:0007638) |
| 0.1 |
0.9 |
GO:0050965 |
detection of temperature stimulus involved in sensory perception(GO:0050961) detection of temperature stimulus involved in sensory perception of pain(GO:0050965) |
| 0.1 |
0.7 |
GO:0006451 |
selenocysteine incorporation(GO:0001514) translational readthrough(GO:0006451) |
| 0.1 |
0.3 |
GO:0007171 |
activation of transmembrane receptor protein tyrosine kinase activity(GO:0007171) |
| 0.1 |
0.8 |
GO:0045907 |
positive regulation of vasoconstriction(GO:0045907) |
| 0.1 |
0.5 |
GO:0008616 |
queuosine biosynthetic process(GO:0008616) queuosine metabolic process(GO:0046116) |
| 0.1 |
0.4 |
GO:0035606 |
peptidyl-cysteine S-trans-nitrosylation(GO:0035606) |
| 0.1 |
0.6 |
GO:0017145 |
stem cell division(GO:0017145) |
| 0.1 |
3.1 |
GO:0006261 |
DNA-dependent DNA replication(GO:0006261) |
| 0.1 |
0.9 |
GO:0032755 |
positive regulation of interleukin-6 production(GO:0032755) |
| 0.1 |
1.0 |
GO:0006398 |
mRNA 3'-end processing by stem-loop binding and cleavage(GO:0006398) |
| 0.1 |
2.9 |
GO:0000413 |
protein peptidyl-prolyl isomerization(GO:0000413) |
| 0.1 |
0.5 |
GO:0031581 |
hemidesmosome assembly(GO:0031581) |
| 0.1 |
17.5 |
GO:0006457 |
protein folding(GO:0006457) |
| 0.1 |
0.6 |
GO:0016576 |
histone dephosphorylation(GO:0016576) |
| 0.1 |
3.6 |
GO:0002066 |
columnar/cuboidal epithelial cell development(GO:0002066) |
| 0.1 |
0.2 |
GO:2000253 |
positive regulation of feeding behavior(GO:2000253) |
| 0.1 |
0.9 |
GO:0071577 |
zinc II ion transmembrane transport(GO:0071577) |
| 0.1 |
0.1 |
GO:0007379 |
segment specification(GO:0007379) |
| 0.1 |
1.0 |
GO:0006122 |
mitochondrial electron transport, ubiquinol to cytochrome c(GO:0006122) |
| 0.1 |
0.4 |
GO:0045671 |
negative regulation of osteoclast differentiation(GO:0045671) |
| 0.1 |
0.4 |
GO:0000350 |
generation of catalytic spliceosome for second transesterification step(GO:0000350) |
| 0.1 |
0.7 |
GO:0015074 |
DNA integration(GO:0015074) |
| 0.1 |
0.5 |
GO:0042501 |
serine phosphorylation of STAT protein(GO:0042501) |
| 0.1 |
1.8 |
GO:0006379 |
mRNA cleavage(GO:0006379) |
| 0.1 |
0.5 |
GO:1990118 |
sodium ion import across plasma membrane(GO:0098719) sodium ion import into cell(GO:1990118) |
| 0.1 |
0.5 |
GO:0007217 |
tachykinin receptor signaling pathway(GO:0007217) |
| 0.1 |
1.4 |
GO:0042558 |
pteridine-containing compound metabolic process(GO:0042558) |
| 0.1 |
0.6 |
GO:0035721 |
intraciliary retrograde transport(GO:0035721) |
| 0.1 |
0.2 |
GO:0035561 |
regulation of chromatin binding(GO:0035561) |
| 0.1 |
1.5 |
GO:0042462 |
eye photoreceptor cell development(GO:0042462) |
| 0.1 |
0.2 |
GO:0051775 |
response to redox state(GO:0051775) |
| 0.1 |
0.5 |
GO:0097428 |
protein maturation by iron-sulfur cluster transfer(GO:0097428) |
| 0.1 |
0.6 |
GO:0098700 |
aminergic neurotransmitter loading into synaptic vesicle(GO:0015842) neurotransmitter loading into synaptic vesicle(GO:0098700) |
| 0.1 |
0.6 |
GO:0075525 |
viral translational termination-reinitiation(GO:0075525) |
| 0.1 |
0.9 |
GO:0035871 |
protein K11-linked deubiquitination(GO:0035871) |
| 0.1 |
0.1 |
GO:0001732 |
formation of cytoplasmic translation initiation complex(GO:0001732) |
| 0.1 |
1.2 |
GO:0051972 |
regulation of telomerase activity(GO:0051972) |
| 0.1 |
0.6 |
GO:0010829 |
negative regulation of glucose transport(GO:0010829) negative regulation of glucose import(GO:0046325) |
| 0.1 |
0.1 |
GO:1903960 |
negative regulation of anion transmembrane transport(GO:1903960) |
| 0.1 |
0.4 |
GO:0010739 |
positive regulation of protein kinase A signaling(GO:0010739) |
| 0.1 |
0.1 |
GO:0036112 |
medium-chain fatty-acyl-CoA metabolic process(GO:0036112) |
| 0.1 |
1.4 |
GO:0044030 |
regulation of DNA methylation(GO:0044030) |
| 0.1 |
0.4 |
GO:2001270 |
regulation of cysteine-type endopeptidase activity involved in execution phase of apoptosis(GO:2001270) |
| 0.1 |
0.1 |
GO:0031953 |
negative regulation of protein autophosphorylation(GO:0031953) |
| 0.1 |
0.2 |
GO:1904872 |
regulation of telomerase RNA localization to Cajal body(GO:1904872) positive regulation of telomerase RNA localization to Cajal body(GO:1904874) |
| 0.1 |
1.1 |
GO:0070940 |
dephosphorylation of RNA polymerase II C-terminal domain(GO:0070940) |
| 0.1 |
0.9 |
GO:0061157 |
mRNA destabilization(GO:0061157) |
| 0.1 |
0.1 |
GO:0033084 |
immature T cell proliferation in thymus(GO:0033080) regulation of immature T cell proliferation in thymus(GO:0033084) |
| 0.1 |
0.8 |
GO:0071447 |
cellular response to hydroperoxide(GO:0071447) |
| 0.1 |
0.5 |
GO:0046467 |
membrane lipid biosynthetic process(GO:0046467) |
| 0.1 |
0.4 |
GO:1902993 |
positive regulation of beta-amyloid formation(GO:1902004) positive regulation of amyloid precursor protein catabolic process(GO:1902993) |
| 0.1 |
0.5 |
GO:0060765 |
regulation of androgen receptor signaling pathway(GO:0060765) |
| 0.1 |
0.9 |
GO:0001731 |
formation of translation preinitiation complex(GO:0001731) |
| 0.1 |
0.8 |
GO:0033273 |
response to vitamin(GO:0033273) |
| 0.1 |
3.2 |
GO:0042168 |
heme metabolic process(GO:0042168) |
| 0.1 |
5.0 |
GO:0002181 |
cytoplasmic translation(GO:0002181) |
| 0.1 |
0.5 |
GO:0071044 |
histone mRNA catabolic process(GO:0071044) |
| 0.1 |
0.1 |
GO:0061511 |
centriole elongation(GO:0061511) |
| 0.1 |
0.2 |
GO:0061101 |
neuroendocrine cell differentiation(GO:0061101) |
| 0.1 |
0.2 |
GO:0006354 |
DNA-templated transcription, elongation(GO:0006354) |
| 0.1 |
6.3 |
GO:0045727 |
positive regulation of translation(GO:0045727) |
| 0.1 |
1.8 |
GO:0031365 |
N-terminal protein amino acid modification(GO:0031365) |
| 0.1 |
0.3 |
GO:0060836 |
lymphatic endothelial cell differentiation(GO:0060836) |
| 0.1 |
0.1 |
GO:0031272 |
regulation of pseudopodium assembly(GO:0031272) |
| 0.1 |
0.5 |
GO:0060159 |
regulation of dopamine receptor signaling pathway(GO:0060159) |
| 0.1 |
0.1 |
GO:0040037 |
negative regulation of fibroblast growth factor receptor signaling pathway(GO:0040037) |
| 0.1 |
0.8 |
GO:0036037 |
CD8-positive, alpha-beta T cell activation(GO:0036037) |
| 0.1 |
0.4 |
GO:0072673 |
lamellipodium morphogenesis(GO:0072673) |
| 0.1 |
1.9 |
GO:2001238 |
positive regulation of extrinsic apoptotic signaling pathway(GO:2001238) |
| 0.1 |
0.5 |
GO:0001842 |
neural fold formation(GO:0001842) |
| 0.1 |
0.5 |
GO:0070126 |
mitochondrial translational termination(GO:0070126) |
| 0.1 |
0.5 |
GO:0042997 |
negative regulation of Golgi to plasma membrane protein transport(GO:0042997) |
| 0.1 |
1.7 |
GO:0019731 |
antibacterial humoral response(GO:0019731) |
| 0.1 |
0.1 |
GO:0070091 |
glucagon secretion(GO:0070091) |
| 0.1 |
1.5 |
GO:0030865 |
cortical cytoskeleton organization(GO:0030865) |
| 0.1 |
0.6 |
GO:0030579 |
ubiquitin-dependent SMAD protein catabolic process(GO:0030579) |
| 0.1 |
0.6 |
GO:0051131 |
chaperone-mediated protein complex assembly(GO:0051131) |
| 0.1 |
0.1 |
GO:0042359 |
vitamin D metabolic process(GO:0042359) |
| 0.1 |
0.4 |
GO:0060539 |
diaphragm development(GO:0060539) |
| 0.1 |
2.0 |
GO:0035019 |
somatic stem cell population maintenance(GO:0035019) |
| 0.1 |
0.9 |
GO:2000381 |
negative regulation of mesoderm development(GO:2000381) |
| 0.1 |
0.3 |
GO:0045204 |
MAPK export from nucleus(GO:0045204) |
| 0.1 |
0.4 |
GO:0016480 |
negative regulation of transcription from RNA polymerase III promoter(GO:0016480) |
| 0.1 |
0.2 |
GO:0035457 |
cellular response to interferon-alpha(GO:0035457) |
| 0.1 |
0.6 |
GO:0009649 |
entrainment of circadian clock(GO:0009649) |
| 0.1 |
0.2 |
GO:1902513 |
regulation of organelle transport along microtubule(GO:1902513) |
| 0.1 |
0.6 |
GO:0035036 |
binding of sperm to zona pellucida(GO:0007339) sperm-egg recognition(GO:0035036) |
| 0.1 |
0.4 |
GO:0030042 |
actin filament depolymerization(GO:0030042) |
| 0.1 |
0.3 |
GO:0070127 |
tRNA aminoacylation for mitochondrial protein translation(GO:0070127) |
| 0.1 |
0.1 |
GO:0042271 |
susceptibility to natural killer cell mediated cytotoxicity(GO:0042271) |
| 0.1 |
0.2 |
GO:0045059 |
positive thymic T cell selection(GO:0045059) |
| 0.1 |
0.4 |
GO:0060612 |
adipose tissue development(GO:0060612) |
| 0.1 |
0.1 |
GO:0071726 |
response to diacyl bacterial lipopeptide(GO:0071724) cellular response to diacyl bacterial lipopeptide(GO:0071726) |
| 0.1 |
0.4 |
GO:0006968 |
cellular defense response(GO:0006968) |
| 0.1 |
0.7 |
GO:0006301 |
postreplication repair(GO:0006301) |
| 0.1 |
0.2 |
GO:0043501 |
regulation of skeletal muscle adaptation(GO:0014733) skeletal muscle adaptation(GO:0043501) |
| 0.1 |
0.1 |
GO:0060693 |
regulation of branching involved in salivary gland morphogenesis(GO:0060693) |
| 0.1 |
0.8 |
GO:0030513 |
positive regulation of BMP signaling pathway(GO:0030513) |
| 0.1 |
0.4 |
GO:0006048 |
UDP-N-acetylglucosamine biosynthetic process(GO:0006048) |
| 0.1 |
0.3 |
GO:0036035 |
osteoclast development(GO:0036035) |
| 0.1 |
0.1 |
GO:0070966 |
nuclear-transcribed mRNA catabolic process, no-go decay(GO:0070966) |
| 0.1 |
0.3 |
GO:0051182 |
coenzyme transport(GO:0051182) |
| 0.1 |
0.2 |
GO:0006547 |
histidine metabolic process(GO:0006547) |
| 0.1 |
0.4 |
GO:0006307 |
DNA dealkylation involved in DNA repair(GO:0006307) oxidative demethylation(GO:0070989) |
| 0.1 |
1.0 |
GO:0001937 |
negative regulation of endothelial cell proliferation(GO:0001937) |
| 0.1 |
0.1 |
GO:0002322 |
B cell proliferation involved in immune response(GO:0002322) |
| 0.1 |
0.2 |
GO:2000574 |
regulation of microtubule motor activity(GO:2000574) |
| 0.1 |
1.1 |
GO:0016180 |
snRNA processing(GO:0016180) |
| 0.1 |
0.2 |
GO:0009298 |
GDP-mannose biosynthetic process(GO:0009298) |
| 0.1 |
0.4 |
GO:0019886 |
antigen processing and presentation of exogenous peptide antigen via MHC class II(GO:0019886) |
| 0.1 |
0.1 |
GO:2000189 |
positive regulation of cholesterol homeostasis(GO:2000189) |
| 0.1 |
1.6 |
GO:0006024 |
glycosaminoglycan biosynthetic process(GO:0006024) |
| 0.1 |
0.5 |
GO:0000002 |
mitochondrial genome maintenance(GO:0000002) |
| 0.1 |
0.5 |
GO:0035337 |
fatty-acyl-CoA metabolic process(GO:0035337) |
| 0.1 |
0.7 |
GO:0010826 |
negative regulation of centrosome duplication(GO:0010826) negative regulation of centrosome cycle(GO:0046606) |
| 0.1 |
0.4 |
GO:0045540 |
regulation of cholesterol biosynthetic process(GO:0045540) |
| 0.1 |
0.2 |
GO:0060712 |
spongiotrophoblast layer development(GO:0060712) |
| 0.1 |
0.2 |
GO:0006448 |
regulation of translational elongation(GO:0006448) |
| 0.1 |
1.9 |
GO:0000184 |
nuclear-transcribed mRNA catabolic process, nonsense-mediated decay(GO:0000184) |
| 0.1 |
0.2 |
GO:0061724 |
lipophagy(GO:0061724) |
| 0.1 |
0.1 |
GO:1902035 |
regulation of hematopoietic stem cell proliferation(GO:1902033) positive regulation of hematopoietic stem cell proliferation(GO:1902035) |
| 0.1 |
1.4 |
GO:0006641 |
triglyceride metabolic process(GO:0006641) |
| 0.1 |
0.2 |
GO:0043046 |
DNA methylation involved in gamete generation(GO:0043046) |
| 0.1 |
0.3 |
GO:1904714 |
chaperone-mediated autophagy(GO:0061684) regulation of chaperone-mediated autophagy(GO:1904714) negative regulation of chaperone-mediated autophagy(GO:1904715) |
| 0.1 |
0.6 |
GO:0035269 |
protein O-linked mannosylation(GO:0035269) |
| 0.1 |
0.4 |
GO:0061002 |
negative regulation of dendritic spine morphogenesis(GO:0061002) |
| 0.1 |
0.4 |
GO:0097034 |
mitochondrial respiratory chain complex IV assembly(GO:0033617) mitochondrial respiratory chain complex IV biogenesis(GO:0097034) |
| 0.1 |
0.5 |
GO:0006107 |
oxaloacetate metabolic process(GO:0006107) |
| 0.1 |
0.2 |
GO:0043312 |
neutrophil degranulation(GO:0043312) |
| 0.1 |
0.6 |
GO:0032786 |
positive regulation of DNA-templated transcription, elongation(GO:0032786) |
| 0.1 |
0.4 |
GO:0032648 |
regulation of interferon-beta production(GO:0032648) |
| 0.1 |
0.1 |
GO:0014866 |
skeletal myofibril assembly(GO:0014866) |
| 0.1 |
0.1 |
GO:1902369 |
negative regulation of RNA catabolic process(GO:1902369) |
| 0.1 |
0.8 |
GO:0015693 |
magnesium ion transport(GO:0015693) |
| 0.1 |
0.7 |
GO:0006471 |
protein ADP-ribosylation(GO:0006471) |
| 0.1 |
5.4 |
GO:0051028 |
mRNA transport(GO:0051028) |
| 0.1 |
1.0 |
GO:0032981 |
NADH dehydrogenase complex assembly(GO:0010257) mitochondrial respiratory chain complex I assembly(GO:0032981) mitochondrial respiratory chain complex I biogenesis(GO:0097031) |
| 0.1 |
0.4 |
GO:0006098 |
pentose-phosphate shunt(GO:0006098) glyceraldehyde-3-phosphate metabolic process(GO:0019682) |
| 0.1 |
0.8 |
GO:0090129 |
positive regulation of synapse maturation(GO:0090129) |
| 0.1 |
0.3 |
GO:0060766 |
negative regulation of androgen receptor signaling pathway(GO:0060766) |
| 0.1 |
0.9 |
GO:0010388 |
protein deneddylation(GO:0000338) cullin deneddylation(GO:0010388) |
| 0.1 |
0.1 |
GO:0016340 |
calcium-dependent cell-matrix adhesion(GO:0016340) |
| 0.1 |
0.2 |
GO:0046292 |
formaldehyde metabolic process(GO:0046292) |
| 0.1 |
0.3 |
GO:0070935 |
3'-UTR-mediated mRNA stabilization(GO:0070935) |
| 0.1 |
0.3 |
GO:0070327 |
thyroid hormone transport(GO:0070327) |
| 0.1 |
0.7 |
GO:0033327 |
Leydig cell differentiation(GO:0033327) |
| 0.1 |
0.2 |
GO:0008215 |
spermine metabolic process(GO:0008215) |
| 0.1 |
0.1 |
GO:1903020 |
positive regulation of glycoprotein metabolic process(GO:1903020) |
| 0.1 |
0.2 |
GO:0006420 |
arginyl-tRNA aminoacylation(GO:0006420) |
| 0.1 |
0.5 |
GO:0042182 |
ketone catabolic process(GO:0042182) |
| 0.1 |
0.2 |
GO:0000188 |
inactivation of MAPK activity(GO:0000188) |
| 0.1 |
0.1 |
GO:0045086 |
positive regulation of interleukin-2 biosynthetic process(GO:0045086) |
| 0.1 |
0.2 |
GO:0015886 |
heme transport(GO:0015886) |
| 0.1 |
0.4 |
GO:0046716 |
muscle cell cellular homeostasis(GO:0046716) |
| 0.1 |
0.3 |
GO:0006488 |
dolichol-linked oligosaccharide biosynthetic process(GO:0006488) |
| 0.1 |
0.3 |
GO:0051697 |
protein delipidation(GO:0051697) |
| 0.1 |
0.1 |
GO:0071492 |
cellular response to UV-A(GO:0071492) |
| 0.1 |
0.3 |
GO:0060040 |
retinal bipolar neuron differentiation(GO:0060040) |
| 0.1 |
0.2 |
GO:0070589 |
cell wall mannoprotein biosynthetic process(GO:0000032) mannoprotein metabolic process(GO:0006056) mannoprotein biosynthetic process(GO:0006057) cell wall glycoprotein biosynthetic process(GO:0031506) cell wall biogenesis(GO:0042546) cell wall macromolecule metabolic process(GO:0044036) cell wall macromolecule biosynthetic process(GO:0044038) chain elongation of O-linked mannose residue(GO:0044845) cellular component macromolecule biosynthetic process(GO:0070589) cell wall organization or biogenesis(GO:0071554) |
| 0.1 |
0.1 |
GO:0042940 |
D-amino acid transport(GO:0042940) |
| 0.1 |
0.7 |
GO:0000578 |
embryonic axis specification(GO:0000578) |
| 0.1 |
0.1 |
GO:0036499 |
PERK-mediated unfolded protein response(GO:0036499) |
| 0.1 |
0.2 |
GO:0046077 |
dUDP biosynthetic process(GO:0006227) pyrimidine nucleoside diphosphate metabolic process(GO:0009138) pyrimidine nucleoside diphosphate biosynthetic process(GO:0009139) pyrimidine deoxyribonucleoside diphosphate metabolic process(GO:0009196) pyrimidine deoxyribonucleoside diphosphate biosynthetic process(GO:0009197) dUDP metabolic process(GO:0046077) |
| 0.1 |
0.1 |
GO:0070303 |
negative regulation of stress-activated MAPK cascade(GO:0032873) negative regulation of stress-activated protein kinase signaling cascade(GO:0070303) |
| 0.1 |
0.2 |
GO:0007007 |
inner mitochondrial membrane organization(GO:0007007) |
| 0.1 |
1.1 |
GO:0070206 |
protein trimerization(GO:0070206) |
| 0.0 |
0.9 |
GO:0002474 |
antigen processing and presentation of peptide antigen via MHC class I(GO:0002474) |
| 0.0 |
0.1 |
GO:0016446 |
somatic hypermutation of immunoglobulin genes(GO:0016446) |
| 0.0 |
0.5 |
GO:0042472 |
inner ear morphogenesis(GO:0042472) |
| 0.0 |
0.2 |
GO:0044783 |
G1 DNA damage checkpoint(GO:0044783) |
| 0.0 |
0.3 |
GO:0000460 |
maturation of 5.8S rRNA(GO:0000460) |
| 0.0 |
0.2 |
GO:0090527 |
actin filament reorganization(GO:0090527) |
| 0.0 |
0.1 |
GO:1903025 |
regulation of RNA polymerase II regulatory region sequence-specific DNA binding(GO:1903025) |
| 0.0 |
0.9 |
GO:0034314 |
Arp2/3 complex-mediated actin nucleation(GO:0034314) |
| 0.0 |
0.9 |
GO:0046825 |
regulation of protein export from nucleus(GO:0046825) |
| 0.0 |
0.1 |
GO:0045053 |
protein retention in Golgi apparatus(GO:0045053) |
| 0.0 |
0.1 |
GO:0032790 |
ribosome disassembly(GO:0032790) |
| 0.0 |
0.2 |
GO:0031076 |
embryonic camera-type eye development(GO:0031076) |
| 0.0 |
5.9 |
GO:0007067 |
mitotic nuclear division(GO:0007067) |
| 0.0 |
0.1 |
GO:0032053 |
ciliary basal body organization(GO:0032053) |
| 0.0 |
0.7 |
GO:0006073 |
glycogen metabolic process(GO:0005977) cellular glucan metabolic process(GO:0006073) glucan metabolic process(GO:0044042) |
| 0.0 |
0.3 |
GO:0034498 |
early endosome to Golgi transport(GO:0034498) |
| 0.0 |
0.1 |
GO:0000715 |
nucleotide-excision repair, DNA damage recognition(GO:0000715) |
| 0.0 |
1.0 |
GO:0032011 |
ARF protein signal transduction(GO:0032011) regulation of ARF protein signal transduction(GO:0032012) |
| 0.0 |
0.2 |
GO:0070162 |
adiponectin secretion(GO:0070162) regulation of adiponectin secretion(GO:0070163) negative regulation of adiponectin secretion(GO:0070164) |
| 0.0 |
0.0 |
GO:0045583 |
regulation of cytotoxic T cell differentiation(GO:0045583) positive regulation of cytotoxic T cell differentiation(GO:0045585) |
| 0.0 |
1.6 |
GO:0006506 |
GPI anchor biosynthetic process(GO:0006506) |
| 0.0 |
0.2 |
GO:0060674 |
placenta blood vessel development(GO:0060674) |
| 0.0 |
0.1 |
GO:0036336 |
dendritic cell migration(GO:0036336) |
| 0.0 |
0.2 |
GO:0019919 |
peptidyl-arginine methylation, to asymmetrical-dimethyl arginine(GO:0019919) peptidyl-arginine N-methylation(GO:0035246) peptidyl-arginine omega-N-methylation(GO:0035247) |
| 0.0 |
0.0 |
GO:0010712 |
regulation of collagen metabolic process(GO:0010712) |
| 0.0 |
0.1 |
GO:0000059 |
protein import into nucleus, docking(GO:0000059) |
| 0.0 |
0.6 |
GO:0003009 |
skeletal muscle contraction(GO:0003009) |
| 0.0 |
0.1 |
GO:0045047 |
protein targeting to ER(GO:0045047) |
| 0.0 |
0.1 |
GO:0051490 |
negative regulation of filopodium assembly(GO:0051490) |
| 0.0 |
0.2 |
GO:1902042 |
negative regulation of extrinsic apoptotic signaling pathway via death domain receptors(GO:1902042) |
| 0.0 |
0.1 |
GO:0001773 |
myeloid dendritic cell activation(GO:0001773) |
| 0.0 |
0.1 |
GO:0070886 |
positive regulation of calcineurin-NFAT signaling cascade(GO:0070886) |
| 0.0 |
0.0 |
GO:0071034 |
CUT catabolic process(GO:0071034) CUT metabolic process(GO:0071043) |
| 0.0 |
0.2 |
GO:0015884 |
folic acid transport(GO:0015884) |
| 0.0 |
0.2 |
GO:0090385 |
phagosome-lysosome fusion(GO:0090385) |
| 0.0 |
0.1 |
GO:0001831 |
trophectodermal cellular morphogenesis(GO:0001831) |
| 0.0 |
0.1 |
GO:0070849 |
response to epidermal growth factor(GO:0070849) |
| 0.0 |
0.3 |
GO:0045494 |
photoreceptor cell maintenance(GO:0045494) |
| 0.0 |
0.2 |
GO:0000289 |
nuclear-transcribed mRNA poly(A) tail shortening(GO:0000289) |
| 0.0 |
0.1 |
GO:0009410 |
response to xenobiotic stimulus(GO:0009410) |
| 0.0 |
0.0 |
GO:0033700 |
phospholipid efflux(GO:0033700) |
| 0.0 |
0.1 |
GO:0030576 |
Cajal body organization(GO:0030576) |
| 0.0 |
0.1 |
GO:0097502 |
protein mannosylation(GO:0035268) mannosylation(GO:0097502) |
| 0.0 |
1.3 |
GO:0009060 |
aerobic respiration(GO:0009060) |
| 0.0 |
0.1 |
GO:0097011 |
cellular response to granulocyte macrophage colony-stimulating factor stimulus(GO:0097011) |
| 0.0 |
0.2 |
GO:0034453 |
microtubule anchoring(GO:0034453) |
| 0.0 |
0.2 |
GO:0031468 |
nuclear envelope reassembly(GO:0031468) |
| 0.0 |
0.2 |
GO:0097006 |
regulation of plasma lipoprotein particle levels(GO:0097006) |
| 0.0 |
0.1 |
GO:0019065 |
receptor-mediated endocytosis of virus by host cell(GO:0019065) endocytosis involved in viral entry into host cell(GO:0075509) |
| 0.0 |
0.1 |
GO:0030330 |
DNA damage response, signal transduction by p53 class mediator(GO:0030330) |
| 0.0 |
0.8 |
GO:0051225 |
spindle assembly(GO:0051225) |
| 0.0 |
0.1 |
GO:0042790 |
transcription of nuclear large rRNA transcript from RNA polymerase I promoter(GO:0042790) |
| 0.0 |
0.0 |
GO:0061502 |
early endosome to recycling endosome transport(GO:0061502) |
| 0.0 |
0.2 |
GO:2000179 |
positive regulation of neural precursor cell proliferation(GO:2000179) |
| 0.0 |
0.2 |
GO:0048806 |
genitalia development(GO:0048806) |
| 0.0 |
0.1 |
GO:0035590 |
purinergic nucleotide receptor signaling pathway(GO:0035590) |
| 0.0 |
0.1 |
GO:0090103 |
cochlea morphogenesis(GO:0090103) |
| 0.0 |
0.2 |
GO:0060009 |
Sertoli cell development(GO:0060009) |
| 0.0 |
0.3 |
GO:0045662 |
negative regulation of myoblast differentiation(GO:0045662) |
| 0.0 |
0.0 |
GO:0010452 |
histone H3-K36 methylation(GO:0010452) |
| 0.0 |
0.3 |
GO:0006378 |
mRNA polyadenylation(GO:0006378) |
| 0.0 |
0.1 |
GO:0007398 |
ectoderm development(GO:0007398) |
| 0.0 |
0.2 |
GO:0040018 |
positive regulation of multicellular organism growth(GO:0040018) |
| 0.0 |
0.1 |
GO:0060351 |
cartilage development involved in endochondral bone morphogenesis(GO:0060351) |
| 0.0 |
0.2 |
GO:0070536 |
protein K63-linked deubiquitination(GO:0070536) |
| 0.0 |
0.1 |
GO:0010666 |
positive regulation of striated muscle cell apoptotic process(GO:0010663) positive regulation of cardiac muscle cell apoptotic process(GO:0010666) |
| 0.0 |
0.1 |
GO:0001895 |
retina homeostasis(GO:0001895) |
| 0.0 |
0.0 |
GO:0070932 |
histone H3 deacetylation(GO:0070932) |
| 0.0 |
0.0 |
GO:0036342 |
post-anal tail morphogenesis(GO:0036342) |
| 0.0 |
0.0 |
GO:0038028 |
insulin receptor signaling pathway via phosphatidylinositol 3-kinase(GO:0038028) |
| 0.0 |
0.1 |
GO:0051790 |
short-chain fatty acid biosynthetic process(GO:0051790) |
| 0.0 |
0.8 |
GO:0006664 |
glycolipid metabolic process(GO:0006664) liposaccharide metabolic process(GO:1903509) |
| 0.0 |
0.4 |
GO:0006446 |
regulation of translational initiation(GO:0006446) |
| 0.0 |
0.1 |
GO:0006103 |
2-oxoglutarate metabolic process(GO:0006103) |
| 0.0 |
0.1 |
GO:0090271 |
positive regulation of fibroblast growth factor production(GO:0090271) |
| 0.0 |
0.0 |
GO:0097274 |
urea homeostasis(GO:0097274) |
| 0.0 |
0.0 |
GO:0071594 |
T cell differentiation in thymus(GO:0033077) thymocyte aggregation(GO:0071594) |
| 0.0 |
0.1 |
GO:0021983 |
pituitary gland development(GO:0021983) |
| 0.0 |
0.5 |
GO:0010501 |
RNA secondary structure unwinding(GO:0010501) |
| 0.0 |
0.1 |
GO:0046889 |
positive regulation of lipid biosynthetic process(GO:0046889) |
| 0.0 |
0.1 |
GO:0090502 |
RNA phosphodiester bond hydrolysis, endonucleolytic(GO:0090502) |
| 0.0 |
0.2 |
GO:0060325 |
face morphogenesis(GO:0060325) |
| 0.0 |
0.0 |
GO:0042226 |
interleukin-6 biosynthetic process(GO:0042226) regulation of interleukin-6 biosynthetic process(GO:0045408) |
| 0.0 |
0.5 |
GO:0006633 |
fatty acid biosynthetic process(GO:0006633) |
| 0.0 |
0.2 |
GO:0006631 |
fatty acid metabolic process(GO:0006631) |
| 0.0 |
0.0 |
GO:0006544 |
glycine metabolic process(GO:0006544) |
| 0.0 |
0.1 |
GO:0010842 |
retina layer formation(GO:0010842) |
| 0.0 |
0.0 |
GO:0019441 |
tryptophan catabolic process(GO:0006569) tryptophan catabolic process to kynurenine(GO:0019441) indole-containing compound catabolic process(GO:0042436) indolalkylamine catabolic process(GO:0046218) kynurenine metabolic process(GO:0070189) |
| 0.0 |
0.1 |
GO:0052646 |
alditol phosphate metabolic process(GO:0052646) |
| 0.0 |
0.0 |
GO:0042989 |
sequestering of actin monomers(GO:0042989) |
| 0.0 |
0.2 |
GO:2001022 |
positive regulation of response to DNA damage stimulus(GO:2001022) |
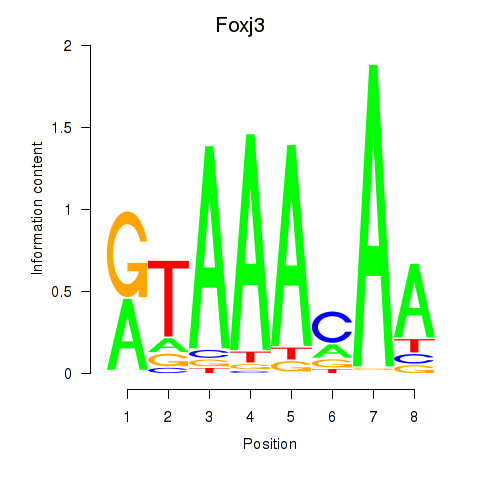
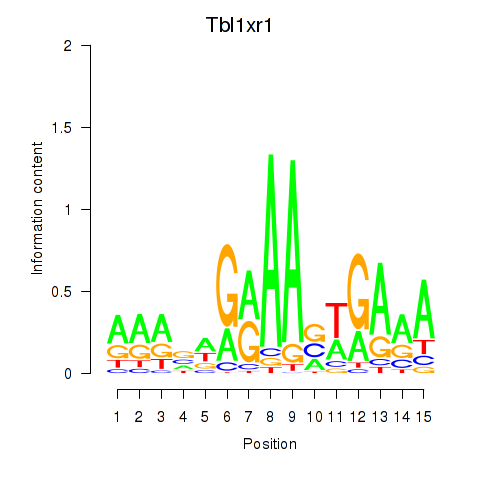
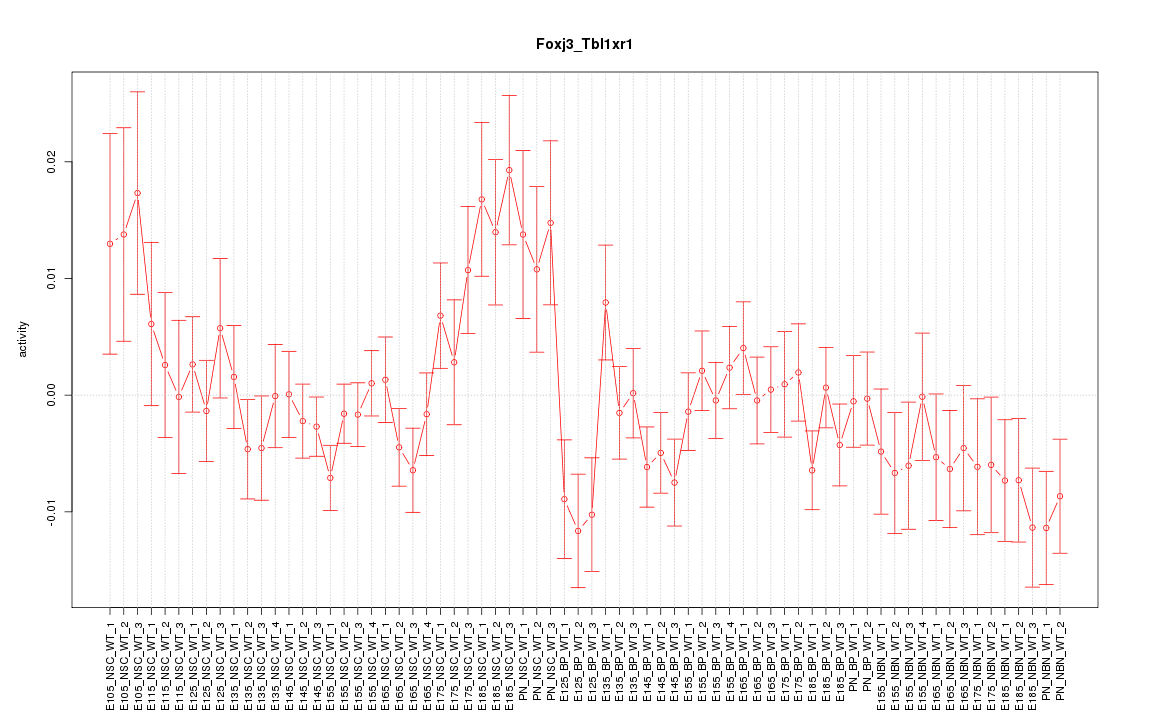
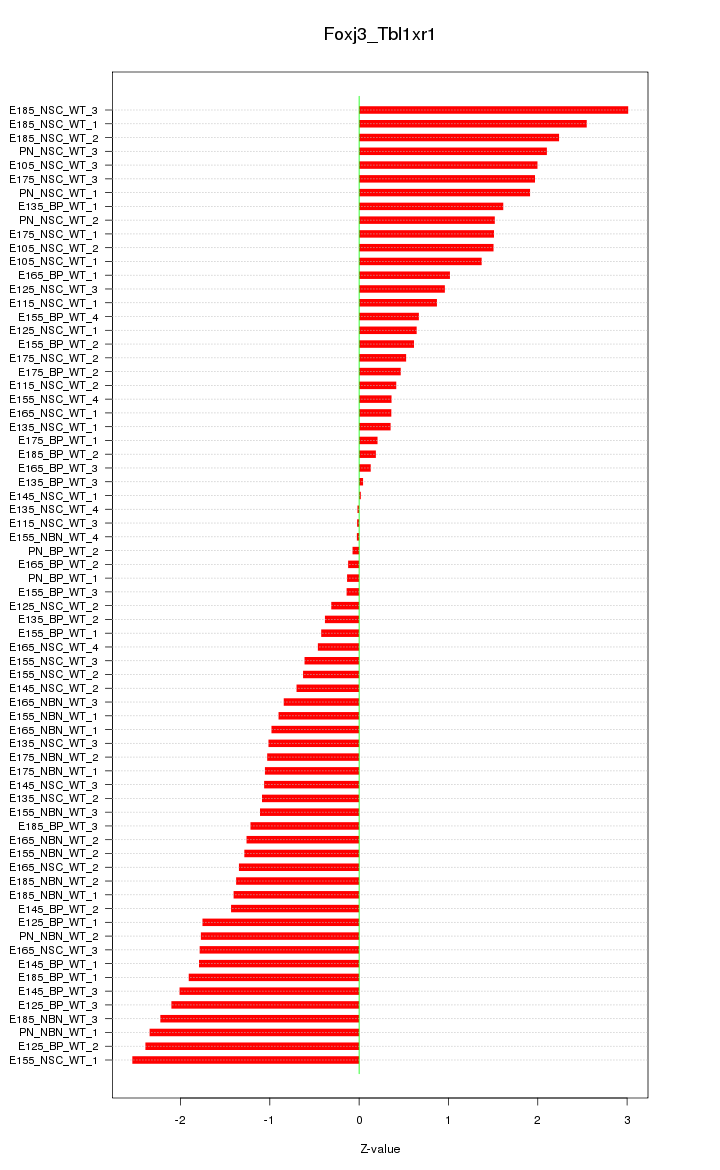

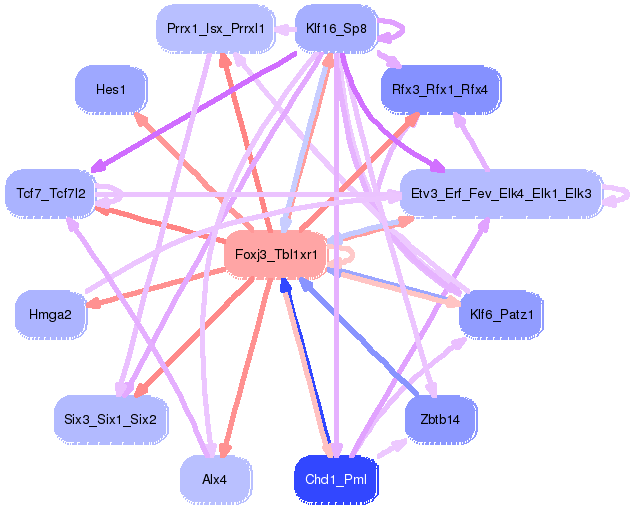