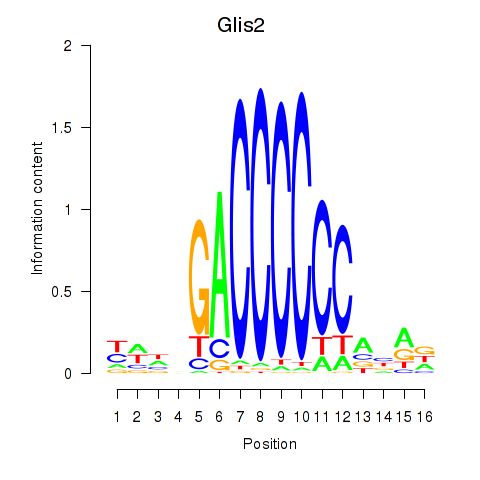
Motif ID: Glis2
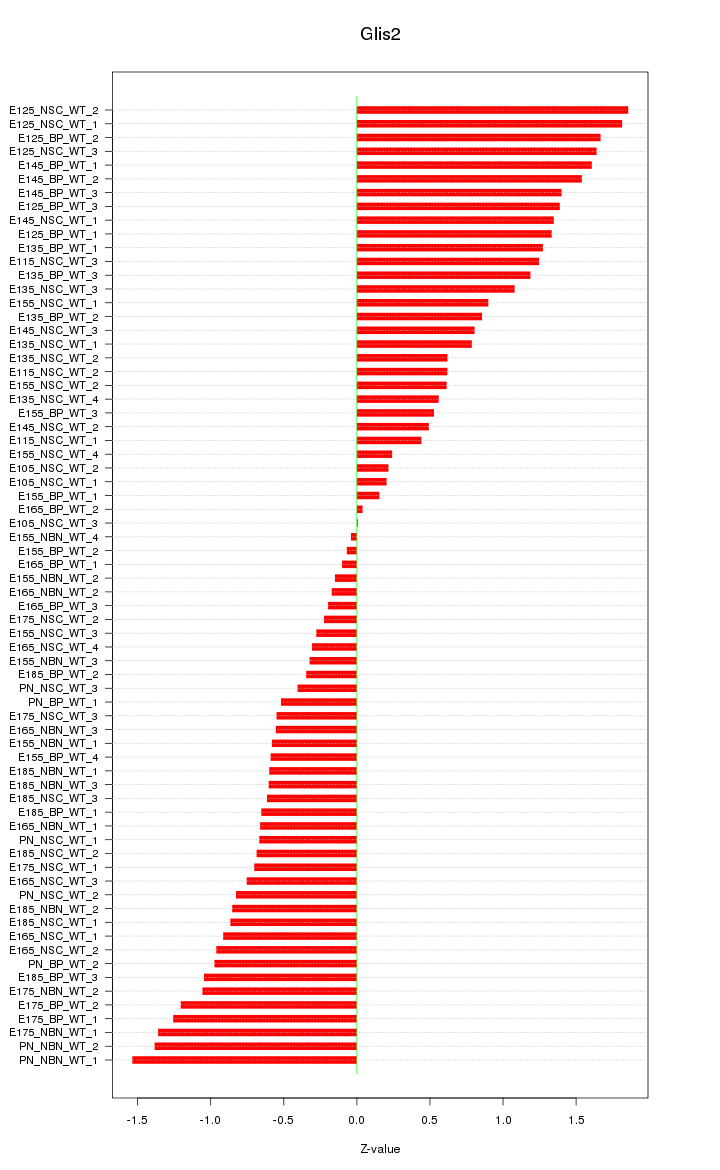
Z-value: 0.910
Transcription factors associated with Glis2:
| Gene Symbol | Entrez ID | Gene Name |
|---|---|---|
| Glis2 | ENSMUSG00000014303.7 | Glis2 |
Activity-expression correlation:
| Gene Symbol | Promoter | Pearson corr. coef. | P-value | Plot |
|---|---|---|---|---|
| Glis2 | mm10_v2_chr16_+_4594683_4594735 | 0.25 | 3.4e-02 | Click! |

Top targets:
Gene overrepresentation in biological_process category:
| Log-likelihood per target | Total log-likelihood | Term | Description |
|---|---|---|---|
| 3.0 | 20.8 | GO:2001199 | negative regulation of dendritic cell differentiation(GO:2001199) |
| 1.7 | 8.5 | GO:0015671 | oxygen transport(GO:0015671) |
| 1.6 | 20.4 | GO:0048672 | positive regulation of collateral sprouting(GO:0048672) |
| 1.1 | 4.6 | GO:0051866 | general adaptation syndrome(GO:0051866) |
| 1.1 | 5.4 | GO:0021905 | pancreatic A cell development(GO:0003322) forebrain-midbrain boundary formation(GO:0021905) somatic motor neuron fate commitment(GO:0021917) regulation of transcription from RNA polymerase II promoter involved in somatic motor neuron fate commitment(GO:0021918) positive regulation of cell fate specification(GO:0042660) |
| 1.1 | 4.3 | GO:1904565 | response to 1-oleoyl-sn-glycerol 3-phosphate(GO:1904565) cellular response to 1-oleoyl-sn-glycerol 3-phosphate(GO:1904566) |
| 0.9 | 2.8 | GO:0072070 | establishment or maintenance of polarity of embryonic epithelium(GO:0016332) loop of Henle development(GO:0072070) metanephric loop of Henle development(GO:0072236) |
| 0.9 | 2.7 | GO:0010752 | negative regulation of antigen processing and presentation(GO:0002578) negative regulation of nitric oxide mediated signal transduction(GO:0010751) regulation of cGMP-mediated signaling(GO:0010752) negative regulation of plasminogen activation(GO:0010757) |
| 0.7 | 3.6 | GO:0070345 | negative regulation of fat cell proliferation(GO:0070345) |
| 0.7 | 2.0 | GO:1902037 | positive regulation of transcription from RNA polymerase II promoter in response to oxidative stress(GO:0036091) negative regulation of hematopoietic stem cell differentiation(GO:1902037) |
| 0.6 | 1.9 | GO:0060129 | thyroid-stimulating hormone-secreting cell differentiation(GO:0060129) |
| 0.6 | 1.9 | GO:0045085 | negative regulation of interleukin-2 biosynthetic process(GO:0045085) |
| 0.6 | 6.2 | GO:0048742 | regulation of skeletal muscle fiber development(GO:0048742) |
| 0.6 | 3.0 | GO:0040032 | post-embryonic body morphogenesis(GO:0040032) |
| 0.6 | 3.5 | GO:0032796 | uropod organization(GO:0032796) |
| 0.5 | 3.8 | GO:0001842 | neural fold formation(GO:0001842) |
| 0.5 | 5.2 | GO:0030388 | fructose 1,6-bisphosphate metabolic process(GO:0030388) |
| 0.5 | 4.2 | GO:0015074 | DNA integration(GO:0015074) |
| 0.5 | 2.1 | GO:0035606 | peptidyl-cysteine S-trans-nitrosylation(GO:0035606) |
| 0.5 | 2.3 | GO:0035984 | response to trichostatin A(GO:0035983) cellular response to trichostatin A(GO:0035984) |
| 0.5 | 5.0 | GO:0021796 | cerebral cortex regionalization(GO:0021796) |
| 0.4 | 1.3 | GO:0010899 | regulation of phosphatidylcholine catabolic process(GO:0010899) |
| 0.4 | 1.7 | GO:0046552 | eye photoreceptor cell fate commitment(GO:0042706) photoreceptor cell fate commitment(GO:0046552) retinal rod cell differentiation(GO:0060221) |
| 0.4 | 1.7 | GO:0046898 | response to cycloheximide(GO:0046898) |
| 0.4 | 4.2 | GO:0001675 | acrosome assembly(GO:0001675) |
| 0.4 | 1.2 | GO:0060217 | hemangioblast cell differentiation(GO:0060217) |
| 0.4 | 3.6 | GO:0045040 | protein import into mitochondrial outer membrane(GO:0045040) negative regulation of protein folding(GO:1903333) |
| 0.4 | 1.1 | GO:0001978 | regulation of systemic arterial blood pressure by carotid sinus baroreceptor feedback(GO:0001978) |
| 0.3 | 1.6 | GO:0075525 | viral translational termination-reinitiation(GO:0075525) |
| 0.3 | 3.0 | GO:0006012 | galactose metabolic process(GO:0006012) |
| 0.3 | 2.6 | GO:0045198 | establishment of epithelial cell apical/basal polarity(GO:0045198) |
| 0.3 | 1.3 | GO:0014886 | transition between slow and fast fiber(GO:0014886) |
| 0.3 | 0.8 | GO:0070844 | misfolded protein transport(GO:0070843) polyubiquitinated protein transport(GO:0070844) polyubiquitinated misfolded protein transport(GO:0070845) Hsp90 deacetylation(GO:0070846) |
| 0.3 | 2.3 | GO:0018230 | peptidyl-L-cysteine S-palmitoylation(GO:0018230) peptidyl-S-diacylglycerol-L-cysteine biosynthetic process from peptidyl-cysteine(GO:0018231) |
| 0.2 | 1.2 | GO:0021914 | negative regulation of smoothened signaling pathway involved in ventral spinal cord patterning(GO:0021914) |
| 0.2 | 0.7 | GO:2000620 | positive regulation of histone H4-K16 acetylation(GO:2000620) |
| 0.2 | 8.2 | GO:0034260 | negative regulation of GTPase activity(GO:0034260) |
| 0.2 | 1.6 | GO:0048625 | myoblast fate commitment(GO:0048625) |
| 0.2 | 2.8 | GO:0021684 | cerebellar granular layer formation(GO:0021684) cerebellar granule cell differentiation(GO:0021707) |
| 0.2 | 0.6 | GO:0044778 | meiotic DNA integrity checkpoint(GO:0044778) |
| 0.2 | 1.7 | GO:0007512 | adult heart development(GO:0007512) |
| 0.2 | 0.5 | GO:1902219 | regulation of intrinsic apoptotic signaling pathway in response to osmotic stress(GO:1902218) negative regulation of intrinsic apoptotic signaling pathway in response to osmotic stress(GO:1902219) |
| 0.2 | 1.8 | GO:0035729 | response to hepatocyte growth factor(GO:0035728) cellular response to hepatocyte growth factor stimulus(GO:0035729) |
| 0.2 | 1.3 | GO:0031053 | primary miRNA processing(GO:0031053) |
| 0.2 | 0.8 | GO:0001561 | fatty acid alpha-oxidation(GO:0001561) |
| 0.2 | 0.9 | GO:0009249 | protein lipoylation(GO:0009249) |
| 0.1 | 1.0 | GO:0001771 | immunological synapse formation(GO:0001771) |
| 0.1 | 0.5 | GO:0051890 | regulation of cardioblast differentiation(GO:0051890) |
| 0.1 | 0.5 | GO:0072369 | regulation of lipid transport by positive regulation of transcription from RNA polymerase II promoter(GO:0072369) |
| 0.1 | 2.7 | GO:0008340 | determination of adult lifespan(GO:0008340) |
| 0.1 | 0.3 | GO:2000501 | natural killer cell chemotaxis(GO:0035747) regulation of natural killer cell chemotaxis(GO:2000501) |
| 0.1 | 1.5 | GO:0042711 | maternal behavior(GO:0042711) |
| 0.1 | 3.9 | GO:0043303 | mast cell activation involved in immune response(GO:0002279) mast cell degranulation(GO:0043303) |
| 0.1 | 1.8 | GO:0046855 | phosphorylated carbohydrate dephosphorylation(GO:0046838) inositol phosphate dephosphorylation(GO:0046855) |
| 0.1 | 0.8 | GO:0032020 | ISG15-protein conjugation(GO:0032020) |
| 0.1 | 1.0 | GO:0007220 | Notch receptor processing(GO:0007220) |
| 0.1 | 2.5 | GO:0048025 | negative regulation of mRNA splicing, via spliceosome(GO:0048025) |
| 0.1 | 0.6 | GO:0006621 | protein retention in ER lumen(GO:0006621) |
| 0.1 | 1.3 | GO:0007224 | smoothened signaling pathway(GO:0007224) |
| 0.1 | 0.8 | GO:0048386 | positive regulation of retinoic acid receptor signaling pathway(GO:0048386) |
| 0.1 | 0.4 | GO:0070966 | nuclear-transcribed mRNA catabolic process, no-go decay(GO:0070966) |
| 0.1 | 0.4 | GO:1905049 | negative regulation of metalloendopeptidase activity(GO:1904684) negative regulation of metallopeptidase activity(GO:1905049) |
| 0.1 | 3.5 | GO:0045668 | negative regulation of osteoblast differentiation(GO:0045668) |
| 0.1 | 0.3 | GO:0090038 | negative regulation of protein kinase C signaling(GO:0090038) |
| 0.1 | 0.5 | GO:0008635 | activation of cysteine-type endopeptidase activity involved in apoptotic process by cytochrome c(GO:0008635) |
| 0.1 | 1.8 | GO:0010107 | potassium ion import(GO:0010107) |
| 0.1 | 1.9 | GO:0042462 | eye photoreceptor cell development(GO:0042462) |
| 0.1 | 0.3 | GO:0021592 | fourth ventricle development(GO:0021592) initiation of neural tube closure(GO:0021993) |
| 0.1 | 2.5 | GO:0048013 | ephrin receptor signaling pathway(GO:0048013) |
| 0.1 | 1.2 | GO:0043984 | histone H4-K16 acetylation(GO:0043984) |
| 0.1 | 0.3 | GO:0042921 | glucocorticoid receptor signaling pathway(GO:0042921) |
| 0.0 | 0.8 | GO:0006744 | ubiquinone biosynthetic process(GO:0006744) |
| 0.0 | 0.4 | GO:2000601 | positive regulation of Arp2/3 complex-mediated actin nucleation(GO:2000601) |
| 0.0 | 0.2 | GO:0000160 | phosphorelay signal transduction system(GO:0000160) |
| 0.0 | 0.4 | GO:0090435 | protein localization to nuclear envelope(GO:0090435) |
| 0.0 | 0.4 | GO:0046716 | muscle cell cellular homeostasis(GO:0046716) |
| 0.0 | 4.6 | GO:0007050 | cell cycle arrest(GO:0007050) |
| 0.0 | 0.2 | GO:2000628 | regulation of miRNA metabolic process(GO:2000628) |
| 0.0 | 2.7 | GO:0007498 | mesoderm development(GO:0007498) |
| 0.0 | 1.3 | GO:0006506 | GPI anchor biosynthetic process(GO:0006506) |
| 0.0 | 0.6 | GO:0016226 | iron-sulfur cluster assembly(GO:0016226) metallo-sulfur cluster assembly(GO:0031163) |
| 0.0 | 1.2 | GO:0031122 | cytoplasmic microtubule organization(GO:0031122) |
| 0.0 | 1.8 | GO:0006635 | fatty acid beta-oxidation(GO:0006635) |
| 0.0 | 0.6 | GO:0043687 | post-translational protein modification(GO:0043687) |
| 0.0 | 0.2 | GO:0015697 | quaternary ammonium group transport(GO:0015697) |
| 0.0 | 0.4 | GO:0010955 | negative regulation of protein processing(GO:0010955) negative regulation of protein maturation(GO:1903318) |
| 0.0 | 0.4 | GO:0006221 | pyrimidine nucleotide biosynthetic process(GO:0006221) |
| 0.0 | 0.3 | GO:0032402 | melanosome transport(GO:0032402) |
| 0.0 | 0.2 | GO:0044804 | nucleophagy(GO:0044804) |
| 0.0 | 0.8 | GO:0006406 | mRNA export from nucleus(GO:0006406) mRNA-containing ribonucleoprotein complex export from nucleus(GO:0071427) |
| 0.0 | 0.1 | GO:0061669 | spontaneous neurotransmitter secretion(GO:0061669) spontaneous synaptic transmission(GO:0098814) |
| 0.0 | 0.2 | GO:2000821 | AMPA glutamate receptor clustering(GO:0097113) glutamate receptor clustering(GO:0097688) regulation of grooming behavior(GO:2000821) |
| 0.0 | 0.7 | GO:0001885 | endothelial cell development(GO:0001885) |
Gene overrepresentation in cellular_component category:
| Log-likelihood per target | Total log-likelihood | Term | Description |
|---|---|---|---|
| 1.1 | 8.5 | GO:0005833 | hemoglobin complex(GO:0005833) |
| 0.9 | 3.8 | GO:0090537 | CERF complex(GO:0090537) |
| 0.9 | 2.7 | GO:0005577 | fibrinogen complex(GO:0005577) |
| 0.8 | 5.7 | GO:0090571 | RNA polymerase II transcription repressor complex(GO:0090571) |
| 0.8 | 2.4 | GO:0044194 | cytolytic granule(GO:0044194) |
| 0.6 | 8.2 | GO:0031235 | intrinsic component of the cytoplasmic side of the plasma membrane(GO:0031235) |
| 0.4 | 1.2 | GO:0033193 | Lsd1/2 complex(GO:0033193) |
| 0.4 | 5.2 | GO:0035686 | sperm fibrous sheath(GO:0035686) |
| 0.4 | 0.4 | GO:0097418 | neurofibrillary tangle(GO:0097418) |
| 0.3 | 2.1 | GO:0097452 | GAIT complex(GO:0097452) |
| 0.2 | 1.2 | GO:0035189 | Rb-E2F complex(GO:0035189) |
| 0.2 | 1.2 | GO:0072487 | MSL complex(GO:0072487) |
| 0.2 | 1.7 | GO:0097136 | Bcl-2 family protein complex(GO:0097136) |
| 0.2 | 1.6 | GO:0071541 | eukaryotic translation initiation factor 3 complex, eIF3m(GO:0071541) |
| 0.2 | 1.6 | GO:0070369 | beta-catenin-TCF7L2 complex(GO:0070369) |
| 0.2 | 1.7 | GO:0002178 | palmitoyltransferase complex(GO:0002178) |
| 0.1 | 3.5 | GO:0001891 | phagocytic cup(GO:0001891) |
| 0.1 | 5.0 | GO:0016235 | aggresome(GO:0016235) |
| 0.1 | 1.7 | GO:0005675 | holo TFIIH complex(GO:0005675) |
| 0.1 | 5.1 | GO:0005834 | heterotrimeric G-protein complex(GO:0005834) |
| 0.1 | 1.3 | GO:0071598 | neuronal ribonucleoprotein granule(GO:0071598) |
| 0.1 | 0.6 | GO:0030896 | checkpoint clamp complex(GO:0030896) |
| 0.1 | 1.4 | GO:0035631 | CD40 receptor complex(GO:0035631) |
| 0.1 | 1.3 | GO:0034362 | low-density lipoprotein particle(GO:0034362) |
| 0.1 | 4.9 | GO:0005882 | intermediate filament(GO:0005882) |
| 0.1 | 0.8 | GO:0031080 | nuclear pore outer ring(GO:0031080) |
| 0.1 | 7.0 | GO:0017053 | transcriptional repressor complex(GO:0017053) |
| 0.1 | 0.3 | GO:0070937 | CRD-mediated mRNA stability complex(GO:0070937) |
| 0.1 | 1.2 | GO:0034451 | centriolar satellite(GO:0034451) |
| 0.1 | 0.5 | GO:0034709 | methylosome(GO:0034709) |
| 0.0 | 1.9 | GO:0032391 | photoreceptor connecting cilium(GO:0032391) |
| 0.0 | 4.3 | GO:0043198 | dendritic shaft(GO:0043198) |
| 0.0 | 0.4 | GO:0031209 | SCAR complex(GO:0031209) |
| 0.0 | 1.3 | GO:0045211 | postsynaptic membrane(GO:0045211) |
| 0.0 | 1.2 | GO:0005788 | endoplasmic reticulum lumen(GO:0005788) |
| 0.0 | 8.6 | GO:0005667 | transcription factor complex(GO:0005667) |
| 0.0 | 4.4 | GO:0009897 | external side of plasma membrane(GO:0009897) |
| 0.0 | 4.8 | GO:0005769 | early endosome(GO:0005769) |
| 0.0 | 0.5 | GO:0005782 | peroxisomal matrix(GO:0005782) microbody lumen(GO:0031907) |
| 0.0 | 0.9 | GO:0030964 | mitochondrial respiratory chain complex I(GO:0005747) NADH dehydrogenase complex(GO:0030964) respiratory chain complex I(GO:0045271) |
| 0.0 | 0.3 | GO:0005869 | dynactin complex(GO:0005869) |
| 0.0 | 1.1 | GO:0019005 | SCF ubiquitin ligase complex(GO:0019005) |
| 0.0 | 2.0 | GO:0032993 | protein-DNA complex(GO:0032993) |
| 0.0 | 0.2 | GO:0030877 | beta-catenin destruction complex(GO:0030877) |
| 0.0 | 0.6 | GO:0005801 | cis-Golgi network(GO:0005801) |
| 0.0 | 0.3 | GO:0031519 | PcG protein complex(GO:0031519) |
| 0.0 | 0.2 | GO:0044300 | cerebellar mossy fiber(GO:0044300) |
| 0.0 | 22.8 | GO:0005654 | nucleoplasm(GO:0005654) |
| 0.0 | 0.4 | GO:0045171 | intercellular bridge(GO:0045171) |
Gene overrepresentation in molecular_function category:
| Log-likelihood per target | Total log-likelihood | Term | Description |
|---|---|---|---|
| 2.5 | 15.3 | GO:0019841 | retinol binding(GO:0019841) |
| 2.1 | 8.5 | GO:0031721 | hemoglobin alpha binding(GO:0031721) |
| 1.2 | 3.6 | GO:0010698 | acetyltransferase activator activity(GO:0010698) |
| 0.9 | 2.7 | GO:0070052 | collagen V binding(GO:0070052) |
| 0.9 | 5.2 | GO:0004332 | fructose-bisphosphate aldolase activity(GO:0004332) |
| 0.8 | 5.7 | GO:0001226 | RNA polymerase II transcription corepressor binding(GO:0001226) |
| 0.7 | 4.3 | GO:0035727 | lysophosphatidic acid binding(GO:0035727) lysophosphatidic acid receptor activity(GO:0070915) |
| 0.7 | 2.8 | GO:1902379 | chemoattractant activity involved in axon guidance(GO:1902379) |
| 0.7 | 2.1 | GO:0035605 | peptidyl-cysteine S-nitrosylase activity(GO:0035605) |
| 0.6 | 1.9 | GO:0005105 | type 1 fibroblast growth factor receptor binding(GO:0005105) |
| 0.6 | 1.9 | GO:0042289 | MHC class II protein binding(GO:0042289) |
| 0.5 | 4.9 | GO:0031730 | CCR5 chemokine receptor binding(GO:0031730) |
| 0.5 | 2.6 | GO:0015467 | G-protein activated inward rectifier potassium channel activity(GO:0015467) |
| 0.5 | 3.0 | GO:0051429 | corticotropin-releasing hormone receptor binding(GO:0051429) corticotropin-releasing hormone receptor 1 binding(GO:0051430) |
| 0.5 | 5.4 | GO:0003680 | AT DNA binding(GO:0003680) |
| 0.3 | 3.5 | GO:0032036 | myosin heavy chain binding(GO:0032036) |
| 0.3 | 1.3 | GO:0030229 | very-low-density lipoprotein particle receptor activity(GO:0030229) |
| 0.3 | 1.3 | GO:0001069 | regulatory region RNA binding(GO:0001069) |
| 0.2 | 1.7 | GO:0051434 | BH3 domain binding(GO:0051434) |
| 0.2 | 0.8 | GO:0042903 | tubulin deacetylase activity(GO:0042903) |
| 0.2 | 0.5 | GO:0005128 | erythropoietin receptor binding(GO:0005128) |
| 0.2 | 3.0 | GO:0016857 | racemase and epimerase activity, acting on carbohydrates and derivatives(GO:0016857) |
| 0.2 | 4.8 | GO:0035259 | glucocorticoid receptor binding(GO:0035259) |
| 0.2 | 0.8 | GO:0004839 | ubiquitin activating enzyme activity(GO:0004839) |
| 0.1 | 0.6 | GO:0046923 | ER retention sequence binding(GO:0046923) |
| 0.1 | 2.8 | GO:0004198 | calcium-dependent cysteine-type endopeptidase activity(GO:0004198) |
| 0.1 | 0.5 | GO:0004165 | dodecenoyl-CoA delta-isomerase activity(GO:0004165) |
| 0.1 | 2.4 | GO:0017075 | syntaxin-1 binding(GO:0017075) |
| 0.1 | 0.8 | GO:0030976 | thiamine pyrophosphate binding(GO:0030976) |
| 0.1 | 1.8 | GO:0017161 | phosphohistidine phosphatase activity(GO:0008969) inositol-1,3,4-trisphosphate 4-phosphatase activity(GO:0017161) NADP phosphatase activity(GO:0019178) 5-amino-6-(5-phosphoribitylamino)uracil phosphatase activity(GO:0043726) phosphatidylinositol-3,5-bisphosphate 5-phosphatase activity(GO:0043813) inositol-1,3,4,5,6-pentakisphosphate 1-phosphatase activity(GO:0052825) inositol-3,4-bisphosphate 4-phosphatase activity(GO:0052828) inositol-1,3,4-trisphosphate 1-phosphatase activity(GO:0052829) inositol-1,3,4,6-tetrakisphosphate 6-phosphatase activity(GO:0052830) inositol-1,3,4,6-tetrakisphosphate 1-phosphatase activity(GO:0052831) phosphatidylinositol-1,4,5-trisphosphate 5-phosphatase activity(GO:0052867) IDP phosphatase activity(GO:1990003) |
| 0.1 | 0.5 | GO:1990829 | C-rich single-stranded DNA binding(GO:1990829) |
| 0.1 | 0.9 | GO:0031996 | thioesterase binding(GO:0031996) |
| 0.1 | 1.3 | GO:0070402 | NADPH binding(GO:0070402) |
| 0.1 | 1.6 | GO:0045295 | gamma-catenin binding(GO:0045295) |
| 0.1 | 1.6 | GO:0042165 | neurotransmitter binding(GO:0042165) |
| 0.1 | 1.5 | GO:0005112 | Notch binding(GO:0005112) |
| 0.1 | 2.0 | GO:0001221 | transcription cofactor binding(GO:0001221) |
| 0.0 | 2.5 | GO:0046875 | ephrin receptor binding(GO:0046875) |
| 0.0 | 6.8 | GO:0047485 | protein N-terminus binding(GO:0047485) |
| 0.0 | 0.2 | GO:0000155 | phosphorelay sensor kinase activity(GO:0000155) |
| 0.0 | 0.4 | GO:0035615 | clathrin heavy chain binding(GO:0032050) clathrin adaptor activity(GO:0035615) endocytic adaptor activity(GO:0098748) |
| 0.0 | 1.6 | GO:0031369 | translation initiation factor binding(GO:0031369) |
| 0.0 | 2.6 | GO:0004714 | transmembrane receptor protein tyrosine kinase activity(GO:0004714) |
| 0.0 | 0.3 | GO:0050291 | sphingosine N-acyltransferase activity(GO:0050291) |
| 0.0 | 0.2 | GO:0015651 | quaternary ammonium group transmembrane transporter activity(GO:0015651) |
| 0.0 | 0.8 | GO:0005487 | nucleocytoplasmic transporter activity(GO:0005487) |
| 0.0 | 0.5 | GO:0070577 | lysine-acetylated histone binding(GO:0070577) |
| 0.0 | 4.6 | GO:0001047 | core promoter binding(GO:0001047) |
| 0.0 | 1.3 | GO:0051019 | mitogen-activated protein kinase binding(GO:0051019) |
| 0.0 | 4.8 | GO:0003714 | transcription corepressor activity(GO:0003714) |
| 0.0 | 0.5 | GO:0008327 | methyl-CpG binding(GO:0008327) |
| 0.0 | 0.2 | GO:0031811 | G-protein coupled nucleotide receptor binding(GO:0031811) P2Y1 nucleotide receptor binding(GO:0031812) |
| 0.0 | 0.5 | GO:0019706 | protein-cysteine S-palmitoyltransferase activity(GO:0019706) |
| 0.0 | 0.1 | GO:0051400 | BH domain binding(GO:0051400) |
| 0.0 | 1.1 | GO:0005179 | hormone activity(GO:0005179) |
| 0.0 | 0.6 | GO:0018602 | sulfonate dioxygenase activity(GO:0000907) 2,4-dichlorophenoxyacetate alpha-ketoglutarate dioxygenase activity(GO:0018602) hypophosphite dioxygenase activity(GO:0034792) gibberellin 2-beta-dioxygenase activity(GO:0045543) C-19 gibberellin 2-beta-dioxygenase activity(GO:0052634) C-20 gibberellin 2-beta-dioxygenase activity(GO:0052635) |
| 0.0 | 0.2 | GO:0010314 | phosphatidylinositol-5-phosphate binding(GO:0010314) |
| 0.0 | 0.2 | GO:0070016 | armadillo repeat domain binding(GO:0070016) |
| 0.0 | 1.2 | GO:0004540 | ribonuclease activity(GO:0004540) |
| 0.0 | 0.6 | GO:0005246 | calcium channel regulator activity(GO:0005246) |
| 0.0 | 1.5 | GO:0000981 | RNA polymerase II transcription factor activity, sequence-specific DNA binding(GO:0000981) |
| 0.0 | 3.3 | GO:0005096 | GTPase activator activity(GO:0005096) |
| 0.0 | 1.8 | GO:0017124 | SH3 domain binding(GO:0017124) |
| 0.0 | 0.3 | GO:0008009 | chemokine activity(GO:0008009) |
| 0.0 | 1.0 | GO:0005178 | integrin binding(GO:0005178) |