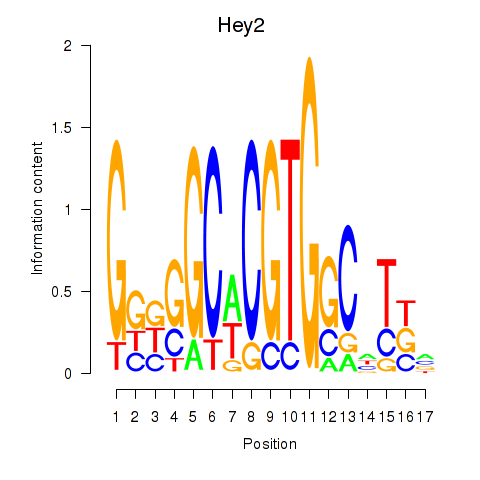
Motif ID: Hey2
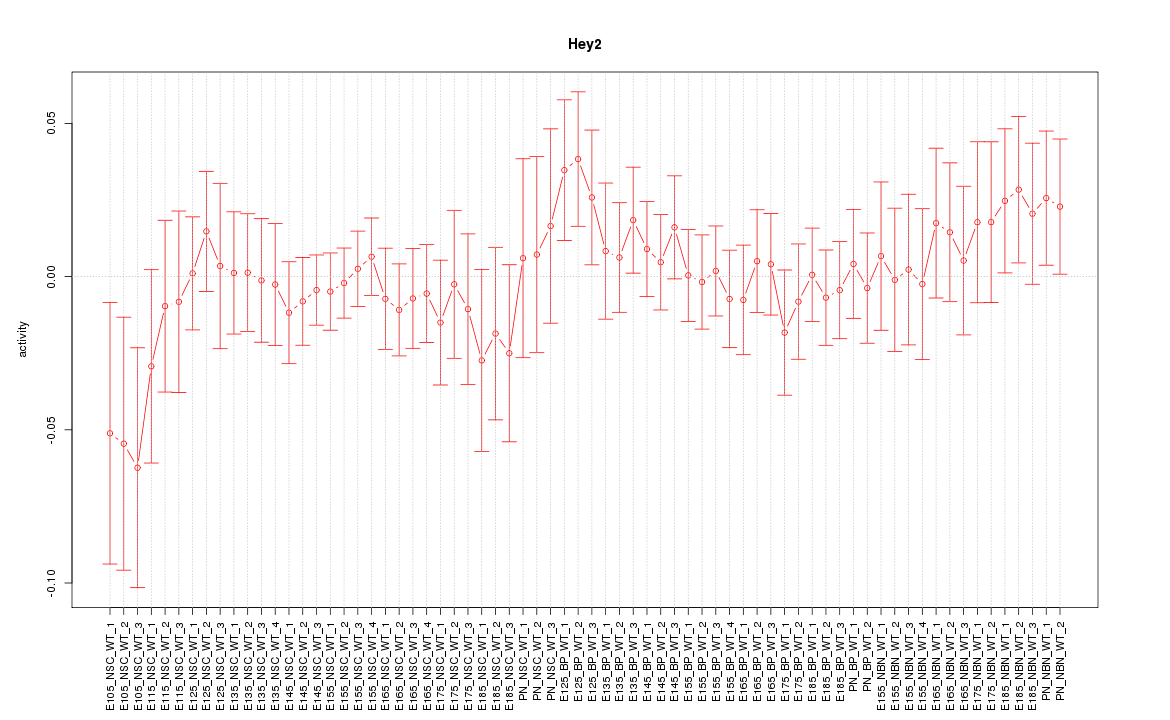
Z-value: 0.678
Transcription factors associated with Hey2:
| Gene Symbol | Entrez ID | Gene Name |
|---|---|---|
| Hey2 | ENSMUSG00000019789.8 | Hey2 |
Activity-expression correlation:
| Gene Symbol | Promoter | Pearson corr. coef. | P-value | Plot |
|---|---|---|---|---|
| Hey2 | mm10_v2_chr10_-_30842765_30842801 | -0.25 | 3.9e-02 | Click! |


Top targets:
Gene overrepresentation in biological_process category:
| Log-likelihood per target | Total log-likelihood | Term | Description |
|---|---|---|---|
| 1.9 | 5.6 | GO:0021577 | hindbrain structural organization(GO:0021577) cerebellum structural organization(GO:0021589) |
| 1.5 | 5.9 | GO:0031622 | positive regulation of fever generation(GO:0031622) |
| 1.2 | 3.7 | GO:0046168 | glycerol-3-phosphate catabolic process(GO:0046168) |
| 1.1 | 9.8 | GO:0021894 | cerebral cortex GABAergic interneuron development(GO:0021894) |
| 0.9 | 2.6 | GO:0010512 | negative regulation of phosphatidylinositol biosynthetic process(GO:0010512) |
| 0.8 | 3.2 | GO:1904177 | regulation of adipose tissue development(GO:1904177) |
| 0.7 | 2.8 | GO:2000017 | positive regulation of determination of dorsal identity(GO:2000017) |
| 0.6 | 8.6 | GO:0050901 | leukocyte tethering or rolling(GO:0050901) |
| 0.5 | 2.2 | GO:0051725 | protein de-ADP-ribosylation(GO:0051725) |
| 0.5 | 1.9 | GO:0010808 | positive regulation of synaptic vesicle priming(GO:0010808) |
| 0.4 | 1.7 | GO:1901491 | negative regulation of lymphangiogenesis(GO:1901491) |
| 0.4 | 2.1 | GO:0032485 | regulation of Ral protein signal transduction(GO:0032485) |
| 0.4 | 1.7 | GO:1901165 | positive regulation of trophoblast cell migration(GO:1901165) |
| 0.4 | 1.2 | GO:0018008 | N-terminal peptidyl-glycine N-myristoylation(GO:0018008) peptidyl-glycine modification(GO:0018201) |
| 0.4 | 1.5 | GO:0061428 | embryonic heart tube left/right pattern formation(GO:0060971) negative regulation of transcription from RNA polymerase II promoter in response to hypoxia(GO:0061428) |
| 0.3 | 3.1 | GO:2000601 | positive regulation of Arp2/3 complex-mediated actin nucleation(GO:2000601) |
| 0.3 | 3.7 | GO:0035970 | peptidyl-threonine dephosphorylation(GO:0035970) |
| 0.3 | 2.9 | GO:0030432 | peristalsis(GO:0030432) |
| 0.3 | 0.6 | GO:0071072 | negative regulation of phospholipid biosynthetic process(GO:0071072) |
| 0.3 | 3.2 | GO:1904321 | response to forskolin(GO:1904321) cellular response to forskolin(GO:1904322) |
| 0.3 | 10.8 | GO:0045214 | sarcomere organization(GO:0045214) |
| 0.2 | 2.7 | GO:0032482 | Rab protein signal transduction(GO:0032482) |
| 0.2 | 1.4 | GO:0035428 | hexose transmembrane transport(GO:0035428) |
| 0.2 | 2.4 | GO:0071435 | potassium ion export(GO:0071435) |
| 0.2 | 0.9 | GO:0006668 | sphinganine-1-phosphate metabolic process(GO:0006668) |
| 0.2 | 9.4 | GO:0006890 | retrograde vesicle-mediated transport, Golgi to ER(GO:0006890) |
| 0.2 | 0.9 | GO:0002924 | negative regulation of humoral immune response mediated by circulating immunoglobulin(GO:0002924) |
| 0.2 | 1.8 | GO:0051639 | actin filament network formation(GO:0051639) |
| 0.2 | 1.8 | GO:0035845 | photoreceptor cell outer segment organization(GO:0035845) |
| 0.2 | 3.6 | GO:1903861 | regulation of dendrite extension(GO:1903859) positive regulation of dendrite extension(GO:1903861) |
| 0.2 | 0.7 | GO:0060392 | negative regulation of SMAD protein import into nucleus(GO:0060392) |
| 0.2 | 0.8 | GO:0008295 | spermidine biosynthetic process(GO:0008295) |
| 0.2 | 0.6 | GO:0014063 | negative regulation of serotonin secretion(GO:0014063) |
| 0.2 | 3.5 | GO:0050650 | chondroitin sulfate proteoglycan biosynthetic process(GO:0050650) |
| 0.2 | 0.5 | GO:1904685 | positive regulation of metalloendopeptidase activity(GO:1904685) |
| 0.2 | 3.2 | GO:0042297 | vocal learning(GO:0042297) imitative learning(GO:0098596) learned vocalization behavior or vocal learning(GO:0098598) |
| 0.2 | 2.4 | GO:0072643 | interferon-gamma secretion(GO:0072643) |
| 0.2 | 1.4 | GO:0018230 | peptidyl-L-cysteine S-palmitoylation(GO:0018230) peptidyl-S-diacylglycerol-L-cysteine biosynthetic process from peptidyl-cysteine(GO:0018231) |
| 0.1 | 0.6 | GO:0060480 | lung goblet cell differentiation(GO:0060480) |
| 0.1 | 2.8 | GO:0031115 | negative regulation of microtubule polymerization(GO:0031115) |
| 0.1 | 3.8 | GO:0048488 | synaptic vesicle endocytosis(GO:0048488) |
| 0.1 | 3.9 | GO:0007608 | sensory perception of smell(GO:0007608) |
| 0.1 | 1.1 | GO:0071243 | cellular response to arsenic-containing substance(GO:0071243) |
| 0.1 | 1.0 | GO:2000074 | regulation of type B pancreatic cell development(GO:2000074) |
| 0.1 | 1.6 | GO:0071257 | cellular response to electrical stimulus(GO:0071257) |
| 0.1 | 3.0 | GO:0048148 | behavioral response to cocaine(GO:0048148) |
| 0.1 | 2.1 | GO:0002495 | antigen processing and presentation of peptide antigen via MHC class II(GO:0002495) |
| 0.1 | 1.3 | GO:0032780 | negative regulation of ATPase activity(GO:0032780) |
| 0.1 | 0.6 | GO:0048934 | peripheral nervous system neuron differentiation(GO:0048934) peripheral nervous system neuron development(GO:0048935) |
| 0.1 | 0.8 | GO:0018401 | peptidyl-proline hydroxylation to 4-hydroxy-L-proline(GO:0018401) |
| 0.1 | 0.6 | GO:0051964 | negative regulation of synapse assembly(GO:0051964) |
| 0.1 | 1.6 | GO:1900454 | positive regulation of long term synaptic depression(GO:1900454) |
| 0.1 | 0.6 | GO:0015791 | polyol transport(GO:0015791) |
| 0.1 | 0.2 | GO:0015938 | coenzyme A catabolic process(GO:0015938) nucleoside bisphosphate catabolic process(GO:0033869) ribonucleoside bisphosphate catabolic process(GO:0034031) purine nucleoside bisphosphate catabolic process(GO:0034034) |
| 0.1 | 1.1 | GO:0009083 | branched-chain amino acid catabolic process(GO:0009083) |
| 0.1 | 1.8 | GO:0010800 | positive regulation of peptidyl-threonine phosphorylation(GO:0010800) |
| 0.1 | 0.6 | GO:0006370 | 7-methylguanosine mRNA capping(GO:0006370) |
| 0.1 | 5.5 | GO:1903955 | positive regulation of protein targeting to mitochondrion(GO:1903955) |
| 0.1 | 0.5 | GO:0090166 | Golgi disassembly(GO:0090166) |
| 0.1 | 1.3 | GO:0007020 | microtubule nucleation(GO:0007020) |
| 0.1 | 2.0 | GO:0045824 | negative regulation of innate immune response(GO:0045824) |
| 0.1 | 0.3 | GO:0048254 | snoRNA localization(GO:0048254) |
| 0.0 | 3.1 | GO:0050868 | negative regulation of T cell activation(GO:0050868) |
| 0.0 | 8.1 | GO:0042787 | protein ubiquitination involved in ubiquitin-dependent protein catabolic process(GO:0042787) |
| 0.0 | 2.9 | GO:0048168 | regulation of neuronal synaptic plasticity(GO:0048168) |
| 0.0 | 0.7 | GO:0045792 | negative regulation of cell size(GO:0045792) |
| 0.0 | 0.2 | GO:0021554 | optic nerve development(GO:0021554) |
| 0.0 | 1.0 | GO:0036075 | endochondral ossification(GO:0001958) replacement ossification(GO:0036075) |
| 0.0 | 3.3 | GO:0007601 | visual perception(GO:0007601) |
| 0.0 | 0.3 | GO:0006620 | posttranslational protein targeting to membrane(GO:0006620) |
| 0.0 | 4.9 | GO:0007596 | blood coagulation(GO:0007596) |
| 0.0 | 1.4 | GO:0006506 | GPI anchor biosynthetic process(GO:0006506) |
| 0.0 | 2.1 | GO:0007156 | homophilic cell adhesion via plasma membrane adhesion molecules(GO:0007156) |
| 0.0 | 0.3 | GO:0006706 | steroid catabolic process(GO:0006706) |
| 0.0 | 0.5 | GO:0035335 | peptidyl-tyrosine dephosphorylation(GO:0035335) |
| 0.0 | 0.4 | GO:0045292 | mRNA cis splicing, via spliceosome(GO:0045292) |
| 0.0 | 3.2 | GO:0071805 | potassium ion transmembrane transport(GO:0071805) |
| 0.0 | 0.5 | GO:0040015 | negative regulation of multicellular organism growth(GO:0040015) |
| 0.0 | 0.2 | GO:0006544 | glycine metabolic process(GO:0006544) |
| 0.0 | 1.3 | GO:0007569 | cell aging(GO:0007569) |
| 0.0 | 0.6 | GO:0031648 | protein destabilization(GO:0031648) |
| 0.0 | 0.1 | GO:0071285 | cellular response to lithium ion(GO:0071285) |
| 0.0 | 0.3 | GO:0035518 | histone H2A monoubiquitination(GO:0035518) |
| 0.0 | 0.4 | GO:0001829 | trophectodermal cell differentiation(GO:0001829) |
| 0.0 | 3.1 | GO:0051260 | protein homooligomerization(GO:0051260) |
| 0.0 | 0.1 | GO:0000042 | protein targeting to Golgi(GO:0000042) |
| 0.0 | 0.1 | GO:0006884 | cell volume homeostasis(GO:0006884) |
Gene overrepresentation in cellular_component category:
| Log-likelihood per target | Total log-likelihood | Term | Description |
|---|---|---|---|
| 0.8 | 2.4 | GO:0044194 | cytolytic granule(GO:0044194) |
| 0.7 | 3.7 | GO:0009331 | glycerol-3-phosphate dehydrogenase complex(GO:0009331) |
| 0.6 | 1.7 | GO:0048179 | activin receptor complex(GO:0048179) |
| 0.5 | 3.2 | GO:0005638 | lamin filament(GO:0005638) |
| 0.4 | 20.7 | GO:0031941 | filamentous actin(GO:0031941) |
| 0.3 | 1.1 | GO:0005947 | mitochondrial alpha-ketoglutarate dehydrogenase complex(GO:0005947) |
| 0.3 | 3.8 | GO:0005922 | connexon complex(GO:0005922) |
| 0.2 | 3.1 | GO:0031209 | SCAR complex(GO:0031209) |
| 0.2 | 1.3 | GO:0031314 | mitochondrial inner membrane presequence translocase complex(GO:0005744) extrinsic component of mitochondrial inner membrane(GO:0031314) |
| 0.2 | 1.6 | GO:0038037 | G-protein coupled receptor dimeric complex(GO:0038037) G-protein coupled receptor complex(GO:0097648) |
| 0.2 | 1.8 | GO:0030991 | intraciliary transport particle A(GO:0030991) |
| 0.2 | 1.8 | GO:0005885 | Arp2/3 protein complex(GO:0005885) |
| 0.1 | 2.8 | GO:0002102 | podosome(GO:0002102) |
| 0.1 | 1.4 | GO:0002178 | palmitoyltransferase complex(GO:0002178) |
| 0.1 | 1.8 | GO:0000506 | glycosylphosphatidylinositol-N-acetylglucosaminyltransferase (GPI-GnT) complex(GO:0000506) |
| 0.1 | 1.1 | GO:0030285 | integral component of synaptic vesicle membrane(GO:0030285) intrinsic component of synaptic vesicle membrane(GO:0098563) |
| 0.1 | 1.5 | GO:0031588 | nucleotide-activated protein kinase complex(GO:0031588) |
| 0.1 | 1.6 | GO:1990124 | messenger ribonucleoprotein complex(GO:1990124) |
| 0.1 | 6.1 | GO:0042734 | presynaptic membrane(GO:0042734) |
| 0.1 | 2.4 | GO:0097038 | perinuclear endoplasmic reticulum(GO:0097038) |
| 0.1 | 2.1 | GO:0032588 | trans-Golgi network membrane(GO:0032588) |
| 0.1 | 10.6 | GO:0055037 | recycling endosome(GO:0055037) |
| 0.1 | 2.1 | GO:0060077 | inhibitory synapse(GO:0060077) |
| 0.1 | 5.8 | GO:0001725 | stress fiber(GO:0001725) contractile actin filament bundle(GO:0097517) |
| 0.1 | 1.3 | GO:0000930 | gamma-tubulin complex(GO:0000930) |
| 0.1 | 2.4 | GO:0005902 | microvillus(GO:0005902) |
| 0.0 | 0.6 | GO:0034518 | mRNA cap binding complex(GO:0005845) RNA cap binding complex(GO:0034518) |
| 0.0 | 5.6 | GO:0030659 | cytoplasmic vesicle membrane(GO:0030659) |
| 0.0 | 5.6 | GO:0005903 | brush border(GO:0005903) |
| 0.0 | 12.7 | GO:0045121 | membrane raft(GO:0045121) membrane microdomain(GO:0098857) |
| 0.0 | 0.6 | GO:0048786 | presynaptic active zone(GO:0048786) |
| 0.0 | 4.0 | GO:0070382 | exocytic vesicle(GO:0070382) |
| 0.0 | 0.3 | GO:0031428 | box C/D snoRNP complex(GO:0031428) |
| 0.0 | 0.5 | GO:0043240 | Fanconi anaemia nuclear complex(GO:0043240) |
| 0.0 | 2.3 | GO:0030118 | clathrin coat(GO:0030118) |
| 0.0 | 0.4 | GO:0001739 | sex chromatin(GO:0001739) |
| 0.0 | 0.1 | GO:0036488 | CHOP-C/EBP complex(GO:0036488) |
| 0.0 | 1.9 | GO:0019005 | SCF ubiquitin ligase complex(GO:0019005) |
| 0.0 | 0.3 | GO:0035102 | PRC1 complex(GO:0035102) |
| 0.0 | 0.1 | GO:0034715 | pICln-Sm protein complex(GO:0034715) |
| 0.0 | 1.4 | GO:0030133 | transport vesicle(GO:0030133) |
| 0.0 | 1.2 | GO:0031463 | Cul3-RING ubiquitin ligase complex(GO:0031463) |
| 0.0 | 0.6 | GO:0000314 | organellar small ribosomal subunit(GO:0000314) mitochondrial small ribosomal subunit(GO:0005763) |
| 0.0 | 0.3 | GO:0014704 | intercalated disc(GO:0014704) |
| 0.0 | 2.4 | GO:0030016 | myofibril(GO:0030016) |
| 0.0 | 1.2 | GO:0000502 | proteasome complex(GO:0000502) |
| 0.0 | 0.6 | GO:0031594 | neuromuscular junction(GO:0031594) |
| 0.0 | 1.2 | GO:0019898 | extrinsic component of membrane(GO:0019898) |
| 0.0 | 0.1 | GO:0005751 | mitochondrial respiratory chain complex IV(GO:0005751) |
Gene overrepresentation in molecular_function category:
| Log-likelihood per target | Total log-likelihood | Term | Description |
|---|---|---|---|
| 1.0 | 2.9 | GO:0004994 | somatostatin receptor activity(GO:0004994) |
| 0.9 | 3.7 | GO:0004741 | [pyruvate dehydrogenase (lipoamide)] phosphatase activity(GO:0004741) |
| 0.7 | 3.7 | GO:0004367 | glycerol-3-phosphate dehydrogenase [NAD+] activity(GO:0004367) |
| 0.6 | 3.5 | GO:0015018 | galactosylgalactosylxylosylprotein 3-beta-glucuronosyltransferase activity(GO:0015018) |
| 0.5 | 2.4 | GO:0005250 | A-type (transient outward) potassium channel activity(GO:0005250) |
| 0.4 | 1.7 | GO:0016361 | activin receptor activity, type I(GO:0016361) |
| 0.4 | 1.2 | GO:0004379 | glycylpeptide N-tetradecanoyltransferase activity(GO:0004379) |
| 0.4 | 1.6 | GO:0001639 | PLC activating G-protein coupled glutamate receptor activity(GO:0001639) |
| 0.4 | 7.8 | GO:0004012 | phospholipid-translocating ATPase activity(GO:0004012) |
| 0.4 | 2.8 | GO:0035033 | histone deacetylase regulator activity(GO:0035033) |
| 0.3 | 2.1 | GO:0016453 | acetyl-CoA C-acetyltransferase activity(GO:0003985) C-acetyltransferase activity(GO:0016453) |
| 0.3 | 3.1 | GO:0005068 | transmembrane receptor protein tyrosine kinase adaptor activity(GO:0005068) |
| 0.3 | 2.1 | GO:0098632 | protein binding involved in cell-cell adhesion(GO:0098632) |
| 0.2 | 1.9 | GO:0002151 | G-quadruplex RNA binding(GO:0002151) |
| 0.2 | 1.5 | GO:0050693 | LBD domain binding(GO:0050693) |
| 0.2 | 2.6 | GO:0048407 | platelet-derived growth factor binding(GO:0048407) |
| 0.2 | 2.2 | GO:0070636 | single-strand selective uracil DNA N-glycosylase activity(GO:0017065) nicotinamide riboside hydrolase activity(GO:0070635) nicotinic acid riboside hydrolase activity(GO:0070636) deoxyribonucleoside 5'-monophosphate N-glycosidase activity(GO:0070694) |
| 0.2 | 12.7 | GO:0005200 | structural constituent of cytoskeleton(GO:0005200) |
| 0.1 | 5.6 | GO:0042169 | SH2 domain binding(GO:0042169) |
| 0.1 | 0.9 | GO:0008294 | calcium- and calmodulin-responsive adenylate cyclase activity(GO:0008294) |
| 0.1 | 3.5 | GO:0070064 | proline-rich region binding(GO:0070064) |
| 0.1 | 1.5 | GO:0008603 | cAMP-dependent protein kinase regulator activity(GO:0008603) |
| 0.1 | 0.6 | GO:0005030 | neurotrophin receptor activity(GO:0005030) |
| 0.1 | 3.6 | GO:0001786 | phosphatidylserine binding(GO:0001786) |
| 0.1 | 9.8 | GO:0048306 | calcium-dependent protein binding(GO:0048306) |
| 0.1 | 2.3 | GO:0008179 | adenylate cyclase binding(GO:0008179) |
| 0.1 | 0.5 | GO:0031735 | CCR10 chemokine receptor binding(GO:0031735) |
| 0.1 | 3.2 | GO:0005251 | delayed rectifier potassium channel activity(GO:0005251) |
| 0.1 | 3.9 | GO:0030552 | cAMP binding(GO:0030552) |
| 0.1 | 3.2 | GO:0008157 | protein phosphatase 1 binding(GO:0008157) |
| 0.1 | 1.8 | GO:0042287 | MHC protein binding(GO:0042287) |
| 0.1 | 0.6 | GO:0005004 | GPI-linked ephrin receptor activity(GO:0005004) |
| 0.1 | 1.4 | GO:0005355 | glucose transmembrane transporter activity(GO:0005355) |
| 0.1 | 0.6 | GO:0016907 | G-protein coupled acetylcholine receptor activity(GO:0016907) |
| 0.1 | 0.8 | GO:0031545 | peptidyl-proline 4-dioxygenase activity(GO:0031545) |
| 0.1 | 1.1 | GO:0016624 | oxidoreductase activity, acting on the aldehyde or oxo group of donors, disulfide as acceptor(GO:0016624) |
| 0.1 | 4.2 | GO:0005246 | calcium channel regulator activity(GO:0005246) |
| 0.1 | 0.3 | GO:0017050 | sphinganine kinase activity(GO:0008481) D-erythro-sphingosine kinase activity(GO:0017050) |
| 0.1 | 0.6 | GO:0015166 | polyol transmembrane transporter activity(GO:0015166) |
| 0.1 | 1.3 | GO:0031489 | myosin V binding(GO:0031489) |
| 0.1 | 0.6 | GO:0015245 | fatty acid transporter activity(GO:0015245) |
| 0.1 | 0.5 | GO:0031730 | CCR5 chemokine receptor binding(GO:0031730) |
| 0.1 | 15.7 | GO:0043774 | UDP-N-acetylmuramoylalanyl-D-glutamyl-2,6-diaminopimelate-D-alanyl-D-alanine ligase activity(GO:0008766) ribosomal S6-glutamic acid ligase activity(GO:0018169) coenzyme F420-0 gamma-glutamyl ligase activity(GO:0043773) coenzyme F420-2 alpha-glutamyl ligase activity(GO:0043774) protein-glycine ligase activity(GO:0070735) protein-glycine ligase activity, initiating(GO:0070736) protein-glycine ligase activity, elongating(GO:0070737) tubulin-glycine ligase activity(GO:0070738) |
| 0.0 | 0.9 | GO:0017161 | phosphohistidine phosphatase activity(GO:0008969) inositol-1,3,4-trisphosphate 4-phosphatase activity(GO:0017161) NADP phosphatase activity(GO:0019178) 5-amino-6-(5-phosphoribitylamino)uracil phosphatase activity(GO:0043726) phosphatidylinositol-3,5-bisphosphate 5-phosphatase activity(GO:0043813) inositol-1,3,4,5,6-pentakisphosphate 1-phosphatase activity(GO:0052825) inositol-3,4-bisphosphate 4-phosphatase activity(GO:0052828) inositol-1,3,4-trisphosphate 1-phosphatase activity(GO:0052829) inositol-1,3,4,6-tetrakisphosphate 6-phosphatase activity(GO:0052830) inositol-1,3,4,6-tetrakisphosphate 1-phosphatase activity(GO:0052831) phosphatidylinositol-1,4,5-trisphosphate 5-phosphatase activity(GO:0052867) IDP phosphatase activity(GO:1990003) |
| 0.0 | 0.3 | GO:0001094 | TFIID-class transcription factor binding(GO:0001094) |
| 0.0 | 4.8 | GO:0008144 | drug binding(GO:0008144) |
| 0.0 | 0.8 | GO:0070577 | lysine-acetylated histone binding(GO:0070577) |
| 0.0 | 1.8 | GO:0008138 | protein tyrosine/serine/threonine phosphatase activity(GO:0008138) |
| 0.0 | 0.4 | GO:0097027 | ubiquitin-protein transferase activator activity(GO:0097027) |
| 0.0 | 1.6 | GO:0030544 | Hsp70 protein binding(GO:0030544) |
| 0.0 | 2.7 | GO:0004713 | protein tyrosine kinase activity(GO:0004713) |
| 0.0 | 1.0 | GO:0019003 | GDP binding(GO:0019003) |
| 0.0 | 2.2 | GO:0044325 | ion channel binding(GO:0044325) |
| 0.0 | 0.2 | GO:0070180 | large ribosomal subunit rRNA binding(GO:0070180) |
| 0.0 | 2.0 | GO:0017048 | Rho GTPase binding(GO:0017048) |
| 0.0 | 0.5 | GO:0002039 | p53 binding(GO:0002039) |
| 0.0 | 0.8 | GO:0016765 | transferase activity, transferring alkyl or aryl (other than methyl) groups(GO:0016765) |
| 0.0 | 0.1 | GO:0004143 | diacylglycerol kinase activity(GO:0004143) |