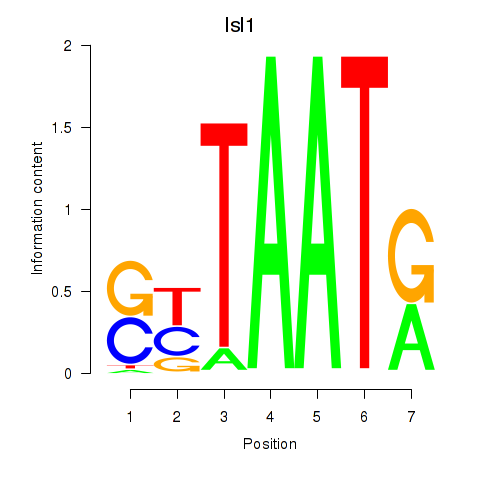
| 0.9 |
3.5 |
GO:2000974 |
negative regulation of pro-B cell differentiation(GO:2000974) |
| 0.5 |
1.6 |
GO:0035880 |
embryonic nail plate morphogenesis(GO:0035880) |
| 0.4 |
3.0 |
GO:0048625 |
myoblast fate commitment(GO:0048625) |
| 0.3 |
1.3 |
GO:0014846 |
esophagus smooth muscle contraction(GO:0014846) |
| 0.3 |
1.5 |
GO:0010668 |
ectodermal cell differentiation(GO:0010668) |
| 0.3 |
1.9 |
GO:0019532 |
oxalate transport(GO:0019532) |
| 0.3 |
1.9 |
GO:0060164 |
regulation of timing of neuron differentiation(GO:0060164) |
| 0.3 |
0.8 |
GO:0061153 |
trachea submucosa development(GO:0061152) trachea gland development(GO:0061153) |
| 0.2 |
0.7 |
GO:0051892 |
negative regulation of cardioblast differentiation(GO:0051892) |
| 0.2 |
0.7 |
GO:0008582 |
regulation of synaptic growth at neuromuscular junction(GO:0008582) |
| 0.2 |
0.7 |
GO:0006597 |
spermine biosynthetic process(GO:0006597) |
| 0.2 |
1.3 |
GO:0006570 |
tyrosine metabolic process(GO:0006570) |
| 0.2 |
0.6 |
GO:0001951 |
intestinal D-glucose absorption(GO:0001951) terminal web assembly(GO:1902896) |
| 0.2 |
0.5 |
GO:2001015 |
G1 to G0 transition involved in cell differentiation(GO:0070315) negative regulation of skeletal muscle cell differentiation(GO:2001015) |
| 0.2 |
0.5 |
GO:0042320 |
regulation of circadian sleep/wake cycle, REM sleep(GO:0042320) circadian sleep/wake cycle, REM sleep(GO:0042747) positive regulation of circadian sleep/wake cycle, sleep(GO:0045938) |
| 0.2 |
0.8 |
GO:2000253 |
positive regulation of feeding behavior(GO:2000253) |
| 0.1 |
1.0 |
GO:0014816 |
skeletal muscle satellite cell differentiation(GO:0014816) |
| 0.1 |
0.4 |
GO:0072204 |
cell-cell signaling involved in kidney development(GO:0060995) Wnt signaling pathway involved in kidney development(GO:0061289) canonical Wnt signaling pathway involved in metanephric kidney development(GO:0061290) cell-cell signaling involved in metanephros development(GO:0072204) |
| 0.1 |
0.8 |
GO:0032196 |
transposition(GO:0032196) |
| 0.1 |
2.5 |
GO:1902043 |
positive regulation of extrinsic apoptotic signaling pathway via death domain receptors(GO:1902043) |
| 0.1 |
0.8 |
GO:0018230 |
peptidyl-L-cysteine S-palmitoylation(GO:0018230) peptidyl-S-diacylglycerol-L-cysteine biosynthetic process from peptidyl-cysteine(GO:0018231) |
| 0.1 |
0.5 |
GO:1904936 |
forebrain anterior/posterior pattern specification(GO:0021797) cerebral cortex GABAergic interneuron migration(GO:0021853) interneuron migration(GO:1904936) |
| 0.1 |
0.2 |
GO:0048014 |
Tie signaling pathway(GO:0048014) |
| 0.1 |
0.6 |
GO:0035845 |
photoreceptor cell outer segment organization(GO:0035845) |
| 0.1 |
0.2 |
GO:0006435 |
threonyl-tRNA aminoacylation(GO:0006435) |
| 0.1 |
1.0 |
GO:0016339 |
calcium-dependent cell-cell adhesion via plasma membrane cell adhesion molecules(GO:0016339) |
| 0.0 |
0.3 |
GO:0060539 |
diaphragm development(GO:0060539) |
| 0.0 |
1.9 |
GO:0060325 |
face morphogenesis(GO:0060325) |
| 0.0 |
0.6 |
GO:0071803 |
positive regulation of podosome assembly(GO:0071803) |
| 0.0 |
0.2 |
GO:0043490 |
malate-aspartate shuttle(GO:0043490) |
| 0.0 |
0.2 |
GO:0048312 |
intracellular distribution of mitochondria(GO:0048312) |
| 0.0 |
0.3 |
GO:0090073 |
positive regulation of protein homodimerization activity(GO:0090073) |
| 0.0 |
1.0 |
GO:0046677 |
response to antibiotic(GO:0046677) |
| 0.0 |
0.7 |
GO:0006825 |
copper ion transport(GO:0006825) |
| 0.0 |
0.2 |
GO:0045607 |
regulation of auditory receptor cell differentiation(GO:0045607) regulation of mechanoreceptor differentiation(GO:0045631) regulation of inner ear receptor cell differentiation(GO:2000980) |
| 0.0 |
0.7 |
GO:0006379 |
mRNA cleavage(GO:0006379) |
| 0.0 |
0.1 |
GO:0002051 |
osteoblast fate commitment(GO:0002051) |
| 0.0 |
0.1 |
GO:1901097 |
negative regulation of autophagosome maturation(GO:1901097) |
| 0.0 |
0.2 |
GO:1990118 |
sodium ion import across plasma membrane(GO:0098719) sodium ion import into cell(GO:1990118) |
| 0.0 |
0.3 |
GO:0015937 |
coenzyme A biosynthetic process(GO:0015937) |
| 0.0 |
0.3 |
GO:0007340 |
acrosome reaction(GO:0007340) |
| 0.0 |
0.4 |
GO:0019432 |
triglyceride biosynthetic process(GO:0019432) |
| 0.0 |
0.3 |
GO:0030833 |
regulation of actin filament polymerization(GO:0030833) |
| 0.0 |
0.3 |
GO:0043171 |
peptide catabolic process(GO:0043171) |
| 0.0 |
0.6 |
GO:2000134 |
negative regulation of G1/S transition of mitotic cell cycle(GO:2000134) |


