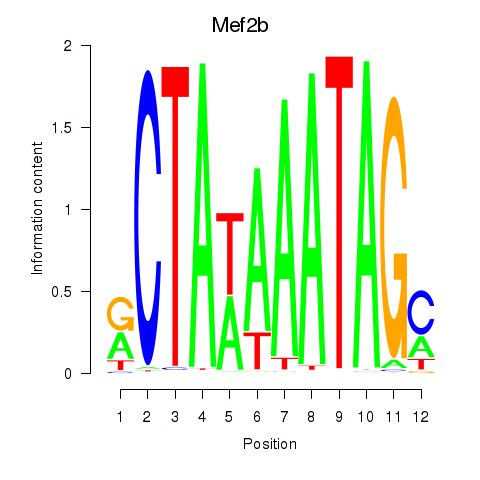
Motif ID: Mef2b
Z-value: 0.671
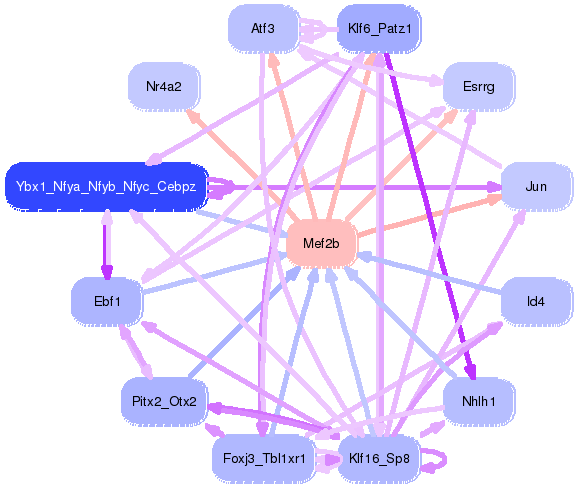
Transcription factors associated with Mef2b:
| Gene Symbol | Entrez ID | Gene Name |
|---|---|---|
| Mef2b | ENSMUSG00000079033.3 | Mef2b |
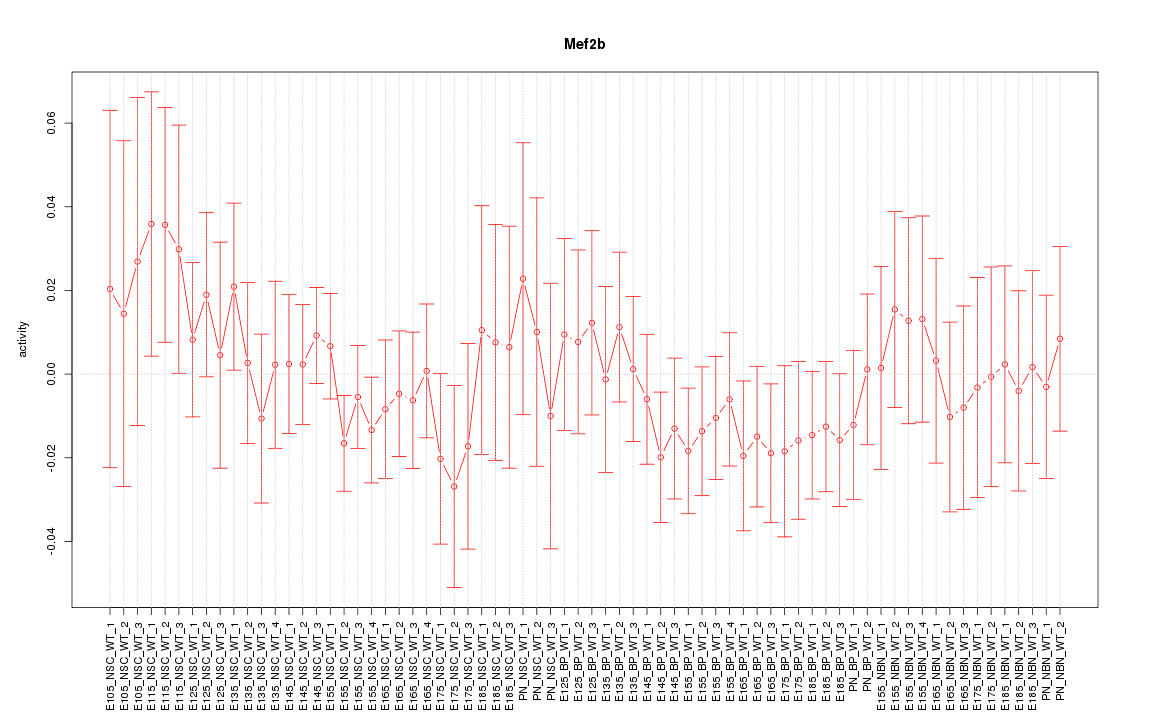
Activity-expression correlation:
| Gene Symbol | Promoter | Pearson corr. coef. | P-value | Plot |
|---|---|---|---|---|
| Mef2b | mm10_v2_chr8_+_70152754_70152781 | 0.19 | 1.1e-01 | Click! |


Top targets:
Gene overrepresentation in biological_process category:
| Log-likelihood per target | Total log-likelihood | Term | Description |
|---|---|---|---|
| 2.6 | 12.8 | GO:0015671 | oxygen transport(GO:0015671) |
| 1.8 | 9.0 | GO:0015705 | iodide transport(GO:0015705) |
| 1.5 | 6.0 | GO:0042414 | epinephrine metabolic process(GO:0042414) |
| 1.3 | 7.9 | GO:0021797 | forebrain anterior/posterior pattern specification(GO:0021797) |
| 1.2 | 3.6 | GO:1990481 | snoRNA guided rRNA pseudouridine synthesis(GO:0000454) snRNA pseudouridine synthesis(GO:0031120) mRNA pseudouridine synthesis(GO:1990481) |
| 1.0 | 3.0 | GO:0042908 | xenobiotic transport(GO:0042908) |
| 0.8 | 3.8 | GO:0045657 | positive regulation of monocyte differentiation(GO:0045657) cellular response to potassium ion starvation(GO:0051365) |
| 0.7 | 2.2 | GO:0070315 | G1 to G0 transition involved in cell differentiation(GO:0070315) |
| 0.6 | 1.7 | GO:0042264 | peptidyl-aspartic acid hydroxylation(GO:0042264) |
| 0.6 | 2.3 | GO:0019287 | isopentenyl diphosphate biosynthetic process(GO:0009240) isopentenyl diphosphate biosynthetic process, mevalonate pathway(GO:0019287) isopentenyl diphosphate metabolic process(GO:0046490) |
| 0.5 | 2.0 | GO:0010510 | regulation of acetyl-CoA biosynthetic process from pyruvate(GO:0010510) |
| 0.5 | 1.4 | GO:0070889 | platelet alpha granule organization(GO:0070889) |
| 0.4 | 1.5 | GO:1903984 | positive regulation of TRAIL-activated apoptotic signaling pathway(GO:1903984) |
| 0.4 | 2.2 | GO:0030644 | cellular chloride ion homeostasis(GO:0030644) |
| 0.4 | 0.7 | GO:0034372 | very-low-density lipoprotein particle remodeling(GO:0034372) |
| 0.4 | 1.1 | GO:0060023 | soft palate development(GO:0060023) |
| 0.4 | 1.8 | GO:0046601 | positive regulation of centriole replication(GO:0046601) |
| 0.3 | 1.0 | GO:1902310 | positive regulation of peptidyl-serine dephosphorylation(GO:1902310) |
| 0.3 | 1.3 | GO:0051866 | general adaptation syndrome(GO:0051866) |
| 0.3 | 1.6 | GO:0034196 | acylglycerol transport(GO:0034196) triglyceride transport(GO:0034197) |
| 0.3 | 0.6 | GO:2000468 | regulation of peroxidase activity(GO:2000468) |
| 0.3 | 1.3 | GO:1901164 | negative regulation of trophoblast cell migration(GO:1901164) |
| 0.2 | 0.9 | GO:0014835 | myoblast differentiation involved in skeletal muscle regeneration(GO:0014835) |
| 0.2 | 2.8 | GO:0060732 | positive regulation of inositol phosphate biosynthetic process(GO:0060732) |
| 0.2 | 0.6 | GO:1903225 | negative regulation of endodermal cell differentiation(GO:1903225) |
| 0.2 | 1.0 | GO:1900748 | positive regulation of vascular endothelial growth factor signaling pathway(GO:1900748) |
| 0.2 | 2.7 | GO:0038166 | angiotensin-activated signaling pathway(GO:0038166) |
| 0.2 | 2.2 | GO:0045723 | positive regulation of fatty acid biosynthetic process(GO:0045723) |
| 0.2 | 0.5 | GO:0003219 | atrioventricular node development(GO:0003162) cardiac right ventricle formation(GO:0003219) |
| 0.2 | 1.4 | GO:1900262 | regulation of DNA-directed DNA polymerase activity(GO:1900262) positive regulation of DNA-directed DNA polymerase activity(GO:1900264) |
| 0.2 | 3.7 | GO:0051044 | positive regulation of membrane protein ectodomain proteolysis(GO:0051044) |
| 0.2 | 0.8 | GO:0045347 | negative regulation of MHC class II biosynthetic process(GO:0045347) |
| 0.1 | 0.7 | GO:0075525 | viral translational termination-reinitiation(GO:0075525) |
| 0.1 | 1.2 | GO:0036506 | maintenance of unfolded protein(GO:0036506) maintenance of unfolded protein involved in ERAD pathway(GO:1904378) |
| 0.1 | 2.1 | GO:0042178 | xenobiotic catabolic process(GO:0042178) |
| 0.1 | 1.5 | GO:0045899 | positive regulation of RNA polymerase II transcriptional preinitiation complex assembly(GO:0045899) |
| 0.1 | 1.1 | GO:0071494 | cellular response to UV-C(GO:0071494) |
| 0.1 | 0.8 | GO:0001831 | trophectodermal cellular morphogenesis(GO:0001831) trophectodermal cell proliferation(GO:0001834) |
| 0.1 | 1.0 | GO:0045743 | positive regulation of fibroblast growth factor receptor signaling pathway(GO:0045743) |
| 0.1 | 0.3 | GO:0006419 | alanyl-tRNA aminoacylation(GO:0006419) |
| 0.1 | 1.4 | GO:0010388 | cullin deneddylation(GO:0010388) |
| 0.1 | 1.4 | GO:0015937 | coenzyme A biosynthetic process(GO:0015937) |
| 0.1 | 0.4 | GO:0072697 | protein localization to cell cortex(GO:0072697) |
| 0.1 | 0.5 | GO:0015879 | carnitine transport(GO:0015879) |
| 0.1 | 0.6 | GO:0043569 | negative regulation of insulin-like growth factor receptor signaling pathway(GO:0043569) |
| 0.1 | 0.3 | GO:0071376 | response to corticotropin-releasing hormone(GO:0043435) cellular response to corticotropin-releasing hormone stimulus(GO:0071376) |
| 0.1 | 4.1 | GO:0010501 | RNA secondary structure unwinding(GO:0010501) |
| 0.1 | 0.9 | GO:0090557 | establishment of endothelial intestinal barrier(GO:0090557) |
| 0.1 | 0.6 | GO:1903025 | regulation of RNA polymerase II regulatory region sequence-specific DNA binding(GO:1903025) |
| 0.1 | 0.7 | GO:0043615 | astrocyte cell migration(GO:0043615) |
| 0.1 | 0.7 | GO:0006706 | steroid catabolic process(GO:0006706) |
| 0.1 | 1.6 | GO:0010569 | regulation of double-strand break repair via homologous recombination(GO:0010569) |
| 0.1 | 0.5 | GO:0018230 | peptidyl-L-cysteine S-palmitoylation(GO:0018230) peptidyl-S-diacylglycerol-L-cysteine biosynthetic process from peptidyl-cysteine(GO:0018231) |
| 0.1 | 0.9 | GO:0017144 | drug metabolic process(GO:0017144) |
| 0.1 | 0.5 | GO:1901409 | regulation of phosphorylation of RNA polymerase II C-terminal domain(GO:1901407) positive regulation of phosphorylation of RNA polymerase II C-terminal domain(GO:1901409) |
| 0.1 | 0.3 | GO:0001705 | ectoderm formation(GO:0001705) ectodermal cell differentiation(GO:0010668) |
| 0.1 | 2.5 | GO:0032611 | interleukin-1 beta production(GO:0032611) |
| 0.0 | 0.4 | GO:0006450 | regulation of translational fidelity(GO:0006450) |
| 0.0 | 1.2 | GO:0071425 | hematopoietic stem cell proliferation(GO:0071425) |
| 0.0 | 0.5 | GO:1903504 | regulation of mitotic cell cycle spindle assembly checkpoint(GO:0090266) regulation of mitotic spindle checkpoint(GO:1903504) |
| 0.0 | 1.1 | GO:0030488 | tRNA methylation(GO:0030488) |
| 0.0 | 0.3 | GO:0035735 | intraciliary transport involved in cilium morphogenesis(GO:0035735) |
| 0.0 | 0.7 | GO:1902043 | positive regulation of extrinsic apoptotic signaling pathway via death domain receptors(GO:1902043) |
| 0.0 | 0.6 | GO:0071470 | cellular response to osmotic stress(GO:0071470) |
| 0.0 | 0.1 | GO:0002121 | inter-male aggressive behavior(GO:0002121) |
| 0.0 | 0.5 | GO:0046069 | cGMP catabolic process(GO:0046069) |
| 0.0 | 1.5 | GO:0051384 | response to glucocorticoid(GO:0051384) |
| 0.0 | 0.7 | GO:0048679 | regulation of axon regeneration(GO:0048679) |
| 0.0 | 0.1 | GO:2000780 | negative regulation of double-strand break repair(GO:2000780) |
| 0.0 | 2.7 | GO:0006694 | steroid biosynthetic process(GO:0006694) |
| 0.0 | 0.2 | GO:0019227 | neuronal action potential propagation(GO:0019227) action potential propagation(GO:0098870) |
| 0.0 | 0.7 | GO:0061045 | negative regulation of wound healing(GO:0061045) |
| 0.0 | 0.9 | GO:0048384 | retinoic acid receptor signaling pathway(GO:0048384) |
| 0.0 | 4.2 | GO:0042384 | cilium assembly(GO:0042384) |
| 0.0 | 0.4 | GO:0000027 | ribosomal large subunit assembly(GO:0000027) |
| 0.0 | 0.3 | GO:0045653 | negative regulation of megakaryocyte differentiation(GO:0045653) |
| 0.0 | 0.4 | GO:0045722 | positive regulation of gluconeogenesis(GO:0045722) |
| 0.0 | 0.9 | GO:0002224 | toll-like receptor signaling pathway(GO:0002224) |
| 0.0 | 0.5 | GO:0045103 | intermediate filament-based process(GO:0045103) |
| 0.0 | 0.1 | GO:0006398 | mRNA 3'-end processing by stem-loop binding and cleavage(GO:0006398) |
| 0.0 | 0.0 | GO:0009106 | lipoate metabolic process(GO:0009106) |
| 0.0 | 0.9 | GO:0006096 | glycolytic process(GO:0006096) ATP generation from ADP(GO:0006757) |
| 0.0 | 0.8 | GO:0031338 | regulation of vesicle fusion(GO:0031338) |
Gene overrepresentation in cellular_component category:
| Log-likelihood per target | Total log-likelihood | Term | Description |
|---|---|---|---|
| 1.6 | 12.8 | GO:0005833 | hemoglobin complex(GO:0005833) |
| 0.9 | 3.6 | GO:0090661 | box H/ACA telomerase RNP complex(GO:0090661) |
| 0.3 | 1.7 | GO:0032541 | cortical endoplasmic reticulum(GO:0032541) |
| 0.3 | 1.0 | GO:0045160 | myosin I complex(GO:0045160) |
| 0.3 | 3.1 | GO:0001939 | female pronucleus(GO:0001939) |
| 0.2 | 6.0 | GO:0042470 | melanosome(GO:0042470) pigment granule(GO:0048770) |
| 0.2 | 1.2 | GO:0000015 | phosphopyruvate hydratase complex(GO:0000015) |
| 0.2 | 1.4 | GO:0005663 | DNA replication factor C complex(GO:0005663) |
| 0.2 | 9.5 | GO:0034707 | chloride channel complex(GO:0034707) |
| 0.2 | 1.8 | GO:0098536 | deuterosome(GO:0098536) |
| 0.2 | 0.6 | GO:0005588 | collagen type V trimer(GO:0005588) |
| 0.2 | 0.6 | GO:0044754 | amphisome(GO:0044753) autolysosome(GO:0044754) |
| 0.2 | 1.5 | GO:0031595 | nuclear proteasome complex(GO:0031595) |
| 0.1 | 2.1 | GO:0031528 | microvillus membrane(GO:0031528) |
| 0.1 | 1.1 | GO:0098643 | fibrillar collagen trimer(GO:0005583) banded collagen fibril(GO:0098643) |
| 0.1 | 0.5 | GO:0002193 | MAML1-RBP-Jkappa- ICN1 complex(GO:0002193) |
| 0.1 | 3.8 | GO:0005719 | nuclear euchromatin(GO:0005719) |
| 0.1 | 2.7 | GO:0032839 | dendrite cytoplasm(GO:0032839) |
| 0.1 | 0.7 | GO:0071541 | eukaryotic translation initiation factor 3 complex, eIF3m(GO:0071541) |
| 0.1 | 0.5 | GO:0002178 | palmitoyltransferase complex(GO:0002178) |
| 0.0 | 0.5 | GO:0031091 | platelet alpha granule(GO:0031091) |
| 0.0 | 0.6 | GO:0032593 | insulin-responsive compartment(GO:0032593) |
| 0.0 | 4.2 | GO:0005814 | centriole(GO:0005814) |
| 0.0 | 2.6 | GO:0031526 | brush border membrane(GO:0031526) |
| 0.0 | 0.7 | GO:0034364 | high-density lipoprotein particle(GO:0034364) |
| 0.0 | 0.7 | GO:0008305 | integrin complex(GO:0008305) protein complex involved in cell adhesion(GO:0098636) |
| 0.0 | 1.3 | GO:0008180 | COP9 signalosome(GO:0008180) |
| 0.0 | 0.4 | GO:0005665 | DNA-directed RNA polymerase II, core complex(GO:0005665) |
| 0.0 | 4.1 | GO:0036464 | cytoplasmic ribonucleoprotein granule(GO:0036464) |
| 0.0 | 1.8 | GO:0036126 | sperm flagellum(GO:0036126) |
| 0.0 | 1.5 | GO:0005758 | mitochondrial intermembrane space(GO:0005758) |
| 0.0 | 0.5 | GO:0005680 | anaphase-promoting complex(GO:0005680) |
| 0.0 | 1.4 | GO:0030118 | clathrin coat(GO:0030118) |
| 0.0 | 0.7 | GO:0014704 | intercalated disc(GO:0014704) |
| 0.0 | 1.5 | GO:0030315 | T-tubule(GO:0030315) |
| 0.0 | 0.5 | GO:0008023 | transcription elongation factor complex(GO:0008023) |
| 0.0 | 1.0 | GO:0031012 | extracellular matrix(GO:0031012) |
| 0.0 | 0.7 | GO:0031225 | anchored component of membrane(GO:0031225) |
Gene overrepresentation in molecular_function category:
| Log-likelihood per target | Total log-likelihood | Term | Description |
|---|---|---|---|
| 3.2 | 12.8 | GO:0031721 | hemoglobin alpha binding(GO:0031721) |
| 2.3 | 9.0 | GO:0015111 | iodide transmembrane transporter activity(GO:0015111) |
| 1.0 | 6.0 | GO:0035240 | dopamine binding(GO:0035240) |
| 0.9 | 2.7 | GO:0004769 | steroid delta-isomerase activity(GO:0004769) |
| 0.9 | 3.6 | GO:0055056 | D-glucose transmembrane transporter activity(GO:0055056) |
| 0.9 | 3.6 | GO:0034513 | box H/ACA snoRNA binding(GO:0034513) |
| 0.6 | 2.2 | GO:0004111 | creatine kinase activity(GO:0004111) |
| 0.5 | 2.0 | GO:0004740 | pyruvate dehydrogenase (acetyl-transferring) kinase activity(GO:0004740) |
| 0.4 | 1.2 | GO:0004566 | beta-glucuronidase activity(GO:0004566) |
| 0.4 | 1.1 | GO:0003953 | NAD+ nucleosidase activity(GO:0003953) |
| 0.3 | 1.0 | GO:0004647 | phosphoserine phosphatase activity(GO:0004647) |
| 0.3 | 1.7 | GO:0051525 | NFAT protein binding(GO:0051525) |
| 0.3 | 1.4 | GO:0004594 | pantothenate kinase activity(GO:0004594) |
| 0.3 | 2.2 | GO:0031432 | titin binding(GO:0031432) |
| 0.2 | 3.7 | GO:0019855 | calcium channel inhibitor activity(GO:0019855) |
| 0.2 | 1.2 | GO:1904288 | BAT3 complex binding(GO:1904288) |
| 0.2 | 1.5 | GO:0036402 | proteasome-activating ATPase activity(GO:0036402) |
| 0.2 | 3.8 | GO:0035497 | cAMP response element binding(GO:0035497) |
| 0.2 | 0.9 | GO:0008392 | arachidonic acid monooxygenase activity(GO:0008391) arachidonic acid epoxygenase activity(GO:0008392) |
| 0.2 | 1.3 | GO:0005094 | Rho GDP-dissociation inhibitor activity(GO:0005094) |
| 0.2 | 0.7 | GO:0034186 | apolipoprotein A-I binding(GO:0034186) |
| 0.2 | 0.5 | GO:0005124 | scavenger receptor binding(GO:0005124) |
| 0.2 | 0.7 | GO:0098634 | protein binding involved in cell-matrix adhesion(GO:0098634) collagen binding involved in cell-matrix adhesion(GO:0098639) |
| 0.2 | 0.8 | GO:1990825 | sequence-specific mRNA binding(GO:1990825) |
| 0.2 | 2.1 | GO:0005536 | glucose binding(GO:0005536) |
| 0.1 | 1.2 | GO:0004634 | phosphopyruvate hydratase activity(GO:0004634) |
| 0.1 | 1.4 | GO:0003689 | DNA clamp loader activity(GO:0003689) protein-DNA loading ATPase activity(GO:0033170) |
| 0.1 | 2.1 | GO:0070402 | NADPH binding(GO:0070402) |
| 0.1 | 2.7 | GO:0032794 | GTPase activating protein binding(GO:0032794) |
| 0.1 | 0.3 | GO:0004813 | alanine-tRNA ligase activity(GO:0004813) |
| 0.1 | 2.8 | GO:0017046 | peptide hormone binding(GO:0017046) |
| 0.1 | 0.9 | GO:0031957 | very long-chain fatty acid-CoA ligase activity(GO:0031957) |
| 0.1 | 1.6 | GO:0034185 | apolipoprotein binding(GO:0034185) |
| 0.1 | 2.5 | GO:0035259 | glucocorticoid receptor binding(GO:0035259) |
| 0.1 | 1.0 | GO:0030898 | actin-dependent ATPase activity(GO:0030898) |
| 0.1 | 0.5 | GO:0048101 | calcium- and calmodulin-regulated 3',5'-cyclic-GMP phosphodiesterase activity(GO:0048101) |
| 0.1 | 0.6 | GO:0004445 | inositol-polyphosphate 5-phosphatase activity(GO:0004445) |
| 0.1 | 4.1 | GO:0008186 | ATP-dependent RNA helicase activity(GO:0004004) RNA-dependent ATPase activity(GO:0008186) |
| 0.1 | 0.4 | GO:0008097 | 5S rRNA binding(GO:0008097) |
| 0.1 | 0.6 | GO:0097027 | ubiquitin-protein transferase activator activity(GO:0097027) |
| 0.0 | 0.1 | GO:0008534 | oxidized purine nucleobase lesion DNA N-glycosylase activity(GO:0008534) |
| 0.0 | 1.9 | GO:0043027 | cysteine-type endopeptidase inhibitor activity involved in apoptotic process(GO:0043027) |
| 0.0 | 1.7 | GO:0005201 | extracellular matrix structural constituent(GO:0005201) |
| 0.0 | 0.9 | GO:0003708 | retinoic acid receptor activity(GO:0003708) |
| 0.0 | 0.2 | GO:0004095 | carnitine O-palmitoyltransferase activity(GO:0004095) |
| 0.0 | 0.6 | GO:0034211 | GTP-dependent protein kinase activity(GO:0034211) |
| 0.0 | 0.4 | GO:0001055 | RNA polymerase II activity(GO:0001055) |
| 0.0 | 0.2 | GO:0015467 | G-protein activated inward rectifier potassium channel activity(GO:0015467) |
| 0.0 | 1.2 | GO:0031624 | ubiquitin conjugating enzyme binding(GO:0031624) |
| 0.0 | 1.7 | GO:0000049 | tRNA binding(GO:0000049) |
| 0.0 | 1.0 | GO:0017134 | fibroblast growth factor binding(GO:0017134) |
| 0.0 | 0.7 | GO:0048020 | CCR chemokine receptor binding(GO:0048020) |
| 0.0 | 5.4 | GO:0001227 | transcriptional repressor activity, RNA polymerase II transcription regulatory region sequence-specific binding(GO:0001227) |
| 0.0 | 1.7 | GO:0016706 | oxidoreductase activity, acting on paired donors, with incorporation or reduction of molecular oxygen, 2-oxoglutarate as one donor, and incorporation of one atom each of oxygen into both donors(GO:0016706) |
| 0.0 | 0.5 | GO:0019706 | protein-cysteine S-palmitoyltransferase activity(GO:0019706) |
| 0.0 | 0.5 | GO:0005112 | Notch binding(GO:0005112) |
| 0.0 | 0.7 | GO:0031369 | translation initiation factor binding(GO:0031369) |
| 0.0 | 1.5 | GO:0051082 | unfolded protein binding(GO:0051082) |
| 0.0 | 0.8 | GO:0003707 | steroid hormone receptor activity(GO:0003707) |
| 0.0 | 0.1 | GO:1904264 | ubiquitin protein ligase activity involved in ERAD pathway(GO:1904264) |
| 0.0 | 0.2 | GO:0005247 | voltage-gated chloride channel activity(GO:0005247) |
| 0.0 | 0.7 | GO:0004867 | serine-type endopeptidase inhibitor activity(GO:0004867) |
| 0.0 | 1.6 | GO:0003697 | single-stranded DNA binding(GO:0003697) |
| 0.0 | 0.5 | GO:0016538 | cyclin-dependent protein serine/threonine kinase regulator activity(GO:0016538) |
| 0.0 | 1.1 | GO:0051219 | phosphoprotein binding(GO:0051219) |