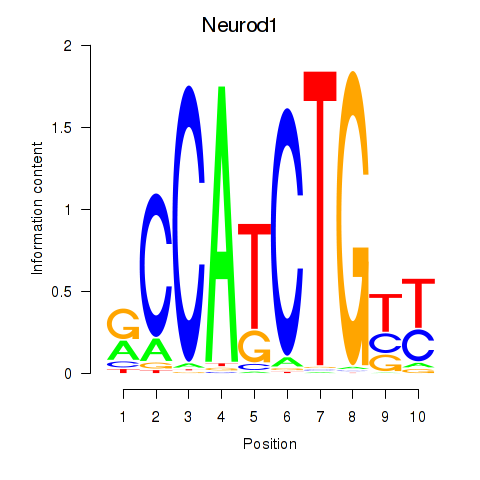
Motif ID: Neurod1
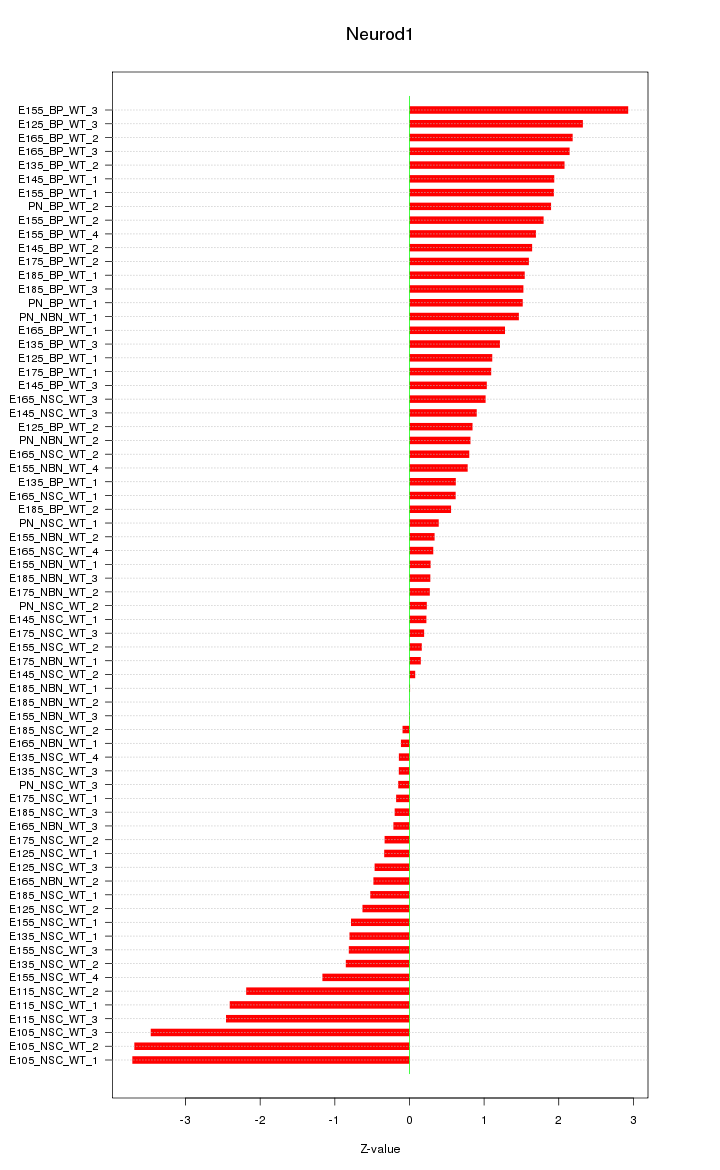
Z-value: 1.383
Transcription factors associated with Neurod1:
| Gene Symbol | Entrez ID | Gene Name |
|---|---|---|
| Neurod1 | ENSMUSG00000034701.9 | Neurod1 |
Activity-expression correlation:
| Gene Symbol | Promoter | Pearson corr. coef. | P-value | Plot |
|---|---|---|---|---|
| Neurod1 | mm10_v2_chr2_-_79456750_79456761 | 0.78 | 1.1e-15 | Click! |

Top targets:
Gene overrepresentation in biological_process category:
| Log-likelihood per target | Total log-likelihood | Term | Description |
|---|---|---|---|
| 9.3 | 27.9 | GO:2000297 | negative regulation of synapse maturation(GO:2000297) |
| 5.5 | 16.5 | GO:1900673 | olefin metabolic process(GO:1900673) |
| 3.1 | 9.2 | GO:0097401 | synaptic vesicle lumen acidification(GO:0097401) |
| 2.5 | 14.8 | GO:0060040 | retinal bipolar neuron differentiation(GO:0060040) |
| 2.1 | 42.8 | GO:0021542 | dentate gyrus development(GO:0021542) |
| 1.7 | 18.2 | GO:0010650 | positive regulation of cell communication by electrical coupling(GO:0010650) positive regulation of membrane depolarization during cardiac muscle cell action potential(GO:1900827) |
| 1.5 | 12.3 | GO:0005513 | detection of calcium ion(GO:0005513) |
| 1.5 | 5.8 | GO:1904451 | regulation of hydrogen:potassium-exchanging ATPase activity(GO:1904451) positive regulation of hydrogen:potassium-exchanging ATPase activity(GO:1904453) |
| 1.4 | 8.2 | GO:2000304 | positive regulation of sphingolipid biosynthetic process(GO:0090154) positive regulation of ceramide biosynthetic process(GO:2000304) |
| 1.3 | 4.0 | GO:0007521 | muscle cell fate determination(GO:0007521) cellular response to parathyroid hormone stimulus(GO:0071374) positive regulation of macrophage apoptotic process(GO:2000111) |
| 1.3 | 10.1 | GO:0050908 | detection of light stimulus involved in visual perception(GO:0050908) detection of light stimulus involved in sensory perception(GO:0050962) |
| 1.2 | 19.8 | GO:0050966 | detection of mechanical stimulus involved in sensory perception of pain(GO:0050966) |
| 1.2 | 26.9 | GO:0048268 | clathrin coat assembly(GO:0048268) |
| 1.2 | 6.1 | GO:0006543 | glutamine catabolic process(GO:0006543) |
| 1.0 | 4.2 | GO:1903347 | negative regulation of bicellular tight junction assembly(GO:1903347) |
| 1.0 | 10.3 | GO:0048742 | regulation of skeletal muscle fiber development(GO:0048742) |
| 1.0 | 5.1 | GO:0010724 | regulation of definitive erythrocyte differentiation(GO:0010724) |
| 1.0 | 8.0 | GO:0038026 | reelin-mediated signaling pathway(GO:0038026) |
| 1.0 | 7.7 | GO:0033564 | anterior/posterior axon guidance(GO:0033564) |
| 0.9 | 5.6 | GO:0050861 | positive regulation of B cell receptor signaling pathway(GO:0050861) |
| 0.9 | 2.8 | GO:0046340 | diacylglycerol catabolic process(GO:0046340) |
| 0.8 | 2.5 | GO:0043696 | dedifferentiation(GO:0043696) cell dedifferentiation(GO:0043697) |
| 0.8 | 4.2 | GO:1903361 | protein localization to basolateral plasma membrane(GO:1903361) |
| 0.8 | 9.2 | GO:0032482 | Rab protein signal transduction(GO:0032482) |
| 0.8 | 9.2 | GO:0051823 | regulation of synapse structural plasticity(GO:0051823) |
| 0.8 | 13.4 | GO:2000821 | AMPA glutamate receptor clustering(GO:0097113) glutamate receptor clustering(GO:0097688) regulation of grooming behavior(GO:2000821) |
| 0.8 | 3.3 | GO:0014043 | negative regulation of neuron maturation(GO:0014043) |
| 0.8 | 16.6 | GO:0019835 | cytolysis(GO:0019835) |
| 0.7 | 5.2 | GO:0043569 | negative regulation of insulin-like growth factor receptor signaling pathway(GO:0043569) |
| 0.7 | 3.5 | GO:0035331 | negative regulation of hippo signaling(GO:0035331) |
| 0.7 | 3.5 | GO:1903215 | negative regulation of protein targeting to mitochondrion(GO:1903215) |
| 0.7 | 3.4 | GO:1902683 | regulation of receptor localization to synapse(GO:1902683) excitatory synapse assembly(GO:1904861) |
| 0.7 | 4.0 | GO:0030913 | paranodal junction assembly(GO:0030913) |
| 0.6 | 5.8 | GO:0030035 | microspike assembly(GO:0030035) |
| 0.6 | 3.2 | GO:0046598 | positive regulation of viral entry into host cell(GO:0046598) |
| 0.6 | 4.4 | GO:0005981 | regulation of glycogen catabolic process(GO:0005981) |
| 0.6 | 3.1 | GO:2000574 | regulation of microtubule motor activity(GO:2000574) |
| 0.6 | 3.0 | GO:0008655 | pyrimidine-containing compound salvage(GO:0008655) pyrimidine nucleoside salvage(GO:0043097) |
| 0.6 | 4.2 | GO:1903715 | regulation of aerobic respiration(GO:1903715) |
| 0.6 | 8.3 | GO:0009312 | oligosaccharide biosynthetic process(GO:0009312) |
| 0.6 | 7.4 | GO:0021869 | forebrain ventricular zone progenitor cell division(GO:0021869) |
| 0.6 | 2.8 | GO:0098903 | regulation of membrane repolarization during action potential(GO:0098903) |
| 0.6 | 4.5 | GO:0042095 | activation of MAPKKK activity(GO:0000185) interferon-gamma biosynthetic process(GO:0042095) |
| 0.5 | 4.9 | GO:0019800 | peptide cross-linking via chondroitin 4-sulfate glycosaminoglycan(GO:0019800) |
| 0.5 | 2.1 | GO:0031509 | telomeric heterochromatin assembly(GO:0031509) negative regulation of chromosome condensation(GO:1902340) |
| 0.5 | 1.6 | GO:0035582 | sequestering of BMP in extracellular matrix(GO:0035582) |
| 0.5 | 9.4 | GO:2000311 | regulation of alpha-amino-3-hydroxy-5-methyl-4-isoxazole propionate selective glutamate receptor activity(GO:2000311) |
| 0.5 | 2.1 | GO:0042636 | striatal medium spiny neuron differentiation(GO:0021773) negative regulation of hair cycle(GO:0042636) negative regulation of hair follicle development(GO:0051799) |
| 0.5 | 4.6 | GO:0098907 | protein localization to M-band(GO:0036309) protein localization to T-tubule(GO:0036371) regulation of SA node cell action potential(GO:0098907) |
| 0.5 | 4.1 | GO:0031848 | protection from non-homologous end joining at telomere(GO:0031848) |
| 0.5 | 10.0 | GO:0071378 | growth hormone receptor signaling pathway(GO:0060396) cellular response to growth hormone stimulus(GO:0071378) |
| 0.5 | 2.0 | GO:0099624 | regulation of atrial cardiac muscle cell membrane repolarization(GO:0060372) atrial cardiac muscle cell membrane repolarization(GO:0099624) |
| 0.5 | 21.1 | GO:0007157 | heterophilic cell-cell adhesion via plasma membrane cell adhesion molecules(GO:0007157) |
| 0.5 | 2.7 | GO:0032796 | uropod organization(GO:0032796) |
| 0.4 | 13.6 | GO:0034723 | DNA replication-dependent nucleosome assembly(GO:0006335) DNA replication-dependent nucleosome organization(GO:0034723) |
| 0.4 | 2.1 | GO:0071476 | hypotonic response(GO:0006971) cellular hypotonic response(GO:0071476) |
| 0.4 | 14.8 | GO:0032728 | positive regulation of interferon-beta production(GO:0032728) |
| 0.4 | 2.1 | GO:0010991 | negative regulation of SMAD protein complex assembly(GO:0010991) |
| 0.4 | 2.8 | GO:0006646 | phosphatidylethanolamine biosynthetic process(GO:0006646) |
| 0.4 | 4.0 | GO:0009404 | toxin metabolic process(GO:0009404) |
| 0.4 | 3.1 | GO:1903025 | regulation of RNA polymerase II regulatory region sequence-specific DNA binding(GO:1903025) |
| 0.4 | 6.0 | GO:0002091 | negative regulation of receptor internalization(GO:0002091) |
| 0.4 | 4.5 | GO:0043374 | CD8-positive, alpha-beta T cell differentiation(GO:0043374) |
| 0.4 | 4.4 | GO:1904262 | negative regulation of TORC1 signaling(GO:1904262) |
| 0.4 | 1.8 | GO:0007386 | compartment pattern specification(GO:0007386) |
| 0.3 | 1.9 | GO:0070278 | extracellular matrix constituent secretion(GO:0070278) |
| 0.3 | 3.1 | GO:0042996 | regulation of Golgi to plasma membrane protein transport(GO:0042996) |
| 0.3 | 7.2 | GO:0097352 | autophagosome maturation(GO:0097352) |
| 0.3 | 3.9 | GO:1901898 | negative regulation of relaxation of muscle(GO:1901078) regulation of cell communication by electrical coupling involved in cardiac conduction(GO:1901844) negative regulation of relaxation of cardiac muscle(GO:1901898) |
| 0.3 | 7.5 | GO:0015813 | L-glutamate transport(GO:0015813) |
| 0.3 | 1.8 | GO:0051967 | negative regulation of synaptic transmission, glutamatergic(GO:0051967) |
| 0.2 | 4.0 | GO:0086001 | cardiac muscle cell action potential(GO:0086001) |
| 0.2 | 13.7 | GO:0048168 | regulation of neuronal synaptic plasticity(GO:0048168) |
| 0.2 | 2.6 | GO:0031936 | negative regulation of chromatin silencing(GO:0031936) |
| 0.2 | 0.9 | GO:0097369 | sodium ion import(GO:0097369) sodium ion import across plasma membrane(GO:0098719) sodium ion import into cell(GO:1990118) |
| 0.2 | 7.9 | GO:0007218 | neuropeptide signaling pathway(GO:0007218) |
| 0.2 | 7.8 | GO:0030901 | midbrain development(GO:0030901) |
| 0.2 | 1.0 | GO:0007258 | JUN phosphorylation(GO:0007258) |
| 0.2 | 1.7 | GO:0090050 | positive regulation of cell migration involved in sprouting angiogenesis(GO:0090050) |
| 0.2 | 5.0 | GO:0000470 | maturation of LSU-rRNA(GO:0000470) |
| 0.2 | 1.5 | GO:0075522 | IRES-dependent viral translational initiation(GO:0075522) |
| 0.2 | 2.9 | GO:0046069 | cGMP catabolic process(GO:0046069) |
| 0.2 | 16.4 | GO:0002028 | regulation of sodium ion transport(GO:0002028) |
| 0.2 | 29.9 | GO:0050808 | synapse organization(GO:0050808) |
| 0.1 | 4.3 | GO:0001523 | retinoid metabolic process(GO:0001523) |
| 0.1 | 0.4 | GO:0043456 | regulation of pentose-phosphate shunt(GO:0043456) |
| 0.1 | 0.9 | GO:0031340 | positive regulation of vesicle fusion(GO:0031340) |
| 0.1 | 5.0 | GO:1904893 | negative regulation of JAK-STAT cascade(GO:0046426) negative regulation of STAT cascade(GO:1904893) |
| 0.1 | 11.4 | GO:1900006 | positive regulation of dendrite development(GO:1900006) |
| 0.1 | 2.7 | GO:0010719 | negative regulation of epithelial to mesenchymal transition(GO:0010719) |
| 0.1 | 3.1 | GO:0032410 | negative regulation of transporter activity(GO:0032410) |
| 0.1 | 3.7 | GO:0035136 | forelimb morphogenesis(GO:0035136) |
| 0.1 | 1.0 | GO:0002315 | marginal zone B cell differentiation(GO:0002315) |
| 0.1 | 1.0 | GO:0006013 | mannose metabolic process(GO:0006013) |
| 0.1 | 1.8 | GO:0001574 | ganglioside biosynthetic process(GO:0001574) |
| 0.1 | 1.3 | GO:0080111 | DNA demethylation(GO:0080111) |
| 0.1 | 1.1 | GO:1904587 | glycoprotein ERAD pathway(GO:0097466) response to glycoprotein(GO:1904587) |
| 0.1 | 0.6 | GO:0007089 | traversing start control point of mitotic cell cycle(GO:0007089) |
| 0.1 | 1.0 | GO:0048096 | chromatin-mediated maintenance of transcription(GO:0048096) |
| 0.1 | 0.6 | GO:0060017 | parathyroid gland development(GO:0060017) |
| 0.1 | 2.4 | GO:0003301 | physiological muscle hypertrophy(GO:0003298) physiological cardiac muscle hypertrophy(GO:0003301) cell growth involved in cardiac muscle cell development(GO:0061049) |
| 0.1 | 0.8 | GO:0043206 | extracellular fibril organization(GO:0043206) |
| 0.1 | 0.8 | GO:0018230 | peptidyl-L-cysteine S-palmitoylation(GO:0018230) peptidyl-S-diacylglycerol-L-cysteine biosynthetic process from peptidyl-cysteine(GO:0018231) |
| 0.1 | 2.6 | GO:0032456 | endocytic recycling(GO:0032456) |
| 0.1 | 0.8 | GO:1903861 | dendrite extension(GO:0097484) regulation of dendrite extension(GO:1903859) positive regulation of dendrite extension(GO:1903861) |
| 0.1 | 3.3 | GO:0006376 | mRNA splice site selection(GO:0006376) |
| 0.1 | 0.6 | GO:1902414 | protein localization to cell junction(GO:1902414) |
| 0.1 | 7.9 | GO:0051291 | protein heterooligomerization(GO:0051291) |
| 0.1 | 0.3 | GO:0030576 | Cajal body organization(GO:0030576) |
| 0.1 | 0.9 | GO:0050909 | sensory perception of taste(GO:0050909) |
| 0.1 | 0.4 | GO:0030578 | PML body organization(GO:0030578) |
| 0.1 | 6.5 | GO:0007030 | Golgi organization(GO:0007030) |
| 0.1 | 1.9 | GO:0090162 | establishment of epithelial cell polarity(GO:0090162) |
| 0.1 | 3.6 | GO:0030032 | lamellipodium assembly(GO:0030032) |
| 0.1 | 2.2 | GO:0048821 | erythrocyte development(GO:0048821) |
| 0.0 | 0.1 | GO:0016264 | gap junction assembly(GO:0016264) |
| 0.0 | 0.7 | GO:0006182 | cGMP biosynthetic process(GO:0006182) |
| 0.0 | 0.8 | GO:0045947 | negative regulation of translational initiation(GO:0045947) |
| 0.0 | 0.2 | GO:1900042 | positive regulation of interleukin-2 secretion(GO:1900042) |
| 0.0 | 0.2 | GO:0034724 | DNA replication-independent nucleosome assembly(GO:0006336) DNA replication-independent nucleosome organization(GO:0034724) |
| 0.0 | 6.0 | GO:0030705 | cytoskeleton-dependent intracellular transport(GO:0030705) |
| 0.0 | 1.5 | GO:0006970 | response to osmotic stress(GO:0006970) |
| 0.0 | 2.0 | GO:0030042 | actin filament depolymerization(GO:0030042) |
| 0.0 | 7.7 | GO:0043523 | regulation of neuron apoptotic process(GO:0043523) |
| 0.0 | 2.3 | GO:0010508 | positive regulation of autophagy(GO:0010508) |
| 0.0 | 0.8 | GO:0045214 | sarcomere organization(GO:0045214) |
| 0.0 | 3.3 | GO:0043123 | positive regulation of I-kappaB kinase/NF-kappaB signaling(GO:0043123) |
| 0.0 | 8.9 | GO:0007059 | chromosome segregation(GO:0007059) |
| 0.0 | 0.5 | GO:0008210 | estrogen metabolic process(GO:0008210) |
| 0.0 | 3.1 | GO:0060041 | retina development in camera-type eye(GO:0060041) |
| 0.0 | 0.7 | GO:0016925 | protein sumoylation(GO:0016925) |
| 0.0 | 0.3 | GO:0046827 | positive regulation of protein export from nucleus(GO:0046827) |
| 0.0 | 0.4 | GO:0006890 | retrograde vesicle-mediated transport, Golgi to ER(GO:0006890) |
| 0.0 | 0.2 | GO:0010831 | positive regulation of myotube differentiation(GO:0010831) |
Gene overrepresentation in cellular_component category:
| Log-likelihood per target | Total log-likelihood | Term | Description |
|---|---|---|---|
| 4.1 | 16.5 | GO:0044307 | dendritic branch(GO:0044307) |
| 1.5 | 13.1 | GO:0043083 | synaptic cleft(GO:0043083) |
| 1.5 | 5.8 | GO:1990795 | lateral part of cell(GO:0097574) basolateral part of cell(GO:1990794) rod bipolar cell terminal bouton(GO:1990795) |
| 1.1 | 22.6 | GO:0044300 | cerebellar mossy fiber(GO:0044300) |
| 1.0 | 20.4 | GO:0014731 | spectrin-associated cytoskeleton(GO:0014731) |
| 1.0 | 7.0 | GO:0090571 | RNA polymerase II transcription repressor complex(GO:0090571) |
| 0.8 | 12.3 | GO:0031045 | dense core granule(GO:0031045) |
| 0.8 | 10.3 | GO:0042788 | polysomal ribosome(GO:0042788) |
| 0.7 | 8.2 | GO:0000137 | Golgi cis cisterna(GO:0000137) |
| 0.7 | 2.1 | GO:0043512 | inhibin A complex(GO:0043512) |
| 0.6 | 19.3 | GO:0032809 | neuronal cell body membrane(GO:0032809) |
| 0.5 | 2.6 | GO:1990745 | EARP complex(GO:1990745) |
| 0.5 | 5.0 | GO:0070545 | PeBoW complex(GO:0070545) |
| 0.5 | 4.4 | GO:0042587 | glycogen granule(GO:0042587) |
| 0.5 | 15.7 | GO:0000788 | nuclear nucleosome(GO:0000788) |
| 0.4 | 4.4 | GO:0061700 | GATOR2 complex(GO:0061700) |
| 0.4 | 16.8 | GO:0005891 | voltage-gated calcium channel complex(GO:0005891) |
| 0.4 | 7.2 | GO:0000421 | autophagosome membrane(GO:0000421) |
| 0.4 | 5.9 | GO:0042101 | T cell receptor complex(GO:0042101) |
| 0.4 | 4.8 | GO:0017146 | NMDA selective glutamate receptor complex(GO:0017146) |
| 0.3 | 5.2 | GO:0042405 | nuclear inclusion body(GO:0042405) |
| 0.3 | 1.0 | GO:0044302 | dentate gyrus mossy fiber(GO:0044302) |
| 0.3 | 13.7 | GO:0005790 | smooth endoplasmic reticulum(GO:0005790) |
| 0.3 | 9.4 | GO:0032281 | AMPA glutamate receptor complex(GO:0032281) |
| 0.3 | 4.1 | GO:0070419 | nonhomologous end joining complex(GO:0070419) |
| 0.3 | 2.2 | GO:0005786 | signal recognition particle, endoplasmic reticulum targeting(GO:0005786) signal recognition particle(GO:0048500) |
| 0.2 | 4.6 | GO:0031430 | M band(GO:0031430) |
| 0.2 | 0.8 | GO:1990452 | Parkin-FBXW7-Cul1 ubiquitin ligase complex(GO:1990452) |
| 0.2 | 1.3 | GO:0001940 | male pronucleus(GO:0001940) |
| 0.2 | 7.6 | GO:0005637 | nuclear inner membrane(GO:0005637) |
| 0.2 | 1.5 | GO:0071541 | eukaryotic translation initiation factor 3 complex, eIF3m(GO:0071541) |
| 0.2 | 11.1 | GO:0008076 | voltage-gated potassium channel complex(GO:0008076) |
| 0.1 | 2.9 | GO:0001891 | phagocytic cup(GO:0001891) |
| 0.1 | 6.2 | GO:0060170 | ciliary membrane(GO:0060170) |
| 0.1 | 1.1 | GO:0044322 | endoplasmic reticulum quality control compartment(GO:0044322) |
| 0.1 | 26.7 | GO:0014069 | postsynaptic density(GO:0014069) postsynaptic specialization(GO:0099572) |
| 0.1 | 30.2 | GO:0045211 | postsynaptic membrane(GO:0045211) |
| 0.1 | 4.3 | GO:0044295 | axonal growth cone(GO:0044295) |
| 0.1 | 6.0 | GO:0005871 | kinesin complex(GO:0005871) |
| 0.1 | 1.7 | GO:0035102 | PRC1 complex(GO:0035102) |
| 0.1 | 5.6 | GO:0031526 | brush border membrane(GO:0031526) |
| 0.1 | 0.8 | GO:0002178 | palmitoyltransferase complex(GO:0002178) |
| 0.1 | 0.7 | GO:0008074 | guanylate cyclase complex, soluble(GO:0008074) |
| 0.1 | 3.9 | GO:0031201 | SNARE complex(GO:0031201) |
| 0.1 | 2.2 | GO:0046658 | anchored component of plasma membrane(GO:0046658) |
| 0.1 | 3.6 | GO:0030667 | secretory granule membrane(GO:0030667) |
| 0.1 | 4.7 | GO:0032587 | ruffle membrane(GO:0032587) |
| 0.1 | 0.8 | GO:0072669 | tRNA-splicing ligase complex(GO:0072669) |
| 0.1 | 5.7 | GO:0035097 | histone methyltransferase complex(GO:0035097) |
| 0.1 | 2.1 | GO:0031901 | early endosome membrane(GO:0031901) |
| 0.1 | 1.9 | GO:0055038 | recycling endosome membrane(GO:0055038) |
| 0.1 | 0.2 | GO:0070436 | Grb2-EGFR complex(GO:0070436) |
| 0.1 | 2.7 | GO:0030173 | integral component of Golgi membrane(GO:0030173) intrinsic component of Golgi membrane(GO:0031228) |
| 0.0 | 4.9 | GO:0016605 | PML body(GO:0016605) |
| 0.0 | 5.6 | GO:0005759 | mitochondrial matrix(GO:0005759) |
| 0.0 | 2.8 | GO:0005811 | lipid particle(GO:0005811) |
| 0.0 | 1.0 | GO:0005721 | pericentric heterochromatin(GO:0005721) |
| 0.0 | 2.9 | GO:0005581 | collagen trimer(GO:0005581) |
| 0.0 | 0.8 | GO:0005865 | striated muscle thin filament(GO:0005865) |
| 0.0 | 3.4 | GO:0030425 | dendrite(GO:0030425) |
| 0.0 | 0.4 | GO:0030126 | COPI vesicle coat(GO:0030126) |
| 0.0 | 0.2 | GO:0010369 | chromocenter(GO:0010369) |
| 0.0 | 0.1 | GO:0032426 | stereocilium tip(GO:0032426) |
| 0.0 | 0.4 | GO:0030140 | trans-Golgi network transport vesicle(GO:0030140) |
| 0.0 | 1.7 | GO:0000118 | histone deacetylase complex(GO:0000118) |
| 0.0 | 1.9 | GO:0030176 | integral component of endoplasmic reticulum membrane(GO:0030176) |
| 0.0 | 2.1 | GO:0016323 | basolateral plasma membrane(GO:0016323) |
| 0.0 | 1.5 | GO:0005938 | cell cortex(GO:0005938) |
| 0.0 | 1.6 | GO:0030427 | site of polarized growth(GO:0030427) |
| 0.0 | 2.2 | GO:0009897 | external side of plasma membrane(GO:0009897) |
| 0.0 | 0.1 | GO:0005922 | connexon complex(GO:0005922) |
| 0.0 | 0.4 | GO:0000315 | organellar large ribosomal subunit(GO:0000315) mitochondrial large ribosomal subunit(GO:0005762) |
Gene overrepresentation in molecular_function category:
| Log-likelihood per target | Total log-likelihood | Term | Description |
|---|---|---|---|
| 4.5 | 26.9 | GO:0032051 | clathrin light chain binding(GO:0032051) |
| 3.4 | 13.7 | GO:0016286 | small conductance calcium-activated potassium channel activity(GO:0016286) |
| 3.1 | 9.2 | GO:0005436 | sodium:phosphate symporter activity(GO:0005436) sodium:inorganic phosphate symporter activity(GO:0015319) |
| 2.9 | 32.4 | GO:0004972 | NMDA glutamate receptor activity(GO:0004972) |
| 2.1 | 6.2 | GO:0004994 | somatostatin receptor activity(GO:0004994) |
| 2.0 | 8.0 | GO:0038025 | reelin receptor activity(GO:0038025) |
| 2.0 | 10.0 | GO:0008269 | JAK pathway signal transduction adaptor activity(GO:0008269) |
| 1.7 | 13.4 | GO:0031811 | G-protein coupled nucleotide receptor binding(GO:0031811) P2Y1 nucleotide receptor binding(GO:0031812) |
| 1.3 | 4.0 | GO:0016715 | oxidoreductase activity, acting on paired donors, with incorporation or reduction of molecular oxygen, reduced ascorbate as one donor, and incorporation of one atom of oxygen(GO:0016715) |
| 1.3 | 19.4 | GO:0044323 | retinoic acid-responsive element binding(GO:0044323) |
| 1.3 | 7.7 | GO:0005042 | netrin receptor activity(GO:0005042) |
| 1.2 | 6.1 | GO:0004359 | glutaminase activity(GO:0004359) |
| 1.0 | 8.3 | GO:0008499 | UDP-galactose:beta-N-acetylglucosamine beta-1,3-galactosyltransferase activity(GO:0008499) |
| 1.0 | 8.2 | GO:0004767 | sphingomyelin phosphodiesterase activity(GO:0004767) |
| 1.0 | 7.0 | GO:0001226 | RNA polymerase II transcription corepressor binding(GO:0001226) |
| 1.0 | 11.7 | GO:0015271 | outward rectifier potassium channel activity(GO:0015271) |
| 0.9 | 2.8 | GO:0004307 | ethanolaminephosphotransferase activity(GO:0004307) |
| 0.9 | 12.9 | GO:0008331 | high voltage-gated calcium channel activity(GO:0008331) |
| 0.8 | 4.2 | GO:0097016 | L27 domain binding(GO:0097016) |
| 0.8 | 25.0 | GO:0008093 | cytoskeletal adaptor activity(GO:0008093) |
| 0.8 | 3.9 | GO:0042610 | CD8 receptor binding(GO:0042610) |
| 0.7 | 5.8 | GO:0017034 | Rap guanyl-nucleotide exchange factor activity(GO:0017034) |
| 0.7 | 5.6 | GO:0035184 | histone threonine kinase activity(GO:0035184) |
| 0.6 | 3.0 | GO:0004849 | uridine kinase activity(GO:0004849) |
| 0.6 | 6.0 | GO:0042043 | neurexin family protein binding(GO:0042043) |
| 0.6 | 26.0 | GO:0070888 | E-box binding(GO:0070888) |
| 0.5 | 12.3 | GO:0050750 | low-density lipoprotein particle receptor binding(GO:0050750) |
| 0.5 | 1.6 | GO:0016015 | morphogen activity(GO:0016015) |
| 0.5 | 2.8 | GO:0042134 | rRNA primary transcript binding(GO:0042134) |
| 0.5 | 4.1 | GO:0035312 | 5'-3' exodeoxyribonuclease activity(GO:0035312) |
| 0.4 | 2.2 | GO:0030942 | endoplasmic reticulum signal peptide binding(GO:0030942) |
| 0.4 | 2.9 | GO:0048101 | calcium- and calmodulin-regulated 3',5'-cyclic-GMP phosphodiesterase activity(GO:0048101) |
| 0.4 | 7.5 | GO:0005313 | L-glutamate transmembrane transporter activity(GO:0005313) |
| 0.4 | 2.0 | GO:0086008 | voltage-gated potassium channel activity involved in cardiac muscle cell action potential repolarization(GO:0086008) |
| 0.4 | 2.3 | GO:0046975 | histone methyltransferase activity (H3-K36 specific)(GO:0046975) |
| 0.4 | 4.0 | GO:0003680 | AT DNA binding(GO:0003680) |
| 0.4 | 2.1 | GO:0015379 | potassium:chloride symporter activity(GO:0015379) potassium ion symporter activity(GO:0022820) |
| 0.4 | 1.4 | GO:0031800 | type 3 metabotropic glutamate receptor binding(GO:0031800) |
| 0.3 | 2.1 | GO:0070699 | type II activin receptor binding(GO:0070699) |
| 0.3 | 9.4 | GO:0005245 | voltage-gated calcium channel activity(GO:0005245) |
| 0.3 | 3.3 | GO:1990247 | N6-methyladenosine-containing RNA binding(GO:1990247) |
| 0.3 | 11.4 | GO:0017091 | AU-rich element binding(GO:0017091) |
| 0.3 | 1.0 | GO:0033829 | O-fucosylpeptide 3-beta-N-acetylglucosaminyltransferase activity(GO:0033829) |
| 0.3 | 0.9 | GO:0008527 | taste receptor activity(GO:0008527) |
| 0.3 | 19.2 | GO:0017022 | myosin binding(GO:0017022) |
| 0.3 | 5.0 | GO:0031078 | histone deacetylase activity (H3-K14 specific)(GO:0031078) NAD-dependent histone deacetylase activity (H3-K14 specific)(GO:0032041) |
| 0.2 | 9.2 | GO:0045296 | cadherin binding(GO:0045296) |
| 0.2 | 5.2 | GO:0008266 | poly(U) RNA binding(GO:0008266) |
| 0.2 | 1.8 | GO:0003836 | beta-galactoside (CMP) alpha-2,3-sialyltransferase activity(GO:0003836) |
| 0.2 | 2.4 | GO:0004745 | retinol dehydrogenase activity(GO:0004745) |
| 0.2 | 1.3 | GO:0070579 | methylcytosine dioxygenase activity(GO:0070579) |
| 0.2 | 6.5 | GO:0070273 | phosphatidylinositol-4-phosphate binding(GO:0070273) |
| 0.2 | 4.2 | GO:0017049 | GTP-Rho binding(GO:0017049) |
| 0.2 | 2.0 | GO:0052872 | 3-(3-hydroxyphenyl)propionate hydroxylase activity(GO:0008688) 4-chlorobenzaldehyde oxidase activity(GO:0018471) 3,5-xylenol methylhydroxylase activity(GO:0018630) phenylacetate hydroxylase activity(GO:0018631) 4-nitrophenol 4-monooxygenase activity(GO:0018632) dimethyl sulfide monooxygenase activity(GO:0018633) alpha-pinene monooxygenase [NADH] activity(GO:0018634) phenanthrene 9,10-monooxygenase activity(GO:0018636) 1-hydroxy-2-naphthoate hydroxylase activity(GO:0018637) toluene 4-monooxygenase activity(GO:0018638) xylene monooxygenase activity(GO:0018639) dibenzothiophene monooxygenase activity(GO:0018640) 6-hydroxy-3-methyl-2-oxo-1,2-dihydroquinoline 6-monooxygenase activity(GO:0018641) chlorophenol 4-monooxygenase activity(GO:0018642) carbon disulfide oxygenase activity(GO:0018643) toluene 2-monooxygenase activity(GO:0018644) 1-hydroxy-2-oxolimonene 1,2-monooxygenase activity(GO:0018646) phenanthrene 1,2-monooxygenase activity(GO:0018647) tetrahydrofuran hydroxylase activity(GO:0018649) styrene monooxygenase activity(GO:0018650) toluene-4-sulfonate monooxygenase activity(GO:0018651) toluene-sulfonate methyl-monooxygenase activity(GO:0018652) 3-methyl-2-oxo-1,2-dihydroquinoline 6-monooxygenase activity(GO:0018653) 2-hydroxy-phenylacetate hydroxylase activity(GO:0018654) 2-oxo-delta3-4,5,5-trimethylcyclopentenylacetyl-CoA 1,2-monooxygenase activity(GO:0018655) phenanthrene 3,4-monooxygenase activity(GO:0018656) toluene 3-monooxygenase activity(GO:0018657) 4-hydroxyphenylacetate,NADH:oxygen oxidoreductase (3-hydroxylating) activity(GO:0018660) limonene monooxygenase activity(GO:0019113) 2-methylnaphthalene hydroxylase activity(GO:0034526) 1-methylnaphthalene hydroxylase activity(GO:0034534) bisphenol A hydroxylase A activity(GO:0034560) salicylate 5-hydroxylase activity(GO:0034785) isobutylamine N-hydroxylase activity(GO:0034791) branched-chain dodecylbenzene sulfonate monooxygenase activity(GO:0034802) 3-HSA hydroxylase activity(GO:0034819) 4-hydroxypyridine-3-hydroxylase activity(GO:0034894) 2-octaprenyl-3-methyl-6-methoxy-1,4-benzoquinol hydroxylase activity(GO:0043719) 6-hydroxynicotinate 3-monooxygenase activity(GO:0043731) tocotrienol omega-hydroxylase activity(GO:0052872) thalianol hydroxylase activity(GO:0080014) |
| 0.2 | 4.4 | GO:0032266 | phosphatidylinositol-3-phosphate binding(GO:0032266) |
| 0.2 | 3.6 | GO:0070577 | lysine-acetylated histone binding(GO:0070577) |
| 0.2 | 1.8 | GO:0008568 | microtubule-severing ATPase activity(GO:0008568) |
| 0.2 | 0.8 | GO:0050816 | phosphothreonine binding(GO:0050816) |
| 0.1 | 0.4 | GO:0046538 | bisphosphoglycerate mutase activity(GO:0004082) bisphosphoglycerate 2-phosphatase activity(GO:0004083) phosphoglycerate mutase activity(GO:0004619) 2,3-bisphosphoglycerate-dependent phosphoglycerate mutase activity(GO:0046538) |
| 0.1 | 1.9 | GO:0035497 | cAMP response element binding(GO:0035497) |
| 0.1 | 19.7 | GO:0050839 | cell adhesion molecule binding(GO:0050839) |
| 0.1 | 3.1 | GO:0045502 | dynein binding(GO:0045502) |
| 0.1 | 0.9 | GO:0005451 | monovalent cation:proton antiporter activity(GO:0005451) sodium:proton antiporter activity(GO:0015385) potassium:proton antiporter activity(GO:0015386) |
| 0.1 | 1.1 | GO:1904264 | ubiquitin protein ligase activity involved in ERAD pathway(GO:1904264) |
| 0.1 | 4.4 | GO:0005158 | insulin receptor binding(GO:0005158) |
| 0.1 | 5.3 | GO:0001105 | RNA polymerase II transcription coactivator activity(GO:0001105) |
| 0.1 | 3.9 | GO:0004120 | calmodulin-dependent cyclic-nucleotide phosphodiesterase activity(GO:0004117) cGMP-stimulated cyclic-nucleotide phosphodiesterase activity(GO:0004118) cGMP-inhibited cyclic-nucleotide phosphodiesterase activity(GO:0004119) photoreceptor cyclic-nucleotide phosphodiesterase activity(GO:0004120) 7,8-dihydro-D-neopterin 2',3'-cyclic phosphate phosphodiesterase activity(GO:0044688) inositol phosphosphingolipid phospholipase activity(GO:0052712) inositol phosphorylceramide phospholipase activity(GO:0052713) mannosyl-inositol phosphorylceramide phospholipase activity(GO:0052714) mannosyl-diinositol phosphorylceramide phospholipase activity(GO:0052715) |
| 0.1 | 17.9 | GO:0042393 | histone binding(GO:0042393) |
| 0.1 | 12.8 | GO:0004713 | protein tyrosine kinase activity(GO:0004713) |
| 0.1 | 3.4 | GO:0043849 | Ras palmitoyltransferase activity(GO:0043849) |
| 0.1 | 3.1 | GO:0051721 | protein phosphatase 2A binding(GO:0051721) |
| 0.1 | 6.0 | GO:0003777 | microtubule motor activity(GO:0003777) |
| 0.1 | 7.4 | GO:0030674 | protein binding, bridging(GO:0030674) |
| 0.1 | 2.4 | GO:0070412 | R-SMAD binding(GO:0070412) |
| 0.1 | 0.8 | GO:0008190 | eukaryotic initiation factor 4E binding(GO:0008190) |
| 0.1 | 3.1 | GO:0005484 | SNAP receptor activity(GO:0005484) |
| 0.1 | 0.7 | GO:0004383 | guanylate cyclase activity(GO:0004383) |
| 0.1 | 10.1 | GO:0001078 | transcriptional repressor activity, RNA polymerase II core promoter proximal region sequence-specific binding(GO:0001078) |
| 0.1 | 1.7 | GO:0031435 | mitogen-activated protein kinase kinase kinase binding(GO:0031435) |
| 0.1 | 1.8 | GO:0005112 | Notch binding(GO:0005112) |
| 0.1 | 3.3 | GO:0001191 | transcriptional repressor activity, RNA polymerase II transcription factor binding(GO:0001191) |
| 0.1 | 14.9 | GO:0001077 | transcriptional activator activity, RNA polymerase II core promoter proximal region sequence-specific binding(GO:0001077) |
| 0.1 | 2.0 | GO:0001540 | beta-amyloid binding(GO:0001540) |
| 0.1 | 3.6 | GO:0008013 | beta-catenin binding(GO:0008013) |
| 0.1 | 5.0 | GO:0001228 | transcriptional activator activity, RNA polymerase II transcription regulatory region sequence-specific binding(GO:0001228) |
| 0.1 | 1.5 | GO:0031369 | translation initiation factor binding(GO:0031369) |
| 0.0 | 25.3 | GO:0004672 | protein kinase activity(GO:0004672) |
| 0.0 | 1.0 | GO:0044653 | trehalase activity(GO:0015927) dextrin alpha-glucosidase activity(GO:0044653) starch alpha-glucosidase activity(GO:0044654) beta-glucanase activity(GO:0052736) beta-6-sulfate-N-acetylglucosaminidase activity(GO:0052769) glucan endo-1,4-beta-glucosidase activity(GO:0052859) |
| 0.0 | 4.1 | GO:0005125 | cytokine activity(GO:0005125) |
| 0.0 | 0.6 | GO:0042975 | peroxisome proliferator activated receptor binding(GO:0042975) |
| 0.0 | 0.4 | GO:0001102 | RNA polymerase II activating transcription factor binding(GO:0001102) |
| 0.0 | 0.2 | GO:0103116 | alpha-D-galactofuranose transporter activity(GO:0103116) |
| 0.0 | 5.2 | GO:0004721 | phosphoprotein phosphatase activity(GO:0004721) |
| 0.0 | 0.9 | GO:0005544 | calcium-dependent phospholipid binding(GO:0005544) |
| 0.0 | 8.2 | GO:0008134 | transcription factor binding(GO:0008134) |
| 0.0 | 1.8 | GO:0043851 | rRNA (adenine-N6,N6-)-dimethyltransferase activity(GO:0000179) rRNA (uridine-2'-O-)-methyltransferase activity(GO:0008650) rRNA (adenine-N6-)-methyltransferase activity(GO:0008988) rRNA (cytosine-C5-)-methyltransferase activity(GO:0009383) selenocysteine methyltransferase activity(GO:0016205) rRNA (adenine) methyltransferase activity(GO:0016433) rRNA (cytosine) methyltransferase activity(GO:0016434) rRNA (guanine) methyltransferase activity(GO:0016435) 1-phenanthrol methyltransferase activity(GO:0018707) protein-arginine N5-methyltransferase activity(GO:0019702) dimethylarsinite methyltransferase activity(GO:0034541) 4,5-dihydroxybenzo(a)pyrene methyltransferase activity(GO:0034807) 1-hydroxypyrene methyltransferase activity(GO:0034931) 1-hydroxy-6-methoxypyrene methyltransferase activity(GO:0034933) demethylmenaquinone methyltransferase activity(GO:0043770) cobalt-precorrin-6B C5-methyltransferase activity(GO:0043776) cobalt-precorrin-7 C15-methyltransferase activity(GO:0043777) cobalt-precorrin-5B C1-methyltransferase activity(GO:0043780) cobalt-precorrin-3 C17-methyltransferase activity(GO:0043782) dimethylamine methyltransferase activity(GO:0043791) hydroxyneurosporene-O-methyltransferase activity(GO:0043803) tRNA (adenine-57, 58-N(1)-) methyltransferase activity(GO:0043827) methylamine-specific methylcobalamin:coenzyme M methyltransferase activity(GO:0043833) trimethylamine methyltransferase activity(GO:0043834) methanol-specific methylcobalamin:coenzyme M methyltransferase activity(GO:0043851) monomethylamine methyltransferase activity(GO:0043852) P-methyltransferase activity(GO:0051994) Se-methyltransferase activity(GO:0051995) 2-phytyl-1,4-naphthoquinone methyltransferase activity(GO:0052624) tRNA (uracil-2'-O-)-methyltransferase activity(GO:0052665) tRNA (cytosine-2'-O-)-methyltransferase activity(GO:0052666) phosphomethylethanolamine N-methyltransferase activity(GO:0052667) tRNA (cytosine-3-)-methyltransferase activity(GO:0052735) rRNA (cytosine-2'-O-)-methyltransferase activity(GO:0070677) rRNA (cytosine-N4-)-methyltransferase activity(GO:0071424) trihydroxyferuloyl spermidine O-methyltransferase activity(GO:0080012) |
| 0.0 | 2.0 | GO:0030165 | PDZ domain binding(GO:0030165) |
| 0.0 | 1.5 | GO:0004860 | protein kinase inhibitor activity(GO:0004860) |
| 0.0 | 1.5 | GO:0005089 | Rho guanyl-nucleotide exchange factor activity(GO:0005089) |
| 0.0 | 0.1 | GO:0005243 | gap junction channel activity(GO:0005243) |
| 0.0 | 0.2 | GO:0001076 | transcription factor activity, RNA polymerase II transcription factor binding(GO:0001076) |