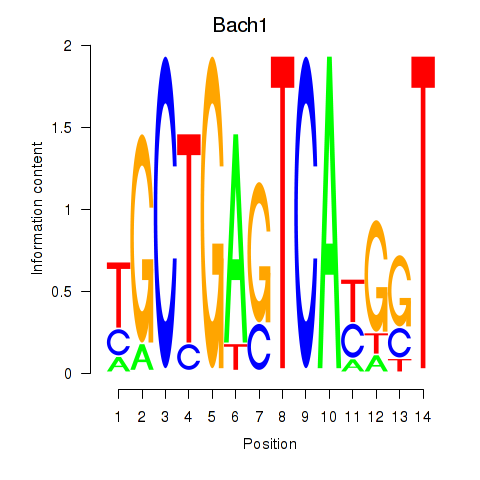
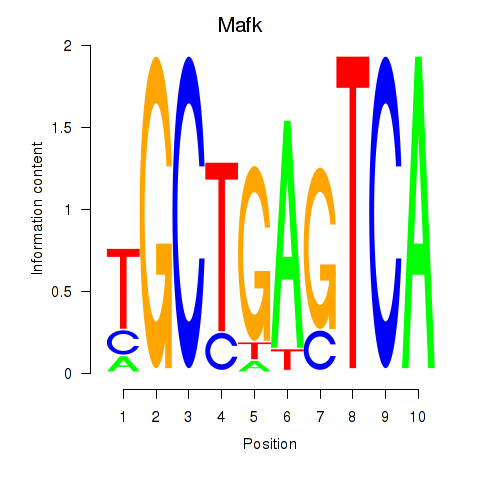
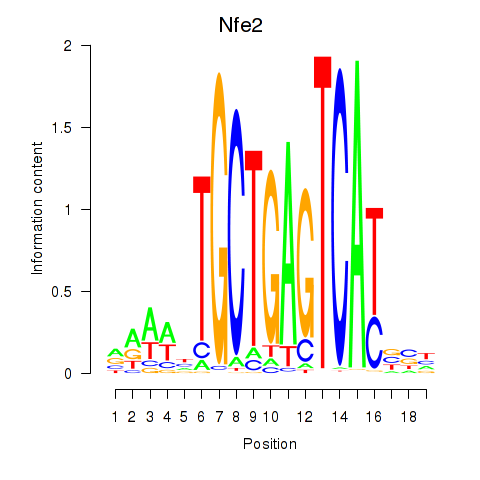
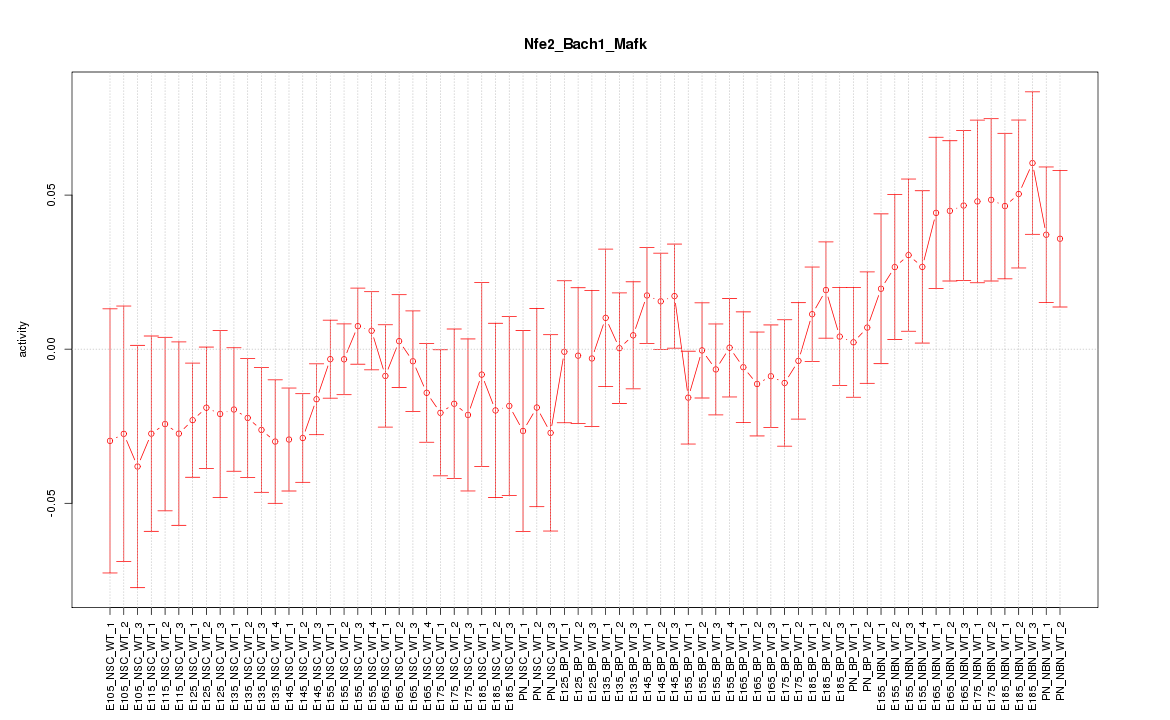
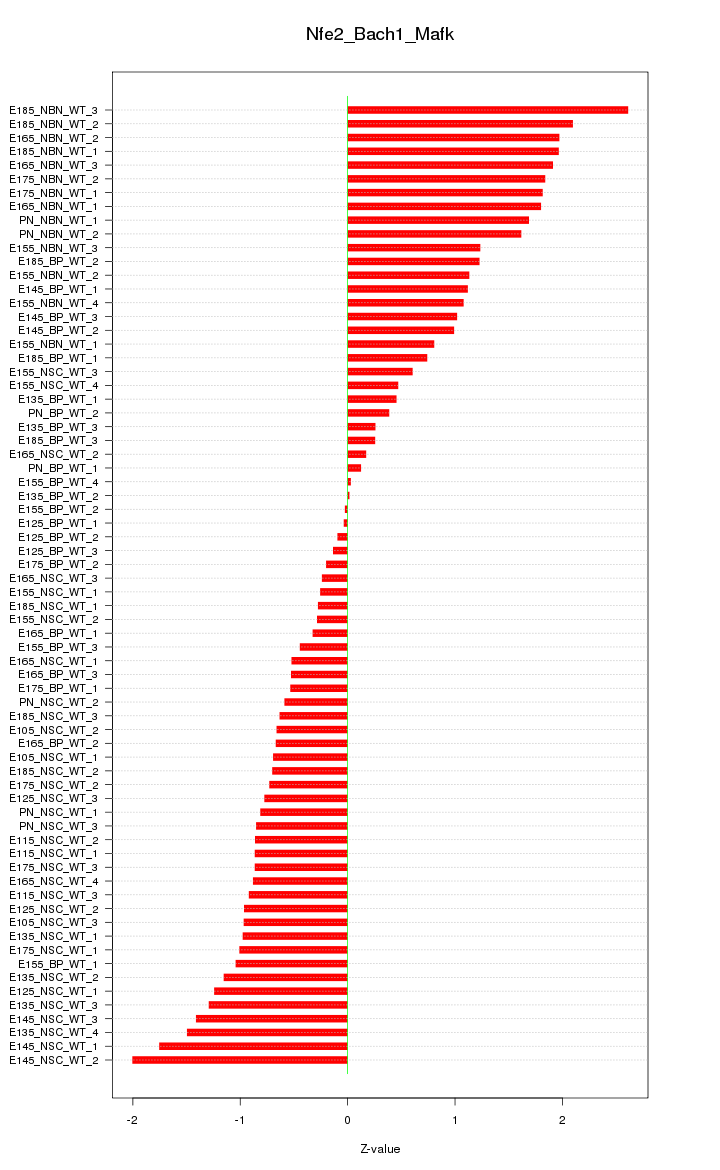
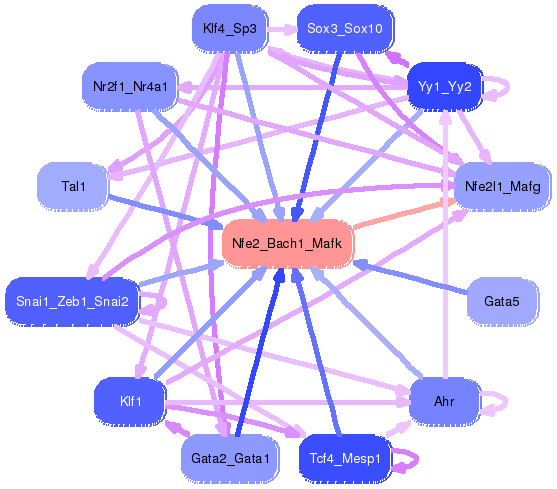
Motif ID: Nfe2_Bach1_Mafk
Z-value: 1.072
Transcription factors associated with Nfe2_Bach1_Mafk:
| Gene Symbol | Entrez ID | Gene Name |
|---|---|---|
| Bach1 | ENSMUSG00000025612.5 | Bach1 |
| Mafk | ENSMUSG00000018143.4 | Mafk |
| Nfe2 | ENSMUSG00000058794.6 | Nfe2 |
Activity-expression correlation:
| Gene Symbol | Promoter | Pearson corr. coef. | P-value | Plot |
|---|---|---|---|---|
| Mafk | mm10_v2_chr5_+_139791513_139791539 | 0.65 | 1.2e-09 | Click! |
| Nfe2 | mm10_v2_chr15_-_103251465_103251705 | -0.55 | 1.1e-06 | Click! |
| Bach1 | mm10_v2_chr16_+_87698904_87698959 | 0.44 | 1.6e-04 | Click! |

Top targets:
Gene overrepresentation in biological_process category:
| Log-likelihood per target | Total log-likelihood | Term | Description |
|---|---|---|---|
| 2.3 | 9.1 | GO:0035617 | stress granule disassembly(GO:0035617) |
| 1.5 | 4.6 | GO:0032241 | positive regulation of nucleobase-containing compound transport(GO:0032241) regulation of nucleoside transport(GO:0032242) negative regulation of circadian sleep/wake cycle, non-REM sleep(GO:0042323) negative regulation of mucus secretion(GO:0070256) |
| 1.5 | 8.7 | GO:0071442 | positive regulation of histone H3-K14 acetylation(GO:0071442) |
| 1.4 | 13.5 | GO:0071243 | cellular response to arsenic-containing substance(GO:0071243) |
| 1.1 | 3.3 | GO:0001543 | ovarian follicle rupture(GO:0001543) |
| 1.0 | 3.9 | GO:1901740 | negative regulation of myoblast fusion(GO:1901740) |
| 1.0 | 2.0 | GO:0035898 | parathyroid hormone secretion(GO:0035898) |
| 1.0 | 8.8 | GO:0035887 | aortic smooth muscle cell differentiation(GO:0035887) |
| 0.9 | 3.8 | GO:0038128 | ERBB2 signaling pathway(GO:0038128) |
| 0.9 | 4.7 | GO:0031915 | positive regulation of synaptic plasticity(GO:0031915) |
| 0.9 | 8.3 | GO:0060665 | regulation of branching involved in salivary gland morphogenesis by mesenchymal-epithelial signaling(GO:0060665) |
| 0.9 | 3.4 | GO:1903031 | regulation of microtubule plus-end binding(GO:1903031) positive regulation of microtubule plus-end binding(GO:1903033) |
| 0.8 | 6.5 | GO:0005513 | detection of calcium ion(GO:0005513) |
| 0.8 | 39.0 | GO:0047496 | vesicle transport along microtubule(GO:0047496) |
| 0.7 | 3.6 | GO:0048245 | eosinophil chemotaxis(GO:0048245) |
| 0.7 | 11.3 | GO:0099500 | synaptic vesicle fusion to presynaptic active zone membrane(GO:0031629) vesicle fusion to plasma membrane(GO:0099500) |
| 0.7 | 4.7 | GO:0071712 | ER-associated misfolded protein catabolic process(GO:0071712) |
| 0.7 | 2.6 | GO:0007412 | axon target recognition(GO:0007412) |
| 0.6 | 23.8 | GO:0045746 | negative regulation of Notch signaling pathway(GO:0045746) |
| 0.6 | 3.2 | GO:0070305 | response to cGMP(GO:0070305) cellular response to cGMP(GO:0071321) |
| 0.6 | 3.1 | GO:1902031 | regulation of NADP metabolic process(GO:1902031) |
| 0.6 | 4.2 | GO:1903423 | positive regulation of synaptic vesicle recycling(GO:1903423) |
| 0.6 | 5.3 | GO:0008090 | retrograde axonal transport(GO:0008090) |
| 0.6 | 3.5 | GO:0034047 | regulation of protein phosphatase type 2A activity(GO:0034047) |
| 0.6 | 1.7 | GO:0070649 | formin-nucleated actin cable assembly(GO:0070649) |
| 0.6 | 1.7 | GO:0046022 | regulation of transcription from RNA polymerase II promoter, mitotic(GO:0046021) positive regulation of transcription from RNA polymerase II promoter during mitosis(GO:0046022) |
| 0.5 | 4.9 | GO:0018095 | protein polyglutamylation(GO:0018095) |
| 0.5 | 1.6 | GO:0043323 | positive regulation of natural killer cell degranulation(GO:0043323) |
| 0.5 | 2.5 | GO:0043314 | negative regulation of neutrophil degranulation(GO:0043314) negative regulation of blood vessel remodeling(GO:0060313) |
| 0.5 | 3.5 | GO:1903847 | regulation of aorta morphogenesis(GO:1903847) positive regulation of aorta morphogenesis(GO:1903849) |
| 0.5 | 3.5 | GO:2000809 | positive regulation of synaptic vesicle clustering(GO:2000809) |
| 0.5 | 2.9 | GO:0046103 | ADP biosynthetic process(GO:0006172) inosine biosynthetic process(GO:0046103) |
| 0.5 | 2.9 | GO:1900029 | positive regulation of ruffle assembly(GO:1900029) |
| 0.5 | 1.5 | GO:2000501 | natural killer cell chemotaxis(GO:0035747) negative regulation of lymphocyte migration(GO:2000402) regulation of natural killer cell chemotaxis(GO:2000501) |
| 0.5 | 2.3 | GO:0060075 | regulation of resting membrane potential(GO:0060075) |
| 0.4 | 5.4 | GO:0044331 | cell-cell adhesion mediated by cadherin(GO:0044331) |
| 0.4 | 0.9 | GO:0042939 | glutathione transport(GO:0034635) tripeptide transport(GO:0042939) |
| 0.4 | 3.9 | GO:0036465 | synaptic vesicle recycling(GO:0036465) |
| 0.4 | 4.3 | GO:0051014 | actin filament severing(GO:0051014) |
| 0.4 | 3.4 | GO:0061635 | regulation of protein complex stability(GO:0061635) |
| 0.4 | 2.1 | GO:0051045 | negative regulation of membrane protein ectodomain proteolysis(GO:0051045) |
| 0.4 | 1.2 | GO:0042536 | negative regulation of tumor necrosis factor biosynthetic process(GO:0042536) |
| 0.4 | 4.3 | GO:0007191 | adenylate cyclase-activating dopamine receptor signaling pathway(GO:0007191) |
| 0.4 | 1.5 | GO:0003430 | growth plate cartilage chondrocyte growth(GO:0003430) Harderian gland development(GO:0070384) |
| 0.4 | 1.5 | GO:0010499 | proteasomal ubiquitin-independent protein catabolic process(GO:0010499) |
| 0.3 | 2.0 | GO:0032380 | regulation of intracellular lipid transport(GO:0032377) regulation of intracellular sterol transport(GO:0032380) regulation of intracellular cholesterol transport(GO:0032383) |
| 0.3 | 1.0 | GO:0070488 | neutrophil aggregation(GO:0070488) |
| 0.3 | 2.9 | GO:0051152 | positive regulation of smooth muscle cell differentiation(GO:0051152) |
| 0.3 | 1.5 | GO:0061086 | negative regulation of histone H3-K27 methylation(GO:0061086) |
| 0.3 | 0.6 | GO:1900126 | negative regulation of hyaluronan biosynthetic process(GO:1900126) |
| 0.3 | 3.5 | GO:0007250 | activation of NF-kappaB-inducing kinase activity(GO:0007250) |
| 0.3 | 2.9 | GO:0048268 | clathrin coat assembly(GO:0048268) |
| 0.3 | 2.6 | GO:0051901 | positive regulation of mitochondrial depolarization(GO:0051901) |
| 0.3 | 0.8 | GO:0000454 | snoRNA guided rRNA pseudouridine synthesis(GO:0000454) |
| 0.3 | 1.3 | GO:0071787 | endoplasmic reticulum tubular network assembly(GO:0071787) |
| 0.2 | 1.7 | GO:0006027 | glycosaminoglycan catabolic process(GO:0006027) |
| 0.2 | 1.0 | GO:0035927 | RNA import into mitochondrion(GO:0035927) |
| 0.2 | 1.7 | GO:0015862 | uridine transport(GO:0015862) |
| 0.2 | 1.7 | GO:0046085 | adenosine metabolic process(GO:0046085) |
| 0.2 | 2.0 | GO:1903069 | regulation of ER-associated ubiquitin-dependent protein catabolic process(GO:1903069) |
| 0.2 | 2.1 | GO:2000766 | negative regulation of cytoplasmic translation(GO:2000766) |
| 0.2 | 0.9 | GO:0006624 | vacuolar protein processing(GO:0006624) |
| 0.2 | 4.9 | GO:0033198 | response to ATP(GO:0033198) |
| 0.2 | 13.5 | GO:0072583 | clathrin-mediated endocytosis(GO:0072583) |
| 0.2 | 3.2 | GO:1900454 | positive regulation of long term synaptic depression(GO:1900454) |
| 0.2 | 4.0 | GO:1901897 | regulation of relaxation of cardiac muscle(GO:1901897) |
| 0.2 | 3.6 | GO:0006958 | complement activation, classical pathway(GO:0006958) |
| 0.2 | 0.6 | GO:0006421 | asparaginyl-tRNA aminoacylation(GO:0006421) |
| 0.2 | 0.9 | GO:0035774 | positive regulation of insulin secretion involved in cellular response to glucose stimulus(GO:0035774) |
| 0.2 | 1.2 | GO:0010820 | positive regulation of T cell chemotaxis(GO:0010820) |
| 0.2 | 6.4 | GO:0048843 | negative regulation of axon extension involved in axon guidance(GO:0048843) |
| 0.2 | 2.7 | GO:0034389 | lipid particle organization(GO:0034389) |
| 0.1 | 0.3 | GO:0002295 | T-helper cell lineage commitment(GO:0002295) |
| 0.1 | 1.2 | GO:0034720 | positive regulation of mammary gland epithelial cell proliferation(GO:0033601) histone H3-K4 demethylation(GO:0034720) mammary duct terminal end bud growth(GO:0060763) |
| 0.1 | 1.0 | GO:0018243 | protein O-linked glycosylation via threonine(GO:0018243) |
| 0.1 | 2.7 | GO:0014067 | negative regulation of phosphatidylinositol 3-kinase signaling(GO:0014067) |
| 0.1 | 1.8 | GO:1902857 | positive regulation of nonmotile primary cilium assembly(GO:1902857) |
| 0.1 | 0.8 | GO:0002934 | desmosome organization(GO:0002934) |
| 0.1 | 1.6 | GO:0016322 | neuron remodeling(GO:0016322) |
| 0.1 | 1.3 | GO:0021869 | forebrain ventricular zone progenitor cell division(GO:0021869) |
| 0.1 | 0.8 | GO:0002317 | plasma cell differentiation(GO:0002317) |
| 0.1 | 0.9 | GO:0001887 | selenium compound metabolic process(GO:0001887) |
| 0.1 | 1.3 | GO:0060742 | epithelial cell differentiation involved in prostate gland development(GO:0060742) |
| 0.1 | 1.7 | GO:0001731 | formation of translation preinitiation complex(GO:0001731) |
| 0.1 | 0.6 | GO:0090310 | negative regulation of methylation-dependent chromatin silencing(GO:0090310) |
| 0.1 | 5.4 | GO:0051438 | regulation of ubiquitin-protein transferase activity(GO:0051438) |
| 0.1 | 3.3 | GO:0045604 | regulation of epidermal cell differentiation(GO:0045604) |
| 0.1 | 1.2 | GO:0021942 | radial glia guided migration of Purkinje cell(GO:0021942) |
| 0.1 | 0.6 | GO:0097368 | establishment of Sertoli cell barrier(GO:0097368) |
| 0.1 | 0.5 | GO:0010735 | positive regulation of transcription via serum response element binding(GO:0010735) |
| 0.1 | 0.5 | GO:0007603 | phototransduction, visible light(GO:0007603) |
| 0.1 | 1.7 | GO:0014068 | positive regulation of phosphatidylinositol 3-kinase signaling(GO:0014068) |
| 0.1 | 1.1 | GO:0070301 | cellular response to hydrogen peroxide(GO:0070301) |
| 0.1 | 0.8 | GO:0032464 | positive regulation of protein homooligomerization(GO:0032464) |
| 0.1 | 2.6 | GO:0031103 | axon regeneration(GO:0031103) |
| 0.1 | 5.0 | GO:0050775 | positive regulation of dendrite morphogenesis(GO:0050775) |
| 0.1 | 0.2 | GO:0030259 | lipid glycosylation(GO:0030259) |
| 0.1 | 1.9 | GO:0071539 | protein localization to centrosome(GO:0071539) |
| 0.1 | 8.5 | GO:0010811 | positive regulation of cell-substrate adhesion(GO:0010811) |
| 0.1 | 2.8 | GO:0090162 | establishment of epithelial cell polarity(GO:0090162) |
| 0.1 | 2.6 | GO:0007157 | heterophilic cell-cell adhesion via plasma membrane cell adhesion molecules(GO:0007157) |
| 0.1 | 0.3 | GO:0046501 | protoporphyrinogen IX metabolic process(GO:0046501) |
| 0.1 | 2.0 | GO:0006541 | glutamine metabolic process(GO:0006541) |
| 0.1 | 1.8 | GO:0003333 | amino acid transmembrane transport(GO:0003333) |
| 0.1 | 0.8 | GO:0036065 | fucosylation(GO:0036065) |
| 0.1 | 4.2 | GO:0042147 | retrograde transport, endosome to Golgi(GO:0042147) |
| 0.0 | 0.7 | GO:0045792 | negative regulation of cell size(GO:0045792) |
| 0.0 | 0.7 | GO:0071549 | cellular response to dexamethasone stimulus(GO:0071549) |
| 0.0 | 1.1 | GO:0042593 | carbohydrate homeostasis(GO:0033500) glucose homeostasis(GO:0042593) |
| 0.0 | 0.5 | GO:0090084 | negative regulation of inclusion body assembly(GO:0090084) |
| 0.0 | 1.1 | GO:0070536 | protein K63-linked deubiquitination(GO:0070536) |
| 0.0 | 0.4 | GO:0003215 | cardiac right ventricle morphogenesis(GO:0003215) |
| 0.0 | 0.3 | GO:0002755 | MyD88-dependent toll-like receptor signaling pathway(GO:0002755) |
| 0.0 | 5.5 | GO:0007612 | learning(GO:0007612) |
| 0.0 | 1.0 | GO:0044342 | type B pancreatic cell proliferation(GO:0044342) |
| 0.0 | 0.7 | GO:0048026 | positive regulation of mRNA splicing, via spliceosome(GO:0048026) |
| 0.0 | 5.2 | GO:0007179 | transforming growth factor beta receptor signaling pathway(GO:0007179) |
| 0.0 | 0.9 | GO:0035458 | cellular response to interferon-beta(GO:0035458) |
| 0.0 | 3.8 | GO:0098780 | mitophagy in response to mitochondrial depolarization(GO:0098779) response to mitochondrial depolarisation(GO:0098780) |
| 0.0 | 3.6 | GO:0007266 | Rho protein signal transduction(GO:0007266) |
| 0.0 | 4.9 | GO:0007018 | microtubule-based movement(GO:0007018) |
| 0.0 | 0.4 | GO:0031507 | heterochromatin assembly(GO:0031507) |
| 0.0 | 3.9 | GO:0007186 | G-protein coupled receptor signaling pathway(GO:0007186) |
| 0.0 | 0.0 | GO:0002578 | negative regulation of antigen processing and presentation(GO:0002578) |
| 0.0 | 0.4 | GO:0070884 | regulation of calcineurin-NFAT signaling cascade(GO:0070884) |
| 0.0 | 0.8 | GO:0045744 | negative regulation of G-protein coupled receptor protein signaling pathway(GO:0045744) |
| 0.0 | 0.1 | GO:0033540 | fatty acid beta-oxidation using acyl-CoA oxidase(GO:0033540) |
| 0.0 | 0.2 | GO:0044380 | protein localization to cytoskeleton(GO:0044380) |
| 0.0 | 0.4 | GO:0032981 | NADH dehydrogenase complex assembly(GO:0010257) mitochondrial respiratory chain complex I assembly(GO:0032981) mitochondrial respiratory chain complex I biogenesis(GO:0097031) |
| 0.0 | 2.3 | GO:0042098 | T cell proliferation(GO:0042098) |
| 0.0 | 0.9 | GO:0052548 | regulation of endopeptidase activity(GO:0052548) |
| 0.0 | 0.4 | GO:0072337 | modified amino acid transport(GO:0072337) |
| 0.0 | 0.3 | GO:0071577 | zinc II ion transmembrane transport(GO:0071577) |
| 0.0 | 0.1 | GO:0043248 | proteasome assembly(GO:0043248) |
| 0.0 | 0.3 | GO:0045471 | response to ethanol(GO:0045471) |
| 0.0 | 0.2 | GO:0016242 | negative regulation of macroautophagy(GO:0016242) |
| 0.0 | 0.1 | GO:0002862 | negative regulation of inflammatory response to antigenic stimulus(GO:0002862) |
Gene overrepresentation in cellular_component category:
| Log-likelihood per target | Total log-likelihood | Term | Description |
|---|---|---|---|
| 2.8 | 11.3 | GO:0070032 | synaptobrevin 2-SNAP-25-syntaxin-1a-complexin I complex(GO:0070032) synaptobrevin 2-SNAP-25-syntaxin-1a-complexin II complex(GO:0070033) |
| 1.6 | 4.9 | GO:0036501 | UFD1-NPL4 complex(GO:0036501) |
| 1.4 | 39.8 | GO:0005868 | cytoplasmic dynein complex(GO:0005868) |
| 1.4 | 15.1 | GO:0030130 | clathrin coat of trans-Golgi network vesicle(GO:0030130) |
| 1.1 | 3.4 | GO:0044754 | amphisome(GO:0044753) autolysosome(GO:0044754) |
| 1.1 | 4.3 | GO:0031673 | H zone(GO:0031673) |
| 0.9 | 4.7 | GO:0000015 | phosphopyruvate hydratase complex(GO:0000015) |
| 0.7 | 3.5 | GO:0036056 | filtration diaphragm(GO:0036056) slit diaphragm(GO:0036057) |
| 0.7 | 2.1 | GO:0097057 | TRAF2-GSTP1 complex(GO:0097057) |
| 0.6 | 9.1 | GO:0035253 | ciliary rootlet(GO:0035253) |
| 0.5 | 13.2 | GO:0071565 | nBAF complex(GO:0071565) |
| 0.4 | 4.4 | GO:0019773 | proteasome core complex, alpha-subunit complex(GO:0019773) |
| 0.4 | 2.9 | GO:0001520 | outer dense fiber(GO:0001520) |
| 0.4 | 4.9 | GO:0031229 | integral component of nuclear inner membrane(GO:0005639) intrinsic component of nuclear inner membrane(GO:0031229) |
| 0.3 | 1.9 | GO:0031313 | extrinsic component of endosome membrane(GO:0031313) |
| 0.3 | 9.7 | GO:0032588 | trans-Golgi network membrane(GO:0032588) |
| 0.3 | 4.2 | GO:0043196 | varicosity(GO:0043196) |
| 0.3 | 3.6 | GO:0031462 | Cul2-RING ubiquitin ligase complex(GO:0031462) |
| 0.3 | 3.5 | GO:0008385 | IkappaB kinase complex(GO:0008385) |
| 0.3 | 3.9 | GO:0031045 | dense core granule(GO:0031045) |
| 0.2 | 10.5 | GO:0005834 | heterotrimeric G-protein complex(GO:0005834) |
| 0.2 | 4.6 | GO:0032279 | asymmetric synapse(GO:0032279) |
| 0.2 | 0.8 | GO:0090661 | box H/ACA telomerase RNP complex(GO:0090661) |
| 0.2 | 3.5 | GO:0000159 | protein phosphatase type 2A complex(GO:0000159) |
| 0.2 | 0.7 | GO:0043293 | apoptosome(GO:0043293) |
| 0.1 | 4.8 | GO:0046658 | anchored component of plasma membrane(GO:0046658) |
| 0.1 | 7.1 | GO:0045335 | phagocytic vesicle(GO:0045335) |
| 0.1 | 2.2 | GO:1990124 | messenger ribonucleoprotein complex(GO:1990124) |
| 0.1 | 1.0 | GO:0005742 | mitochondrial outer membrane translocase complex(GO:0005742) |
| 0.1 | 1.7 | GO:0031932 | TORC2 complex(GO:0031932) |
| 0.1 | 10.0 | GO:0008076 | voltage-gated potassium channel complex(GO:0008076) |
| 0.1 | 1.5 | GO:0031235 | intrinsic component of the cytoplasmic side of the plasma membrane(GO:0031235) |
| 0.1 | 3.4 | GO:0035371 | microtubule plus-end(GO:0035371) |
| 0.1 | 0.7 | GO:0031931 | TORC1 complex(GO:0031931) |
| 0.1 | 0.3 | GO:0005896 | interleukin-6 receptor complex(GO:0005896) |
| 0.1 | 10.0 | GO:0005604 | basement membrane(GO:0005604) |
| 0.1 | 0.4 | GO:1990745 | EARP complex(GO:1990745) |
| 0.1 | 1.8 | GO:0000930 | gamma-tubulin complex(GO:0000930) |
| 0.1 | 4.8 | GO:0009925 | basal plasma membrane(GO:0009925) |
| 0.1 | 4.0 | GO:0005871 | kinesin complex(GO:0005871) |
| 0.1 | 6.5 | GO:0000502 | proteasome complex(GO:0000502) |
| 0.1 | 2.7 | GO:0032420 | stereocilium(GO:0032420) |
| 0.1 | 4.1 | GO:0005913 | cell-cell adherens junction(GO:0005913) |
| 0.1 | 1.5 | GO:0035098 | ESC/E(Z) complex(GO:0035098) |
| 0.1 | 5.5 | GO:0030117 | membrane coat(GO:0030117) coated membrane(GO:0048475) |
| 0.1 | 0.3 | GO:0005853 | eukaryotic translation elongation factor 1 complex(GO:0005853) |
| 0.0 | 2.2 | GO:0016328 | lateral plasma membrane(GO:0016328) |
| 0.0 | 1.8 | GO:0035869 | ciliary transition zone(GO:0035869) |
| 0.0 | 1.7 | GO:0097610 | cleavage furrow(GO:0032154) cell surface furrow(GO:0097610) |
| 0.0 | 8.3 | GO:0045211 | postsynaptic membrane(GO:0045211) |
| 0.0 | 4.6 | GO:0009898 | cytoplasmic side of plasma membrane(GO:0009898) |
| 0.0 | 0.4 | GO:0005677 | chromatin silencing complex(GO:0005677) |
| 0.0 | 5.6 | GO:0016323 | basolateral plasma membrane(GO:0016323) |
| 0.0 | 0.3 | GO:0000127 | transcription factor TFIIIC complex(GO:0000127) |
| 0.0 | 1.8 | GO:0030139 | endocytic vesicle(GO:0030139) |
| 0.0 | 0.9 | GO:0005680 | anaphase-promoting complex(GO:0005680) |
| 0.0 | 2.1 | GO:0005581 | collagen trimer(GO:0005581) |
| 0.0 | 5.7 | GO:0043197 | dendritic spine(GO:0043197) |
| 0.0 | 0.2 | GO:0071986 | Ragulator complex(GO:0071986) |
| 0.0 | 2.3 | GO:0032587 | ruffle membrane(GO:0032587) |
| 0.0 | 2.6 | GO:0005923 | bicellular tight junction(GO:0005923) |
| 0.0 | 1.2 | GO:0000315 | organellar large ribosomal subunit(GO:0000315) mitochondrial large ribosomal subunit(GO:0005762) |
| 0.0 | 0.2 | GO:0030008 | TRAPP complex(GO:0030008) |
| 0.0 | 2.7 | GO:0030176 | integral component of endoplasmic reticulum membrane(GO:0030176) |
| 0.0 | 0.6 | GO:0015030 | Cajal body(GO:0015030) |
| 0.0 | 0.2 | GO:0045095 | keratin filament(GO:0045095) |
| 0.0 | 1.6 | GO:0008021 | synaptic vesicle(GO:0008021) |
| 0.0 | 2.2 | GO:0098794 | postsynapse(GO:0098794) |
| 0.0 | 0.0 | GO:1990712 | HFE-transferrin receptor complex(GO:1990712) |
| 0.0 | 2.0 | GO:0098852 | lysosomal membrane(GO:0005765) lytic vacuole membrane(GO:0098852) |
| 0.0 | 0.6 | GO:0030173 | integral component of Golgi membrane(GO:0030173) |
| 0.0 | 0.7 | GO:0005844 | polysome(GO:0005844) |
Gene overrepresentation in molecular_function category:
| Log-likelihood per target | Total log-likelihood | Term | Description |
|---|---|---|---|
| 8.0 | 39.8 | GO:0045503 | dynein light chain binding(GO:0045503) |
| 2.0 | 7.8 | GO:0005008 | hepatocyte growth factor-activated receptor activity(GO:0005008) |
| 1.6 | 14.5 | GO:0032050 | clathrin heavy chain binding(GO:0032050) |
| 1.4 | 4.3 | GO:0050827 | toxin receptor binding(GO:0050827) |
| 1.3 | 3.9 | GO:0048248 | CXCR3 chemokine receptor binding(GO:0048248) |
| 1.2 | 3.5 | GO:1990450 | linear polyubiquitin binding(GO:1990450) |
| 1.0 | 3.1 | GO:0004471 | malic enzyme activity(GO:0004470) malate dehydrogenase (decarboxylating) (NAD+) activity(GO:0004471) |
| 0.8 | 4.9 | GO:0035381 | extracellular ATP-gated cation channel activity(GO:0004931) ATP-gated ion channel activity(GO:0035381) |
| 0.8 | 4.9 | GO:0036435 | K48-linked polyubiquitin binding(GO:0036435) |
| 0.7 | 4.4 | GO:0008486 | diphosphoinositol-polyphosphate diphosphatase activity(GO:0008486) |
| 0.7 | 23.8 | GO:0001106 | RNA polymerase II transcription corepressor activity(GO:0001106) |
| 0.7 | 3.4 | GO:0004105 | choline-phosphate cytidylyltransferase activity(GO:0004105) |
| 0.7 | 4.6 | GO:0032795 | G-protein coupled adenosine receptor activity(GO:0001609) heterotrimeric G-protein binding(GO:0032795) |
| 0.7 | 2.6 | GO:0031694 | alpha-2A adrenergic receptor binding(GO:0031694) |
| 0.6 | 3.5 | GO:0032051 | clathrin light chain binding(GO:0032051) |
| 0.6 | 2.9 | GO:0005222 | intracellular cAMP activated cation channel activity(GO:0005222) |
| 0.6 | 3.5 | GO:0070699 | type II activin receptor binding(GO:0070699) |
| 0.5 | 4.7 | GO:0004634 | phosphopyruvate hydratase activity(GO:0004634) |
| 0.5 | 2.0 | GO:0003883 | CTP synthase activity(GO:0003883) |
| 0.5 | 11.3 | GO:0017075 | syntaxin-1 binding(GO:0017075) |
| 0.5 | 3.3 | GO:0034452 | dynactin binding(GO:0034452) |
| 0.4 | 4.2 | GO:0031749 | D2 dopamine receptor binding(GO:0031749) |
| 0.4 | 6.2 | GO:0015269 | calcium-activated potassium channel activity(GO:0015269) |
| 0.4 | 6.2 | GO:0031702 | type 1 angiotensin receptor binding(GO:0031702) |
| 0.4 | 1.2 | GO:0034647 | histone demethylase activity (H3-trimethyl-K4 specific)(GO:0034647) |
| 0.4 | 1.5 | GO:0031727 | CCR2 chemokine receptor binding(GO:0031727) |
| 0.3 | 1.5 | GO:0005250 | A-type (transient outward) potassium channel activity(GO:0005250) |
| 0.3 | 1.7 | GO:0071074 | eukaryotic initiation factor eIF2 binding(GO:0071074) |
| 0.3 | 2.9 | GO:0004017 | adenylate kinase activity(GO:0004017) |
| 0.2 | 3.5 | GO:0008601 | protein phosphatase type 2A regulator activity(GO:0008601) |
| 0.2 | 0.9 | GO:0008853 | exodeoxyribonuclease III activity(GO:0008853) |
| 0.2 | 13.9 | GO:0003777 | microtubule motor activity(GO:0003777) |
| 0.2 | 2.3 | GO:0022841 | potassium ion leak channel activity(GO:0022841) |
| 0.2 | 9.7 | GO:0045296 | cadherin binding(GO:0045296) |
| 0.2 | 4.4 | GO:0004298 | threonine-type endopeptidase activity(GO:0004298) threonine-type peptidase activity(GO:0070003) |
| 0.2 | 1.0 | GO:0015450 | P-P-bond-hydrolysis-driven protein transmembrane transporter activity(GO:0015450) |
| 0.2 | 0.8 | GO:0034513 | box H/ACA snoRNA binding(GO:0034513) |
| 0.2 | 9.3 | GO:0001105 | RNA polymerase II transcription coactivator activity(GO:0001105) |
| 0.2 | 0.6 | GO:0004816 | asparagine-tRNA ligase activity(GO:0004816) |
| 0.2 | 2.9 | GO:0042608 | T cell receptor binding(GO:0042608) |
| 0.2 | 4.3 | GO:0032794 | GTPase activating protein binding(GO:0032794) |
| 0.2 | 6.4 | GO:0030215 | semaphorin receptor binding(GO:0030215) |
| 0.2 | 2.1 | GO:0008191 | metalloendopeptidase inhibitor activity(GO:0008191) |
| 0.2 | 4.7 | GO:0046965 | retinoid X receptor binding(GO:0046965) |
| 0.2 | 0.8 | GO:0005134 | interleukin-2 receptor binding(GO:0005134) |
| 0.2 | 0.8 | GO:0030144 | alpha-1,6-mannosylglycoprotein 6-beta-N-acetylglucosaminyltransferase activity(GO:0030144) |
| 0.1 | 4.9 | GO:0043014 | alpha-tubulin binding(GO:0043014) |
| 0.1 | 3.0 | GO:0042056 | chemoattractant activity(GO:0042056) |
| 0.1 | 2.2 | GO:0000900 | translation repressor activity, nucleic acid binding(GO:0000900) |
| 0.1 | 8.7 | GO:0005518 | collagen binding(GO:0005518) |
| 0.1 | 3.7 | GO:0001968 | fibronectin binding(GO:0001968) |
| 0.1 | 2.7 | GO:0050750 | low-density lipoprotein particle receptor binding(GO:0050750) |
| 0.1 | 1.9 | GO:0005545 | 1-phosphatidylinositol binding(GO:0005545) |
| 0.1 | 0.9 | GO:0015651 | quaternary ammonium group transmembrane transporter activity(GO:0015651) |
| 0.1 | 2.3 | GO:0070530 | K63-linked polyubiquitin binding(GO:0070530) |
| 0.1 | 2.9 | GO:0003785 | actin monomer binding(GO:0003785) |
| 0.1 | 0.3 | GO:0030350 | iron-responsive element binding(GO:0030350) |
| 0.1 | 0.6 | GO:0070579 | methylcytosine dioxygenase activity(GO:0070579) |
| 0.1 | 0.9 | GO:0043559 | insulin binding(GO:0043559) |
| 0.1 | 0.8 | GO:0050815 | phosphoserine binding(GO:0050815) |
| 0.1 | 1.1 | GO:0016920 | pyroglutamyl-peptidase activity(GO:0016920) |
| 0.1 | 1.7 | GO:0005540 | hyaluronic acid binding(GO:0005540) |
| 0.1 | 0.3 | GO:0005219 | ryanodine-sensitive calcium-release channel activity(GO:0005219) calcium-induced calcium release activity(GO:0048763) |
| 0.1 | 0.4 | GO:0015220 | choline transmembrane transporter activity(GO:0015220) |
| 0.1 | 1.7 | GO:0005337 | nucleoside transmembrane transporter activity(GO:0005337) |
| 0.1 | 0.7 | GO:0097153 | cysteine-type endopeptidase activity involved in apoptotic process(GO:0097153) |
| 0.1 | 1.1 | GO:0034211 | GTP-dependent protein kinase activity(GO:0034211) |
| 0.1 | 2.8 | GO:0005086 | ARF guanyl-nucleotide exchange factor activity(GO:0005086) |
| 0.1 | 2.4 | GO:0008748 | N-ethylmaleimide reductase activity(GO:0008748) reduced coenzyme F420 dehydrogenase activity(GO:0043738) sulfur oxygenase reductase activity(GO:0043826) malolactic enzyme activity(GO:0043883) NADPH:sulfur oxidoreductase activity(GO:0043914) epoxyqueuosine reductase activity(GO:0052693) |
| 0.1 | 1.3 | GO:0004190 | aspartic-type endopeptidase activity(GO:0004190) aspartic-type peptidase activity(GO:0070001) |
| 0.1 | 0.7 | GO:0019215 | intermediate filament binding(GO:0019215) |
| 0.1 | 3.5 | GO:0046875 | ephrin receptor binding(GO:0046875) |
| 0.1 | 1.0 | GO:0030346 | protein phosphatase 2B binding(GO:0030346) |
| 0.1 | 0.6 | GO:0005212 | structural constituent of eye lens(GO:0005212) |
| 0.1 | 0.2 | GO:1990254 | keratin filament binding(GO:1990254) |
| 0.1 | 3.2 | GO:0001228 | transcriptional activator activity, RNA polymerase II transcription regulatory region sequence-specific binding(GO:0001228) |
| 0.1 | 9.7 | GO:0017124 | SH3 domain binding(GO:0017124) |
| 0.1 | 6.0 | GO:0004860 | protein kinase inhibitor activity(GO:0004860) |
| 0.1 | 2.3 | GO:0043015 | gamma-tubulin binding(GO:0043015) |
| 0.1 | 0.8 | GO:0031489 | myosin V binding(GO:0031489) |
| 0.1 | 0.9 | GO:0008430 | selenium binding(GO:0008430) |
| 0.1 | 0.3 | GO:0005138 | interleukin-6 receptor binding(GO:0005138) |
| 0.1 | 2.2 | GO:0004683 | calmodulin-dependent protein kinase activity(GO:0004683) |
| 0.1 | 0.5 | GO:0005007 | fibroblast growth factor-activated receptor activity(GO:0005007) |
| 0.1 | 1.7 | GO:0017022 | myosin binding(GO:0017022) |
| 0.1 | 8.1 | GO:0005057 | receptor signaling protein activity(GO:0005057) |
| 0.1 | 0.5 | GO:0008889 | glycerophosphodiester phosphodiesterase activity(GO:0008889) |
| 0.0 | 5.4 | GO:0005089 | Rho guanyl-nucleotide exchange factor activity(GO:0005089) |
| 0.0 | 5.4 | GO:0004725 | protein tyrosine phosphatase activity(GO:0004725) |
| 0.0 | 0.7 | GO:0035613 | RNA stem-loop binding(GO:0035613) |
| 0.0 | 2.7 | GO:0019003 | GDP binding(GO:0019003) |
| 0.0 | 0.3 | GO:0005087 | Ran guanyl-nucleotide exchange factor activity(GO:0005087) |
| 0.0 | 1.0 | GO:0008432 | JUN kinase binding(GO:0008432) |
| 0.0 | 1.6 | GO:0032266 | phosphatidylinositol-3-phosphate binding(GO:0032266) |
| 0.0 | 1.0 | GO:0005112 | Notch binding(GO:0005112) |
| 0.0 | 7.0 | GO:0008017 | microtubule binding(GO:0008017) |
| 0.0 | 7.9 | GO:0042393 | histone binding(GO:0042393) |
| 0.0 | 6.0 | GO:0035091 | phosphatidylinositol binding(GO:0035091) |
| 0.0 | 0.2 | GO:0047276 | N-acetyllactosaminide 3-alpha-galactosyltransferase activity(GO:0047276) |
| 0.0 | 1.9 | GO:0004896 | cytokine receptor activity(GO:0004896) |
| 0.0 | 2.9 | GO:0030674 | protein binding, bridging(GO:0030674) |
| 0.0 | 0.2 | GO:0019870 | potassium channel inhibitor activity(GO:0019870) |
| 0.0 | 1.7 | GO:0016620 | oxidoreductase activity, acting on the aldehyde or oxo group of donors, NAD or NADP as acceptor(GO:0016620) |
| 0.0 | 0.2 | GO:0070300 | phosphatidic acid binding(GO:0070300) |
| 0.0 | 0.7 | GO:0048020 | CCR chemokine receptor binding(GO:0048020) |
| 0.0 | 3.0 | GO:0008565 | protein transporter activity(GO:0008565) |
| 0.0 | 1.8 | GO:0015179 | L-amino acid transmembrane transporter activity(GO:0015179) |
| 0.0 | 0.5 | GO:0001671 | ATPase activator activity(GO:0001671) |
| 0.0 | 0.2 | GO:0030159 | receptor signaling complex scaffold activity(GO:0030159) |
| 0.0 | 0.4 | GO:0005521 | lamin binding(GO:0005521) |
| 0.0 | 1.1 | GO:0043774 | UDP-N-acetylmuramoylalanyl-D-glutamyl-2,6-diaminopimelate-D-alanyl-D-alanine ligase activity(GO:0008766) ribosomal S6-glutamic acid ligase activity(GO:0018169) coenzyme F420-0 gamma-glutamyl ligase activity(GO:0043773) coenzyme F420-2 alpha-glutamyl ligase activity(GO:0043774) protein-glycine ligase activity(GO:0070735) protein-glycine ligase activity, initiating(GO:0070736) protein-glycine ligase activity, elongating(GO:0070737) tubulin-glycine ligase activity(GO:0070738) |
| 0.0 | 1.4 | GO:0005262 | calcium channel activity(GO:0005262) |
| 0.0 | 2.3 | GO:0017137 | Rab GTPase binding(GO:0017137) |
| 0.0 | 3.4 | GO:0030695 | GTPase regulator activity(GO:0030695) |
| 0.0 | 1.6 | GO:0005543 | phospholipid binding(GO:0005543) |
| 0.0 | 0.6 | GO:0001205 | transcriptional activator activity, RNA polymerase II distal enhancer sequence-specific binding(GO:0001205) |
| 0.0 | 0.1 | GO:0016401 | palmitoyl-CoA oxidase activity(GO:0016401) |
| 0.0 | 1.4 | GO:0015399 | primary active transmembrane transporter activity(GO:0015399) P-P-bond-hydrolysis-driven transmembrane transporter activity(GO:0015405) ATPase activity, coupled to transmembrane movement of substances(GO:0042626) |
| 0.0 | 0.4 | GO:0003746 | translation elongation factor activity(GO:0003746) |
| 0.0 | 0.0 | GO:0030881 | beta-2-microglobulin binding(GO:0030881) |
| 0.0 | 0.2 | GO:0031593 | polyubiquitin binding(GO:0031593) |
|
|
|
|