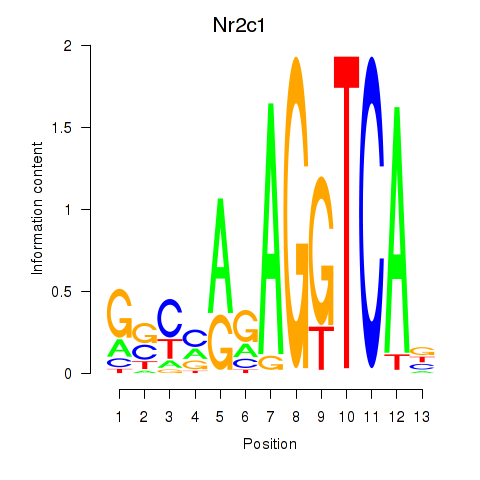
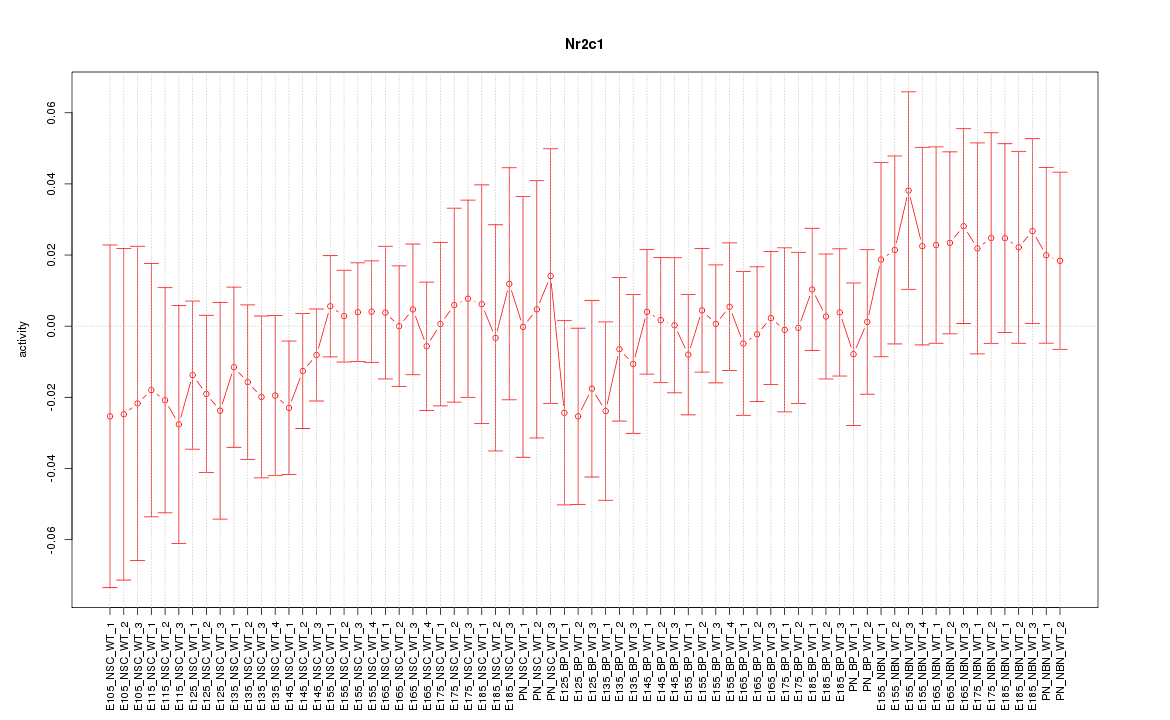
Motif ID: Nr2c1
Z-value: 0.609
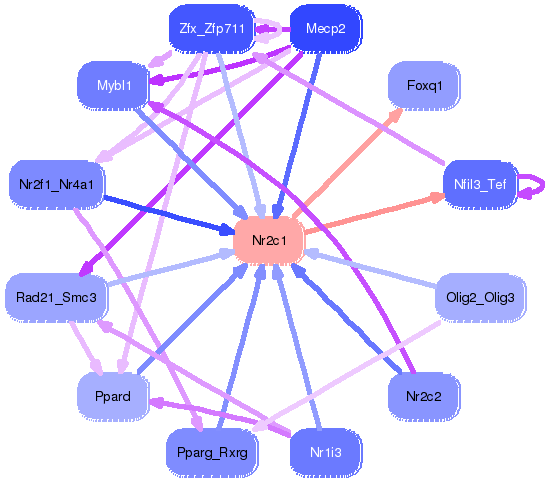
Transcription factors associated with Nr2c1:
| Gene Symbol | Entrez ID | Gene Name |
|---|---|---|
| Nr2c1 | ENSMUSG00000005897.8 | Nr2c1 |
Activity-expression correlation:
| Gene Symbol | Promoter | Pearson corr. coef. | P-value | Plot |
|---|---|---|---|---|
| Nr2c1 | mm10_v2_chr10_+_94147982_94148023 | -0.36 | 2.2e-03 | Click! |


Top targets:
Gene overrepresentation in biological_process category:
| Log-likelihood per target | Total log-likelihood | Term | Description |
|---|---|---|---|
| 1.7 | 5.0 | GO:0071929 | alpha-tubulin acetylation(GO:0071929) |
| 1.1 | 3.3 | GO:1900149 | positive regulation of Schwann cell migration(GO:1900149) |
| 0.8 | 4.7 | GO:0030643 | cellular phosphate ion homeostasis(GO:0030643) cellular trivalent inorganic anion homeostasis(GO:0072502) |
| 0.4 | 3.0 | GO:0001887 | selenium compound metabolic process(GO:0001887) |
| 0.4 | 1.9 | GO:0043314 | negative regulation of neutrophil degranulation(GO:0043314) negative regulation of blood vessel remodeling(GO:0060313) |
| 0.3 | 1.4 | GO:0032275 | luteinizing hormone secretion(GO:0032275) positive regulation of gonadotropin secretion(GO:0032278) |
| 0.3 | 6.1 | GO:0048172 | regulation of short-term neuronal synaptic plasticity(GO:0048172) |
| 0.3 | 1.0 | GO:0014873 | response to muscle activity involved in regulation of muscle adaptation(GO:0014873) |
| 0.3 | 0.9 | GO:0070973 | COPI-coated vesicle budding(GO:0035964) protein localization to endoplasmic reticulum exit site(GO:0070973) |
| 0.3 | 0.9 | GO:1902336 | neuropilin signaling pathway(GO:0038189) VEGF-activated neuropilin signaling pathway(GO:0038190) positive regulation of retinal ganglion cell axon guidance(GO:1902336) |
| 0.3 | 1.6 | GO:0016557 | peroxisome membrane biogenesis(GO:0016557) |
| 0.3 | 1.6 | GO:0007197 | adenylate cyclase-inhibiting G-protein coupled acetylcholine receptor signaling pathway(GO:0007197) phospholipase C-activating G-protein coupled acetylcholine receptor signaling pathway(GO:0007207) |
| 0.2 | 1.1 | GO:0010724 | regulation of definitive erythrocyte differentiation(GO:0010724) |
| 0.2 | 5.4 | GO:0007214 | gamma-aminobutyric acid signaling pathway(GO:0007214) |
| 0.2 | 1.4 | GO:0045200 | establishment or maintenance of neuroblast polarity(GO:0045196) establishment of neuroblast polarity(GO:0045200) |
| 0.2 | 1.2 | GO:0006646 | phosphatidylethanolamine biosynthetic process(GO:0006646) |
| 0.2 | 1.4 | GO:0032264 | IMP salvage(GO:0032264) |
| 0.2 | 0.5 | GO:0015938 | coenzyme A catabolic process(GO:0015938) nucleoside bisphosphate catabolic process(GO:0033869) ribonucleoside bisphosphate catabolic process(GO:0034031) purine nucleoside bisphosphate catabolic process(GO:0034034) |
| 0.1 | 2.4 | GO:0007095 | mitotic G2 DNA damage checkpoint(GO:0007095) |
| 0.1 | 2.4 | GO:0001553 | luteinization(GO:0001553) |
| 0.1 | 0.4 | GO:0045204 | MAPK export from nucleus(GO:0045204) |
| 0.1 | 0.5 | GO:0035521 | monoubiquitinated histone deubiquitination(GO:0035521) monoubiquitinated histone H2A deubiquitination(GO:0035522) |
| 0.1 | 0.6 | GO:0030240 | skeletal muscle thin filament assembly(GO:0030240) |
| 0.1 | 1.1 | GO:0034551 | respiratory chain complex III assembly(GO:0017062) mitochondrial respiratory chain complex III assembly(GO:0034551) mitochondrial respiratory chain complex III biogenesis(GO:0097033) |
| 0.1 | 3.4 | GO:0015991 | energy coupled proton transmembrane transport, against electrochemical gradient(GO:0015988) ATP hydrolysis coupled proton transport(GO:0015991) ATP hydrolysis coupled transmembrane transport(GO:0090662) |
| 0.1 | 2.2 | GO:0031115 | negative regulation of microtubule polymerization(GO:0031115) |
| 0.1 | 0.4 | GO:0019372 | lipoxygenase pathway(GO:0019372) |
| 0.1 | 0.3 | GO:0033615 | mitochondrial proton-transporting ATP synthase complex assembly(GO:0033615) |
| 0.1 | 1.0 | GO:0031665 | negative regulation of lipopolysaccharide-mediated signaling pathway(GO:0031665) |
| 0.1 | 0.4 | GO:0015793 | glycerol transport(GO:0015793) |
| 0.1 | 2.2 | GO:2001240 | negative regulation of signal transduction in absence of ligand(GO:1901099) negative regulation of extrinsic apoptotic signaling pathway in absence of ligand(GO:2001240) |
| 0.1 | 0.7 | GO:0042760 | very long-chain fatty acid catabolic process(GO:0042760) |
| 0.1 | 3.0 | GO:0034605 | cellular response to heat(GO:0034605) |
| 0.1 | 0.4 | GO:0015879 | carnitine transport(GO:0015879) |
| 0.1 | 2.7 | GO:1901381 | positive regulation of potassium ion transmembrane transport(GO:1901381) |
| 0.1 | 1.4 | GO:0031069 | hair follicle morphogenesis(GO:0031069) |
| 0.1 | 0.5 | GO:0032060 | bleb assembly(GO:0032060) |
| 0.1 | 0.6 | GO:0080009 | mRNA methylation(GO:0080009) |
| 0.1 | 10.6 | GO:0010977 | negative regulation of neuron projection development(GO:0010977) |
| 0.1 | 2.3 | GO:0031103 | axon regeneration(GO:0031103) |
| 0.0 | 0.6 | GO:0048268 | clathrin coat assembly(GO:0048268) |
| 0.0 | 5.2 | GO:0099643 | neurotransmitter secretion(GO:0007269) signal release from synapse(GO:0099643) |
| 0.0 | 0.2 | GO:0032485 | regulation of Ral protein signal transduction(GO:0032485) |
| 0.0 | 0.4 | GO:0016559 | peroxisome fission(GO:0016559) dicarboxylic acid catabolic process(GO:0043649) |
| 0.0 | 1.2 | GO:1900078 | positive regulation of cellular response to insulin stimulus(GO:1900078) |
| 0.0 | 3.6 | GO:0098792 | xenophagy(GO:0098792) |
| 0.0 | 0.2 | GO:0070131 | positive regulation of mitochondrial translation(GO:0070131) |
| 0.0 | 0.4 | GO:0010107 | potassium ion import(GO:0010107) |
| 0.0 | 1.2 | GO:0006493 | protein O-linked glycosylation(GO:0006493) |
| 0.0 | 0.1 | GO:1990928 | response to amino acid starvation(GO:1990928) |
| 0.0 | 3.7 | GO:0002244 | hematopoietic progenitor cell differentiation(GO:0002244) |
| 0.0 | 0.4 | GO:0006744 | ubiquinone biosynthetic process(GO:0006744) |
| 0.0 | 0.1 | GO:0046485 | ether lipid metabolic process(GO:0046485) |
| 0.0 | 1.3 | GO:0014065 | phosphatidylinositol 3-kinase signaling(GO:0014065) |
| 0.0 | 0.5 | GO:0030970 | retrograde protein transport, ER to cytosol(GO:0030970) |
| 0.0 | 0.2 | GO:0032981 | NADH dehydrogenase complex assembly(GO:0010257) mitochondrial respiratory chain complex I assembly(GO:0032981) mitochondrial respiratory chain complex I biogenesis(GO:0097031) |
Gene overrepresentation in cellular_component category:
| Log-likelihood per target | Total log-likelihood | Term | Description |
|---|---|---|---|
| 1.1 | 3.3 | GO:0072534 | perineuronal net(GO:0072534) |
| 1.1 | 5.4 | GO:0038039 | G-protein coupled receptor heterodimeric complex(GO:0038039) |
| 0.8 | 5.0 | GO:0097427 | microtubule bundle(GO:0097427) |
| 0.4 | 3.3 | GO:0033180 | proton-transporting V-type ATPase, V1 domain(GO:0033180) |
| 0.2 | 11.2 | GO:0030672 | synaptic vesicle membrane(GO:0030672) exocytic vesicle membrane(GO:0099501) |
| 0.2 | 6.6 | GO:0046658 | anchored component of plasma membrane(GO:0046658) |
| 0.1 | 3.6 | GO:0071565 | nBAF complex(GO:0071565) |
| 0.1 | 11.2 | GO:0031225 | anchored component of membrane(GO:0031225) |
| 0.1 | 1.7 | GO:0032279 | asymmetric synapse(GO:0032279) |
| 0.1 | 2.7 | GO:0030673 | axolemma(GO:0030673) |
| 0.1 | 0.6 | GO:0036396 | MIS complex(GO:0036396) mRNA editing complex(GO:0045293) |
| 0.1 | 1.4 | GO:0017146 | NMDA selective glutamate receptor complex(GO:0017146) |
| 0.1 | 0.5 | GO:0000836 | ER ubiquitin ligase complex(GO:0000835) Hrd1p ubiquitin ligase complex(GO:0000836) |
| 0.1 | 1.6 | GO:0005779 | integral component of peroxisomal membrane(GO:0005779) |
| 0.0 | 0.9 | GO:0005782 | peroxisomal matrix(GO:0005782) microbody lumen(GO:0031907) |
| 0.0 | 0.4 | GO:0031528 | microvillus membrane(GO:0031528) |
| 0.0 | 1.5 | GO:0030173 | integral component of Golgi membrane(GO:0030173) |
| 0.0 | 1.6 | GO:0005882 | intermediate filament(GO:0005882) |
| 0.0 | 2.2 | GO:0043198 | dendritic shaft(GO:0043198) |
| 0.0 | 0.6 | GO:0005865 | striated muscle thin filament(GO:0005865) |
| 0.0 | 0.1 | GO:0005850 | eukaryotic translation initiation factor 2 complex(GO:0005850) |
| 0.0 | 0.3 | GO:0035631 | CD40 receptor complex(GO:0035631) |
| 0.0 | 1.4 | GO:0014704 | intercalated disc(GO:0014704) |
| 0.0 | 0.9 | GO:0005788 | endoplasmic reticulum lumen(GO:0005788) |
| 0.0 | 1.0 | GO:0016529 | sarcoplasmic reticulum(GO:0016529) |
| 0.0 | 0.6 | GO:0030131 | clathrin adaptor complex(GO:0030131) |
| 0.0 | 0.1 | GO:0044233 | ER-mitochondrion membrane contact site(GO:0044233) |
Gene overrepresentation in molecular_function category:
| Log-likelihood per target | Total log-likelihood | Term | Description |
|---|---|---|---|
| 0.9 | 5.4 | GO:0004965 | G-protein coupled GABA receptor activity(GO:0004965) |
| 0.7 | 2.2 | GO:0052658 | inositol-1,4,5-trisphosphate 5-phosphatase activity(GO:0052658) |
| 0.6 | 4.7 | GO:0001618 | virus receptor activity(GO:0001618) |
| 0.5 | 2.7 | GO:0003828 | alpha-N-acetylneuraminate alpha-2,8-sialyltransferase activity(GO:0003828) |
| 0.4 | 1.1 | GO:0070137 | ubiquitin-like protein-specific endopeptidase activity(GO:0070137) SUMO-specific endopeptidase activity(GO:0070139) |
| 0.3 | 1.2 | GO:0004103 | choline kinase activity(GO:0004103) |
| 0.3 | 0.9 | GO:0043183 | vascular endothelial growth factor receptor 1 binding(GO:0043183) |
| 0.3 | 1.6 | GO:0016907 | G-protein coupled acetylcholine receptor activity(GO:0016907) |
| 0.2 | 3.0 | GO:0008430 | selenium binding(GO:0008430) |
| 0.2 | 1.4 | GO:0003876 | AMP deaminase activity(GO:0003876) adenosine-phosphate deaminase activity(GO:0047623) |
| 0.1 | 0.4 | GO:0005124 | scavenger receptor binding(GO:0005124) |
| 0.1 | 3.3 | GO:0046961 | proton-transporting ATPase activity, rotational mechanism(GO:0046961) |
| 0.1 | 3.3 | GO:0017134 | fibroblast growth factor binding(GO:0017134) |
| 0.1 | 0.4 | GO:0050347 | trans-hexaprenyltranstransferase activity(GO:0000010) trans-octaprenyltranstransferase activity(GO:0050347) |
| 0.1 | 2.7 | GO:0005251 | delayed rectifier potassium channel activity(GO:0005251) |
| 0.1 | 0.8 | GO:0008526 | phosphatidylinositol transporter activity(GO:0008526) |
| 0.1 | 0.5 | GO:0047184 | 1-acylglycerophosphocholine O-acyltransferase activity(GO:0047184) |
| 0.1 | 1.1 | GO:0016290 | palmitoyl-CoA hydrolase activity(GO:0016290) |
| 0.1 | 1.4 | GO:0071855 | neuropeptide receptor binding(GO:0071855) |
| 0.1 | 1.2 | GO:0050811 | GABA receptor binding(GO:0050811) |
| 0.1 | 0.8 | GO:0016701 | oxidoreductase activity, acting on single donors with incorporation of molecular oxygen(GO:0016701) oxidoreductase activity, acting on single donors with incorporation of molecular oxygen, incorporation of two atoms of oxygen(GO:0016702) |
| 0.1 | 0.4 | GO:0015265 | urea channel activity(GO:0015265) |
| 0.1 | 4.6 | GO:0061733 | peptide-lysine-N-acetyltransferase activity(GO:0061733) |
| 0.1 | 0.9 | GO:0034237 | protein kinase A regulatory subunit binding(GO:0034237) |
| 0.0 | 0.5 | GO:0097027 | ubiquitin-protein transferase activator activity(GO:0097027) |
| 0.0 | 0.9 | GO:0080025 | phosphatidylinositol-3,5-bisphosphate binding(GO:0080025) |
| 0.0 | 1.4 | GO:0001540 | beta-amyloid binding(GO:0001540) |
| 0.0 | 4.2 | GO:0004702 | receptor signaling protein serine/threonine kinase activity(GO:0004702) |
| 0.0 | 1.4 | GO:0017080 | sodium channel regulator activity(GO:0017080) |
| 0.0 | 2.8 | GO:0004860 | protein kinase inhibitor activity(GO:0004860) |
| 0.0 | 0.4 | GO:0005242 | inward rectifier potassium channel activity(GO:0005242) |
| 0.0 | 0.2 | GO:0004652 | polynucleotide adenylyltransferase activity(GO:0004652) |
| 0.0 | 0.1 | GO:0016714 | oxidoreductase activity, acting on paired donors, with incorporation or reduction of molecular oxygen, reduced pteridine as one donor, and incorporation of one atom of oxygen(GO:0016714) |
| 0.0 | 0.5 | GO:0042975 | peroxisome proliferator activated receptor binding(GO:0042975) |
| 0.0 | 0.1 | GO:0103116 | alpha-D-galactofuranose transporter activity(GO:0103116) |
| 0.0 | 1.9 | GO:0005089 | Rho guanyl-nucleotide exchange factor activity(GO:0005089) |
| 0.0 | 1.2 | GO:0005496 | steroid binding(GO:0005496) |
| 0.0 | 0.5 | GO:0016831 | carboxy-lyase activity(GO:0016831) |
| 0.0 | 0.4 | GO:0071889 | 14-3-3 protein binding(GO:0071889) |