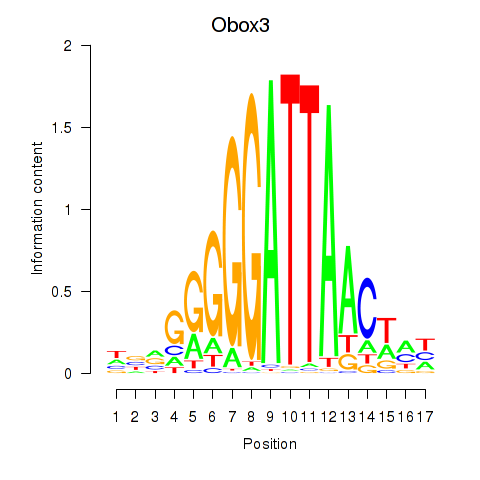
Motif ID: Obox3
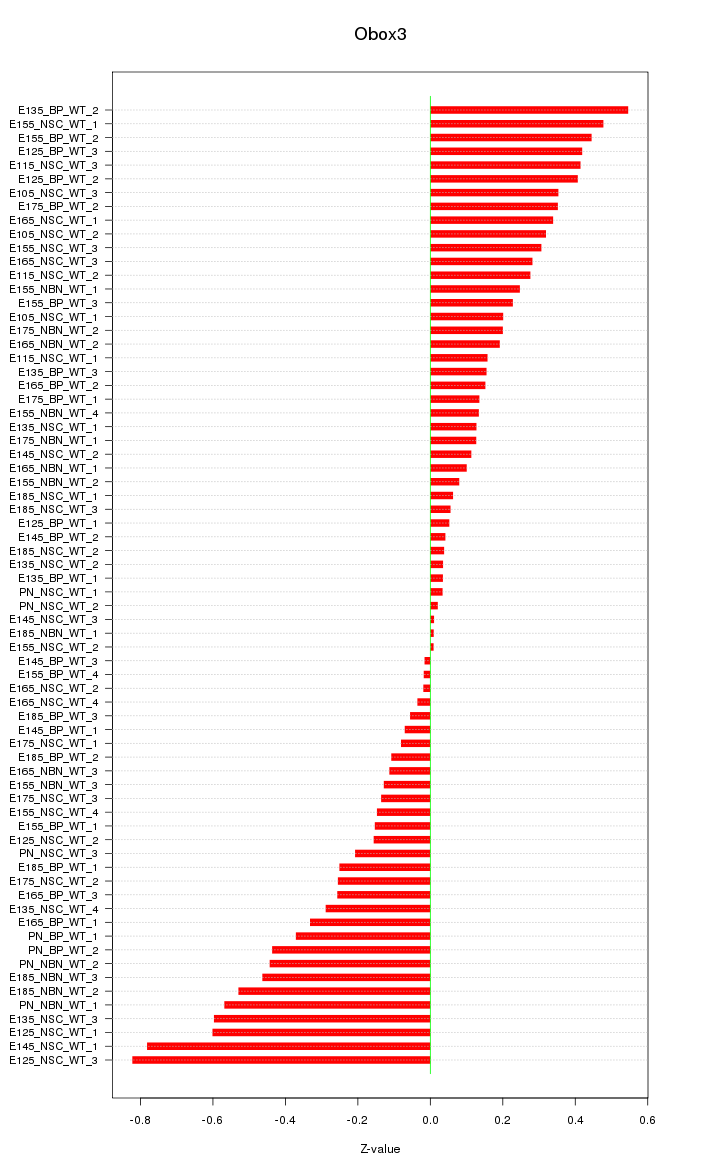
Z-value: 0.300
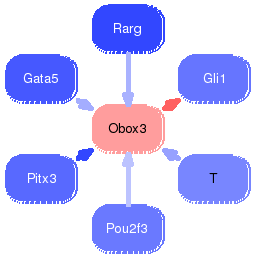
Transcription factors associated with Obox3:
| Gene Symbol | Entrez ID | Gene Name |
|---|---|---|
| Obox3 | ENSMUSG00000066772.6 | Obox3 |
Activity-expression correlation:
| Gene Symbol | Promoter | Pearson corr. coef. | P-value | Plot |
|---|---|---|---|---|
| Obox3 | mm10_v2_chr7_-_15627876_15627876 | -0.05 | 6.8e-01 | Click! |

Top targets:
Gene overrepresentation in biological_process category:
| Log-likelihood per target | Total log-likelihood | Term | Description |
|---|---|---|---|
| 1.0 | 4.9 | GO:0015671 | oxygen transport(GO:0015671) |
| 0.4 | 0.4 | GO:0060032 | notochord regression(GO:0060032) |
| 0.2 | 0.5 | GO:1903232 | melanosome assembly(GO:1903232) |
| 0.2 | 0.5 | GO:1904049 | regulation of spontaneous neurotransmitter secretion(GO:1904048) negative regulation of spontaneous neurotransmitter secretion(GO:1904049) |
| 0.1 | 1.0 | GO:0033504 | floor plate development(GO:0033504) |
| 0.1 | 0.3 | GO:0048698 | negative regulation of collateral sprouting in absence of injury(GO:0048698) |
| 0.0 | 0.3 | GO:1903690 | negative regulation of wound healing, spreading of epidermal cells(GO:1903690) |
| 0.0 | 0.2 | GO:0006543 | glutamine catabolic process(GO:0006543) |
| 0.0 | 0.4 | GO:0014824 | artery smooth muscle contraction(GO:0014824) |
| 0.0 | 0.3 | GO:0007250 | activation of NF-kappaB-inducing kinase activity(GO:0007250) |
| 0.0 | 0.1 | GO:0014016 | neuroblast differentiation(GO:0014016) response to folic acid(GO:0051593) |
| 0.0 | 0.3 | GO:0042790 | transcription of nuclear large rRNA transcript from RNA polymerase I promoter(GO:0042790) |
| 0.0 | 0.1 | GO:1902626 | assembly of large subunit precursor of preribosome(GO:1902626) |
| 0.0 | 0.7 | GO:0060325 | face morphogenesis(GO:0060325) |
Gene overrepresentation in cellular_component category:
| Log-likelihood per target | Total log-likelihood | Term | Description |
|---|---|---|---|
| 0.6 | 4.9 | GO:0005833 | hemoglobin complex(GO:0005833) |
| 0.1 | 0.5 | GO:1990761 | growth cone lamellipodium(GO:1990761) |
| 0.1 | 0.3 | GO:0030981 | cortical microtubule cytoskeleton(GO:0030981) |
| 0.0 | 0.5 | GO:0001739 | sex chromatin(GO:0001739) |
| 0.0 | 0.6 | GO:0030061 | mitochondrial crista(GO:0030061) |
| 0.0 | 0.4 | GO:0097542 | ciliary tip(GO:0097542) |
| 0.0 | 0.3 | GO:0008385 | IkappaB kinase complex(GO:0008385) |
| 0.0 | 0.8 | GO:0030131 | clathrin adaptor complex(GO:0030131) |
| 0.0 | 1.0 | GO:0005814 | centriole(GO:0005814) |
Gene overrepresentation in molecular_function category:
| Log-likelihood per target | Total log-likelihood | Term | Description |
|---|---|---|---|
| 1.2 | 4.9 | GO:0031721 | hemoglobin alpha binding(GO:0031721) |
| 0.2 | 0.5 | GO:0035651 | AP-1 adaptor complex binding(GO:0035650) AP-3 adaptor complex binding(GO:0035651) |
| 0.1 | 0.3 | GO:1990450 | linear polyubiquitin binding(GO:1990450) |
| 0.1 | 0.3 | GO:0043515 | kinetochore binding(GO:0043515) |
| 0.0 | 0.2 | GO:0004359 | glutaminase activity(GO:0004359) |
| 0.0 | 0.2 | GO:0004726 | non-membrane spanning protein tyrosine phosphatase activity(GO:0004726) |
| 0.0 | 0.1 | GO:0004104 | cholinesterase activity(GO:0004104) choline binding(GO:0033265) |
| 0.0 | 0.6 | GO:0016676 | cytochrome-c oxidase activity(GO:0004129) heme-copper terminal oxidase activity(GO:0015002) oxidoreductase activity, acting on a heme group of donors, oxygen as acceptor(GO:0016676) |
| 0.0 | 0.1 | GO:0035374 | chondroitin sulfate binding(GO:0035374) |
| 0.0 | 0.4 | GO:0070402 | NADPH binding(GO:0070402) |
| 0.0 | 0.5 | GO:0050750 | low-density lipoprotein particle receptor binding(GO:0050750) |
| 0.0 | 0.4 | GO:0017160 | Ral GTPase binding(GO:0017160) |
| 0.0 | 0.5 | GO:0008157 | protein phosphatase 1 binding(GO:0008157) |