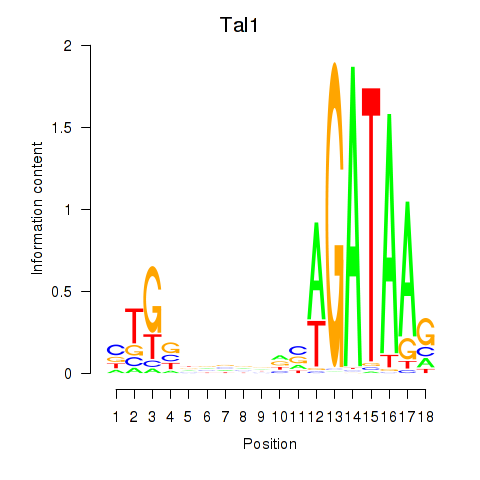
Motif ID: Tal1
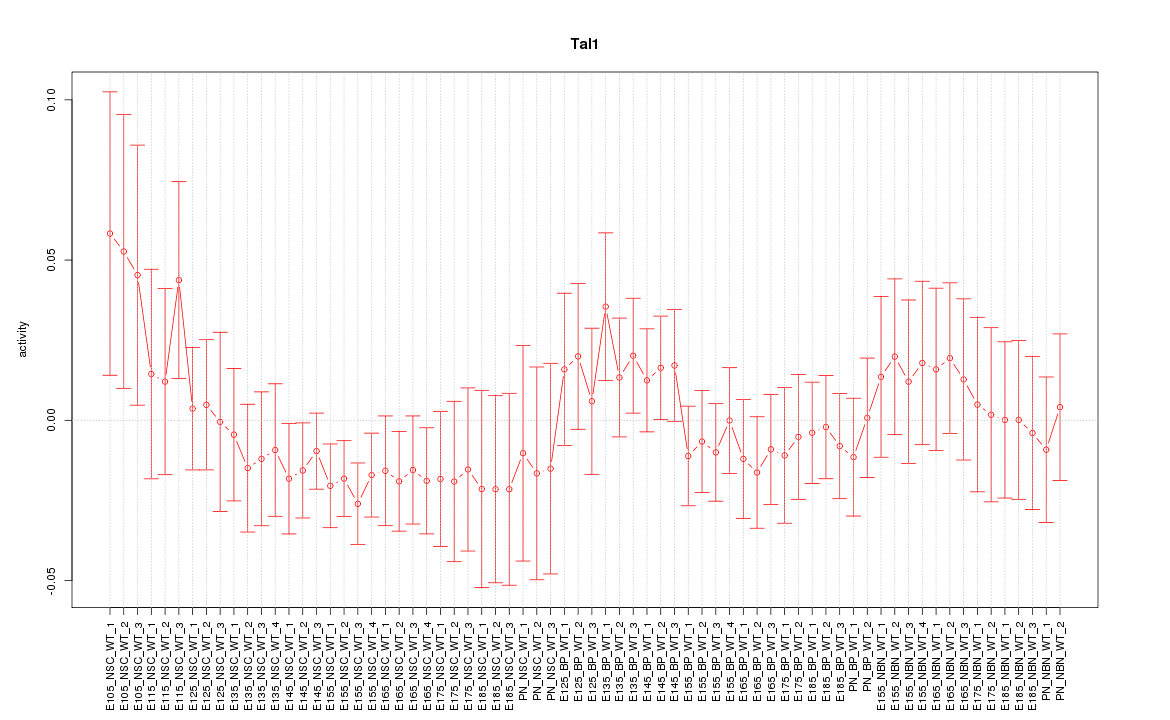
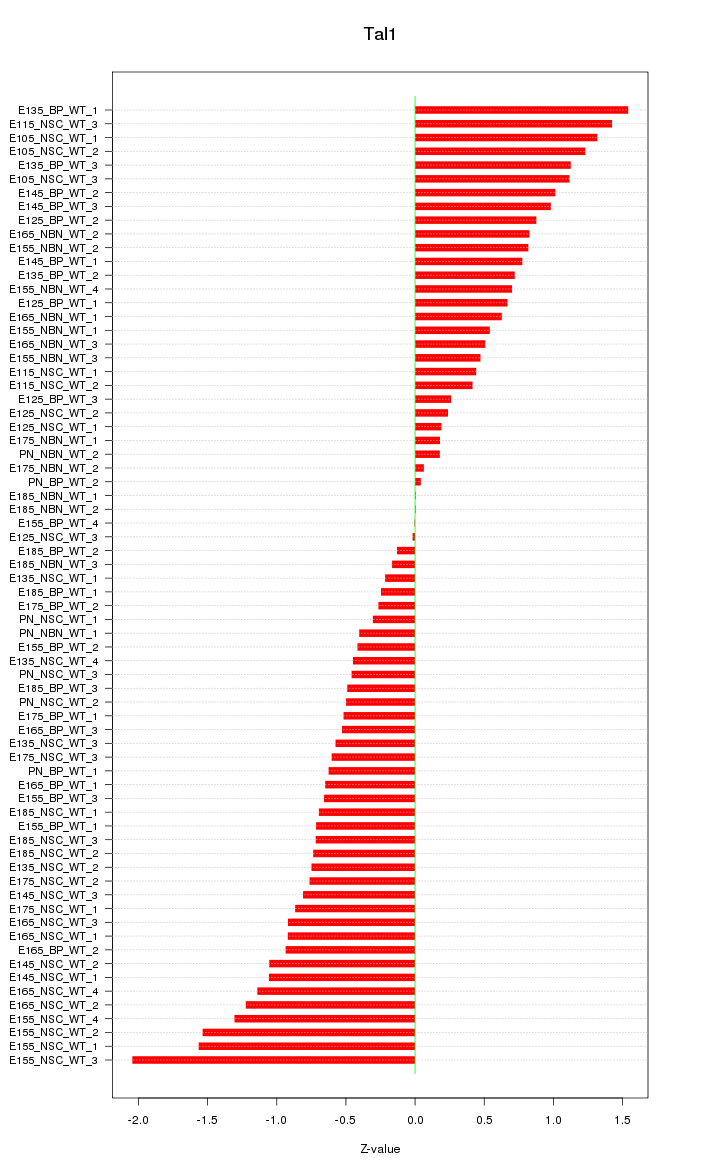
Z-value: 0.802
Transcription factors associated with Tal1:
| Gene Symbol | Entrez ID | Gene Name |
|---|---|---|
| Tal1 | ENSMUSG00000028717.6 | Tal1 |
Activity-expression correlation:
| Gene Symbol | Promoter | Pearson corr. coef. | P-value | Plot |
|---|---|---|---|---|
| Tal1 | mm10_v2_chr4_+_115059507_115059553 | 0.65 | 7.9e-10 | Click! |

Top targets:
Gene overrepresentation in biological_process category:
| Log-likelihood per target | Total log-likelihood | Term | Description |
|---|---|---|---|
| 11.7 | 58.7 | GO:0015671 | oxygen transport(GO:0015671) |
| 2.0 | 8.0 | GO:0032914 | positive regulation of transforming growth factor beta1 production(GO:0032914) |
| 1.5 | 4.5 | GO:0006428 | isoleucyl-tRNA aminoacylation(GO:0006428) |
| 1.3 | 7.7 | GO:0042866 | pyruvate biosynthetic process(GO:0042866) |
| 1.2 | 1.2 | GO:0019401 | alditol biosynthetic process(GO:0019401) |
| 1.0 | 5.0 | GO:0072488 | ammonium transmembrane transport(GO:0072488) |
| 0.8 | 3.1 | GO:0042905 | 9-cis-retinoic acid biosynthetic process(GO:0042904) 9-cis-retinoic acid metabolic process(GO:0042905) |
| 0.7 | 3.5 | GO:0047484 | regulation of response to osmotic stress(GO:0047484) |
| 0.7 | 2.0 | GO:0060244 | negative regulation of cell proliferation involved in contact inhibition(GO:0060244) glutamate secretion, neurotransmission(GO:0061535) |
| 0.6 | 5.3 | GO:0006071 | glycerol metabolic process(GO:0006071) |
| 0.5 | 1.5 | GO:0097623 | potassium ion export across plasma membrane(GO:0097623) |
| 0.5 | 1.0 | GO:1904742 | regulation of telomeric DNA binding(GO:1904742) |
| 0.4 | 3.1 | GO:0036072 | intramembranous ossification(GO:0001957) direct ossification(GO:0036072) |
| 0.4 | 4.2 | GO:0034242 | negative regulation of syncytium formation by plasma membrane fusion(GO:0034242) |
| 0.4 | 2.5 | GO:0051096 | telomere assembly(GO:0032202) positive regulation of helicase activity(GO:0051096) |
| 0.4 | 2.3 | GO:0002317 | plasma cell differentiation(GO:0002317) |
| 0.4 | 1.4 | GO:1901252 | regulation of intracellular transport of viral material(GO:1901252) |
| 0.3 | 1.3 | GO:0038128 | ERBB2 signaling pathway(GO:0038128) |
| 0.3 | 1.0 | GO:0035964 | COPI-coated vesicle budding(GO:0035964) |
| 0.3 | 2.0 | GO:0051461 | protein import into peroxisome matrix, docking(GO:0016560) regulation of corticotropin secretion(GO:0051459) positive regulation of corticotropin secretion(GO:0051461) |
| 0.3 | 3.1 | GO:0002693 | positive regulation of cellular extravasation(GO:0002693) |
| 0.3 | 1.5 | GO:1903690 | negative regulation of wound healing, spreading of epidermal cells(GO:1903690) |
| 0.3 | 1.5 | GO:0045218 | zonula adherens maintenance(GO:0045218) |
| 0.2 | 0.9 | GO:0071726 | response to diacyl bacterial lipopeptide(GO:0071724) cellular response to diacyl bacterial lipopeptide(GO:0071726) |
| 0.2 | 0.6 | GO:0006419 | alanyl-tRNA aminoacylation(GO:0006419) |
| 0.2 | 1.3 | GO:0021913 | regulation of transcription from RNA polymerase II promoter involved in spinal cord motor neuron fate specification(GO:0021912) regulation of transcription from RNA polymerase II promoter involved in ventral spinal cord interneuron specification(GO:0021913) |
| 0.2 | 2.5 | GO:0045603 | positive regulation of endothelial cell differentiation(GO:0045603) |
| 0.2 | 3.1 | GO:0046597 | negative regulation of viral entry into host cell(GO:0046597) |
| 0.2 | 0.9 | GO:0000189 | MAPK import into nucleus(GO:0000189) |
| 0.1 | 0.4 | GO:0032687 | negative regulation of interferon-alpha production(GO:0032687) |
| 0.1 | 1.5 | GO:0002098 | tRNA wobble uridine modification(GO:0002098) |
| 0.1 | 1.2 | GO:0061032 | visceral serous pericardium development(GO:0061032) |
| 0.1 | 1.1 | GO:0010804 | negative regulation of tumor necrosis factor-mediated signaling pathway(GO:0010804) |
| 0.1 | 0.7 | GO:0046501 | protoporphyrinogen IX metabolic process(GO:0046501) |
| 0.1 | 0.5 | GO:0002326 | B cell lineage commitment(GO:0002326) |
| 0.1 | 2.6 | GO:1903861 | regulation of dendrite extension(GO:1903859) positive regulation of dendrite extension(GO:1903861) |
| 0.1 | 1.8 | GO:0007202 | activation of phospholipase C activity(GO:0007202) positive regulation of execution phase of apoptosis(GO:1900119) |
| 0.1 | 0.4 | GO:0055071 | cellular manganese ion homeostasis(GO:0030026) Golgi calcium ion homeostasis(GO:0032468) manganese ion homeostasis(GO:0055071) |
| 0.1 | 0.7 | GO:0035360 | positive regulation of peroxisome proliferator activated receptor signaling pathway(GO:0035360) |
| 0.1 | 1.9 | GO:0034377 | plasma lipoprotein particle assembly(GO:0034377) |
| 0.1 | 0.9 | GO:2000601 | positive regulation of Arp2/3 complex-mediated actin nucleation(GO:2000601) |
| 0.1 | 5.8 | GO:1902653 | cholesterol biosynthetic process(GO:0006695) secondary alcohol biosynthetic process(GO:1902653) |
| 0.1 | 1.7 | GO:0046069 | cGMP catabolic process(GO:0046069) |
| 0.1 | 0.8 | GO:0086023 | adrenergic receptor signaling pathway involved in heart process(GO:0086023) |
| 0.1 | 0.7 | GO:0046085 | adenosine metabolic process(GO:0046085) |
| 0.1 | 0.7 | GO:0018206 | peptidyl-methionine modification(GO:0018206) |
| 0.1 | 1.6 | GO:0035855 | megakaryocyte development(GO:0035855) |
| 0.1 | 0.4 | GO:0006451 | selenocysteine incorporation(GO:0001514) translational readthrough(GO:0006451) |
| 0.1 | 0.3 | GO:0001980 | regulation of systemic arterial blood pressure by ischemic conditions(GO:0001980) |
| 0.1 | 1.1 | GO:0016226 | iron-sulfur cluster assembly(GO:0016226) metallo-sulfur cluster assembly(GO:0031163) |
| 0.1 | 1.0 | GO:0043968 | histone H2A acetylation(GO:0043968) |
| 0.0 | 0.1 | GO:0016126 | sterol biosynthetic process(GO:0016126) |
| 0.0 | 0.9 | GO:0051123 | RNA polymerase II transcriptional preinitiation complex assembly(GO:0051123) |
| 0.0 | 1.8 | GO:0015804 | neutral amino acid transport(GO:0015804) |
| 0.0 | 1.1 | GO:0071108 | protein K48-linked deubiquitination(GO:0071108) |
| 0.0 | 1.1 | GO:0035886 | vascular smooth muscle cell differentiation(GO:0035886) |
| 0.0 | 0.3 | GO:0006977 | DNA damage response, signal transduction by p53 class mediator resulting in cell cycle arrest(GO:0006977) signal transduction involved in mitotic G1 DNA damage checkpoint(GO:0072431) intracellular signal transduction involved in G1 DNA damage checkpoint(GO:1902400) |
| 0.0 | 0.3 | GO:0042730 | fibrinolysis(GO:0042730) |
| 0.0 | 0.1 | GO:0038108 | negative regulation of appetite by leptin-mediated signaling pathway(GO:0038108) |
| 0.0 | 0.7 | GO:0033119 | negative regulation of RNA splicing(GO:0033119) |
| 0.0 | 0.1 | GO:0018242 | protein O-linked glycosylation via serine(GO:0018242) |
| 0.0 | 1.2 | GO:0070534 | protein K63-linked ubiquitination(GO:0070534) |
| 0.0 | 0.5 | GO:0048268 | clathrin coat assembly(GO:0048268) |
| 0.0 | 0.3 | GO:0051482 | positive regulation of cytosolic calcium ion concentration involved in phospholipase C-activating G-protein coupled signaling pathway(GO:0051482) |
| 0.0 | 0.4 | GO:0042832 | defense response to protozoan(GO:0042832) |
| 0.0 | 0.4 | GO:0006353 | DNA-templated transcription, termination(GO:0006353) |
| 0.0 | 0.5 | GO:0071158 | positive regulation of cell cycle arrest(GO:0071158) |
| 0.0 | 0.4 | GO:0010719 | negative regulation of epithelial to mesenchymal transition(GO:0010719) |
| 0.0 | 0.1 | GO:1903802 | positive regulation of arachidonic acid secretion(GO:0090238) L-glutamate(1-) import into cell(GO:1903802) L-glutamate import into cell(GO:1990123) |
| 0.0 | 0.1 | GO:2001181 | positive regulation of interleukin-10 secretion(GO:2001181) |
| 0.0 | 0.9 | GO:0070527 | platelet aggregation(GO:0070527) |
| 0.0 | 0.2 | GO:0042761 | very long-chain fatty acid biosynthetic process(GO:0042761) |
| 0.0 | 0.1 | GO:0046485 | ether lipid metabolic process(GO:0046485) |
| 0.0 | 0.3 | GO:0051016 | barbed-end actin filament capping(GO:0051016) |
| 0.0 | 0.9 | GO:0007156 | homophilic cell adhesion via plasma membrane adhesion molecules(GO:0007156) |
| 0.0 | 1.0 | GO:0006888 | ER to Golgi vesicle-mediated transport(GO:0006888) |
| 0.0 | 1.1 | GO:0006334 | nucleosome assembly(GO:0006334) |
Gene overrepresentation in cellular_component category:
| Log-likelihood per target | Total log-likelihood | Term | Description |
|---|---|---|---|
| 7.3 | 58.7 | GO:0005833 | hemoglobin complex(GO:0005833) |
| 1.0 | 3.1 | GO:0005584 | collagen type I trimer(GO:0005584) |
| 0.8 | 7.9 | GO:0098643 | fibrillar collagen trimer(GO:0005583) banded collagen fibril(GO:0098643) |
| 0.5 | 2.0 | GO:0017071 | intracellular cyclic nucleotide activated cation channel complex(GO:0017071) |
| 0.4 | 2.5 | GO:0070187 | telosome(GO:0070187) |
| 0.3 | 1.2 | GO:0097454 | Schwann cell microvillus(GO:0097454) |
| 0.3 | 1.5 | GO:0036449 | microtubule minus-end(GO:0036449) |
| 0.2 | 1.5 | GO:0033588 | Elongator holoenzyme complex(GO:0033588) |
| 0.2 | 1.4 | GO:0071437 | invadopodium(GO:0071437) |
| 0.1 | 0.9 | GO:0046696 | lipopolysaccharide receptor complex(GO:0046696) |
| 0.1 | 0.9 | GO:0070847 | core mediator complex(GO:0070847) |
| 0.1 | 1.5 | GO:0045180 | basal cortex(GO:0045180) |
| 0.1 | 0.5 | GO:0000308 | cytoplasmic cyclin-dependent protein kinase holoenzyme complex(GO:0000308) |
| 0.1 | 0.5 | GO:0000788 | nuclear nucleosome(GO:0000788) |
| 0.1 | 0.7 | GO:0046581 | intercellular canaliculus(GO:0046581) |
| 0.1 | 1.0 | GO:0034663 | endoplasmic reticulum chaperone complex(GO:0034663) |
| 0.1 | 0.9 | GO:0031209 | SCAR complex(GO:0031209) |
| 0.1 | 1.1 | GO:0031616 | spindle pole centrosome(GO:0031616) |
| 0.1 | 0.3 | GO:0005861 | troponin complex(GO:0005861) |
| 0.1 | 0.6 | GO:0020005 | symbiont-containing vacuole membrane(GO:0020005) |
| 0.0 | 0.9 | GO:0008305 | integrin complex(GO:0008305) protein complex involved in cell adhesion(GO:0098636) |
| 0.0 | 0.7 | GO:0031143 | pseudopodium(GO:0031143) |
| 0.0 | 2.1 | GO:0045171 | intercellular bridge(GO:0045171) |
| 0.0 | 0.8 | GO:0033017 | sarcoplasmic reticulum membrane(GO:0033017) |
| 0.0 | 1.0 | GO:0043189 | NuA4 histone acetyltransferase complex(GO:0035267) H4/H2A histone acetyltransferase complex(GO:0043189) H4 histone acetyltransferase complex(GO:1902562) |
| 0.0 | 0.3 | GO:0038037 | G-protein coupled receptor dimeric complex(GO:0038037) G-protein coupled receptor complex(GO:0097648) |
| 0.0 | 0.3 | GO:0031362 | anchored component of external side of plasma membrane(GO:0031362) |
| 0.0 | 0.1 | GO:1902636 | kinociliary basal body(GO:1902636) |
| 0.0 | 0.3 | GO:0008290 | F-actin capping protein complex(GO:0008290) |
| 0.0 | 4.9 | GO:0005741 | mitochondrial outer membrane(GO:0005741) |
| 0.0 | 0.3 | GO:0016272 | prefoldin complex(GO:0016272) |
| 0.0 | 1.4 | GO:0031225 | anchored component of membrane(GO:0031225) |
| 0.0 | 2.0 | GO:0005604 | basement membrane(GO:0005604) |
| 0.0 | 1.8 | GO:0030864 | cortical actin cytoskeleton(GO:0030864) |
| 0.0 | 3.7 | GO:0009897 | external side of plasma membrane(GO:0009897) |
| 0.0 | 0.1 | GO:0032280 | symmetric synapse(GO:0032280) |
| 0.0 | 0.4 | GO:0005666 | DNA-directed RNA polymerase III complex(GO:0005666) |
| 0.0 | 1.0 | GO:0005793 | endoplasmic reticulum-Golgi intermediate compartment(GO:0005793) |
| 0.0 | 0.7 | GO:0022627 | cytosolic small ribosomal subunit(GO:0022627) |
| 0.0 | 1.2 | GO:0008076 | voltage-gated potassium channel complex(GO:0008076) |
| 0.0 | 0.1 | GO:0031229 | integral component of nuclear inner membrane(GO:0005639) intrinsic component of nuclear inner membrane(GO:0031229) |
Gene overrepresentation in molecular_function category:
| Log-likelihood per target | Total log-likelihood | Term | Description |
|---|---|---|---|
| 11.7 | 58.7 | GO:0005344 | oxygen transporter activity(GO:0005344) |
| 2.6 | 7.7 | GO:0004743 | pyruvate kinase activity(GO:0004743) |
| 1.7 | 5.0 | GO:0003846 | 2-acylglycerol O-acyltransferase activity(GO:0003846) |
| 1.5 | 4.5 | GO:0004822 | isoleucine-tRNA ligase activity(GO:0004822) |
| 0.6 | 2.5 | GO:0017151 | DEAD/H-box RNA helicase binding(GO:0017151) |
| 0.6 | 5.0 | GO:0004128 | cytochrome-b5 reductase activity, acting on NAD(P)H(GO:0004128) |
| 0.5 | 1.5 | GO:1902282 | voltage-gated potassium channel activity involved in ventricular cardiac muscle cell action potential repolarization(GO:1902282) |
| 0.5 | 3.1 | GO:0001758 | retinal dehydrogenase activity(GO:0001758) 3-chloroallyl aldehyde dehydrogenase activity(GO:0004028) |
| 0.4 | 2.0 | GO:0005052 | peroxisome matrix targeting signal-1 binding(GO:0005052) |
| 0.4 | 1.1 | GO:0016493 | C-C chemokine receptor activity(GO:0016493) |
| 0.3 | 0.9 | GO:0004769 | steroid delta-isomerase activity(GO:0004769) |
| 0.3 | 5.0 | GO:0008519 | ammonium transmembrane transporter activity(GO:0008519) |
| 0.3 | 0.8 | GO:0042030 | ATPase inhibitor activity(GO:0042030) |
| 0.2 | 1.2 | GO:0004427 | inorganic diphosphatase activity(GO:0004427) |
| 0.2 | 1.7 | GO:0048101 | calcium- and calmodulin-regulated 3',5'-cyclic-GMP phosphodiesterase activity(GO:0048101) |
| 0.2 | 0.9 | GO:0070891 | lipoteichoic acid binding(GO:0070891) |
| 0.2 | 3.1 | GO:0048407 | platelet-derived growth factor binding(GO:0048407) |
| 0.2 | 0.6 | GO:0004813 | alanine-tRNA ligase activity(GO:0004813) |
| 0.2 | 0.9 | GO:0070051 | fibrinogen binding(GO:0070051) |
| 0.2 | 1.1 | GO:0019784 | NEDD8-specific protease activity(GO:0019784) |
| 0.2 | 1.5 | GO:0051011 | microtubule minus-end binding(GO:0051011) |
| 0.1 | 9.9 | GO:0005518 | collagen binding(GO:0005518) |
| 0.1 | 2.3 | GO:0004181 | metallocarboxypeptidase activity(GO:0004181) |
| 0.1 | 4.2 | GO:0050699 | WW domain binding(GO:0050699) |
| 0.1 | 0.4 | GO:0015410 | manganese-transporting ATPase activity(GO:0015410) |
| 0.1 | 1.8 | GO:0017166 | vinculin binding(GO:0017166) |
| 0.1 | 0.3 | GO:0030172 | troponin C binding(GO:0030172) |
| 0.1 | 1.0 | GO:0010521 | telomerase inhibitor activity(GO:0010521) |
| 0.1 | 0.5 | GO:0070644 | vitamin D response element binding(GO:0070644) |
| 0.1 | 0.7 | GO:0005212 | structural constituent of eye lens(GO:0005212) |
| 0.1 | 0.9 | GO:0008796 | bis(5'-nucleosyl)-tetraphosphatase activity(GO:0008796) |
| 0.1 | 0.3 | GO:0001639 | PLC activating G-protein coupled glutamate receptor activity(GO:0001639) |
| 0.1 | 0.2 | GO:0005534 | galactose binding(GO:0005534) |
| 0.1 | 1.4 | GO:0008607 | phosphorylase kinase regulator activity(GO:0008607) |
| 0.1 | 2.5 | GO:0070888 | E-box binding(GO:0070888) |
| 0.1 | 2.1 | GO:0001540 | beta-amyloid binding(GO:0001540) |
| 0.0 | 1.2 | GO:0004032 | alditol:NADP+ 1-oxidoreductase activity(GO:0004032) |
| 0.0 | 3.2 | GO:0098811 | transcriptional activator activity, RNA polymerase II transcription factor binding(GO:0001190) transcriptional repressor activity, RNA polymerase II activating transcription factor binding(GO:0098811) |
| 0.0 | 0.9 | GO:0001784 | phosphotyrosine binding(GO:0001784) |
| 0.0 | 0.7 | GO:0008253 | 5'-nucleotidase activity(GO:0008253) |
| 0.0 | 1.8 | GO:0015175 | neutral amino acid transmembrane transporter activity(GO:0015175) |
| 0.0 | 0.4 | GO:0004579 | dolichyl-diphosphooligosaccharide-protein glycotransferase activity(GO:0004579) |
| 0.0 | 0.4 | GO:0070097 | delta-catenin binding(GO:0070097) |
| 0.0 | 0.2 | GO:0051525 | NFAT protein binding(GO:0051525) |
| 0.0 | 0.2 | GO:0005087 | Ran guanyl-nucleotide exchange factor activity(GO:0005087) |
| 0.0 | 2.2 | GO:0000980 | RNA polymerase II distal enhancer sequence-specific DNA binding(GO:0000980) |
| 0.0 | 0.3 | GO:0070513 | death domain binding(GO:0070513) |
| 0.0 | 1.1 | GO:0051539 | 4 iron, 4 sulfur cluster binding(GO:0051539) |
| 0.0 | 0.7 | GO:0008235 | metalloexopeptidase activity(GO:0008235) |
| 0.0 | 0.1 | GO:0016803 | ether hydrolase activity(GO:0016803) |
| 0.0 | 0.6 | GO:0031491 | nucleosome binding(GO:0031491) |
| 0.0 | 0.1 | GO:0070087 | chromo shadow domain binding(GO:0070087) |
| 0.0 | 0.4 | GO:0001056 | RNA polymerase III activity(GO:0001056) |
| 0.0 | 0.5 | GO:0030332 | cyclin binding(GO:0030332) |
| 0.0 | 1.3 | GO:0004725 | protein tyrosine phosphatase activity(GO:0004725) |
| 0.0 | 1.0 | GO:0008022 | protein C-terminus binding(GO:0008022) |