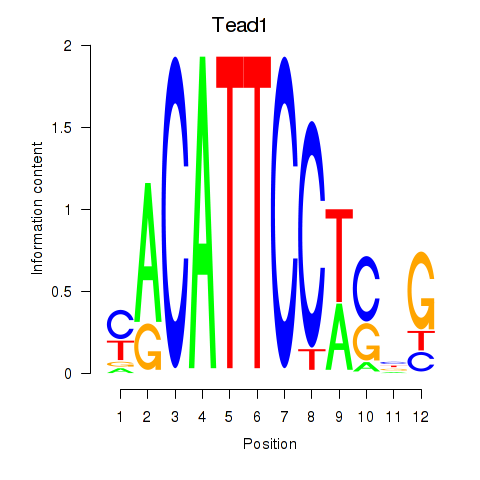
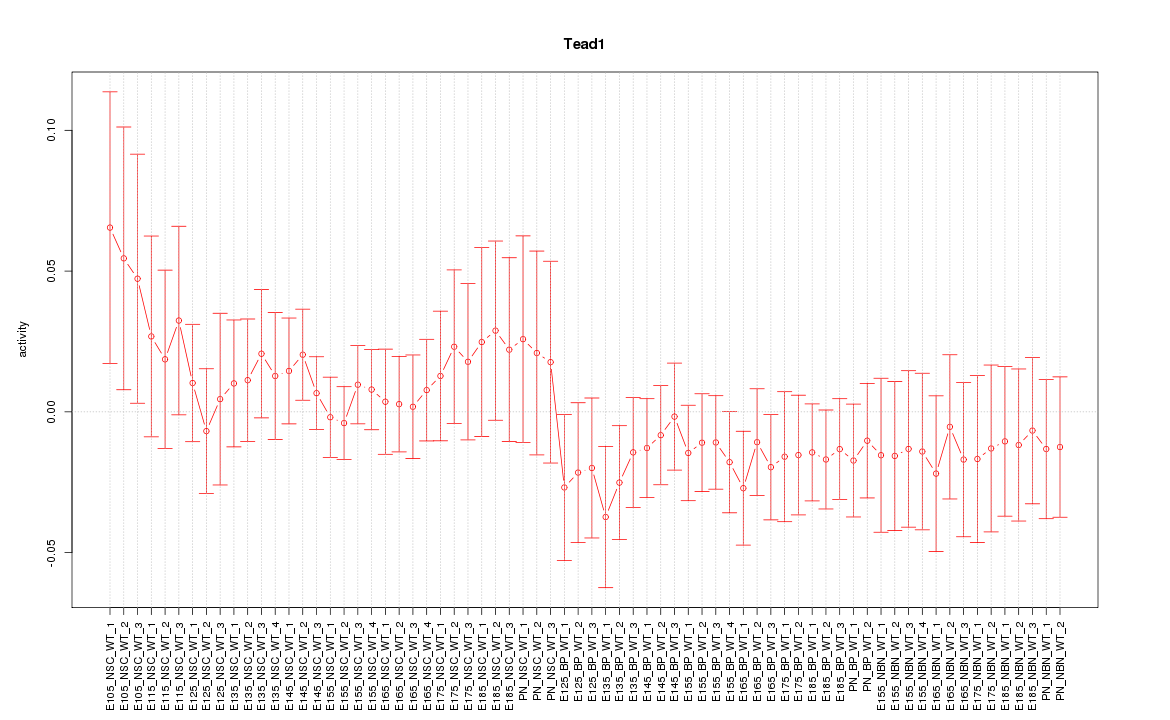
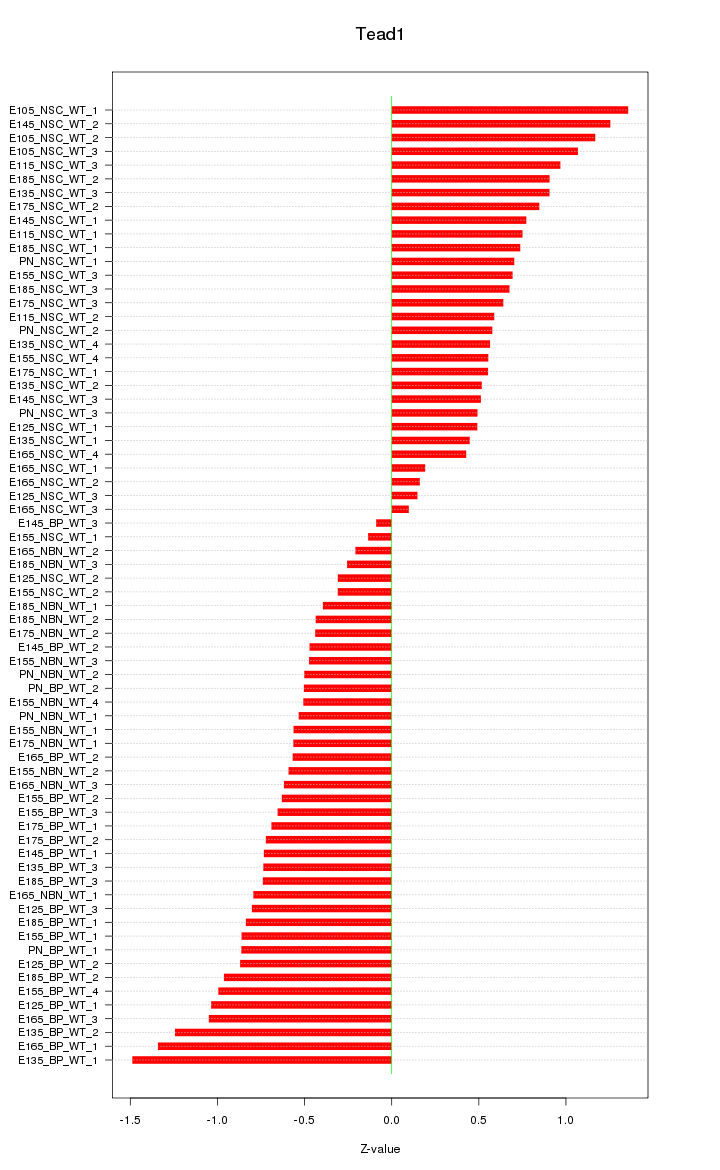
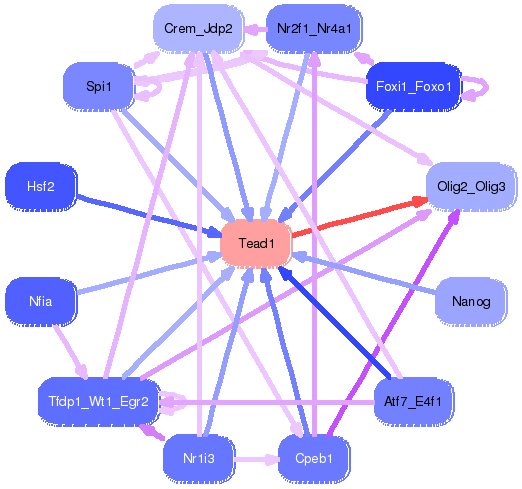
Motif ID: Tead1
Z-value: 0.730
Transcription factors associated with Tead1:
| Gene Symbol | Entrez ID | Gene Name |
|---|---|---|
| Tead1 | ENSMUSG00000055320.10 | Tead1 |
Activity-expression correlation:
| Gene Symbol | Promoter | Pearson corr. coef. | P-value | Plot |
|---|---|---|---|---|
| Tead1 | mm10_v2_chr7_+_112742025_112742060 | 0.40 | 5.2e-04 | Click! |

Top targets:
Gene overrepresentation in biological_process category:
| Log-likelihood per target | Total log-likelihood | Term | Description |
|---|---|---|---|
| 6.3 | 18.9 | GO:0021529 | spinal cord oligodendrocyte cell differentiation(GO:0021529) spinal cord oligodendrocyte cell fate specification(GO:0021530) |
| 3.9 | 15.4 | GO:0070318 | positive regulation of G0 to G1 transition(GO:0070318) |
| 2.6 | 7.9 | GO:1904395 | regulation of skeletal muscle acetylcholine-gated channel clustering(GO:1904393) positive regulation of skeletal muscle acetylcholine-gated channel clustering(GO:1904395) |
| 2.6 | 13.2 | GO:0035331 | negative regulation of hippo signaling(GO:0035331) |
| 2.1 | 14.9 | GO:0072257 | metanephric nephron tubule epithelial cell differentiation(GO:0072257) regulation of metanephric nephron tubule epithelial cell differentiation(GO:0072307) |
| 1.8 | 9.1 | GO:2000298 | regulation of Rho-dependent protein serine/threonine kinase activity(GO:2000298) |
| 1.4 | 6.8 | GO:1900085 | negative regulation of peptidyl-tyrosine autophosphorylation(GO:1900085) |
| 1.4 | 5.4 | GO:0046084 | adenine metabolic process(GO:0046083) adenine biosynthetic process(GO:0046084) |
| 1.2 | 3.7 | GO:0044339 | canonical Wnt signaling pathway involved in osteoblast differentiation(GO:0044339) |
| 1.2 | 4.9 | GO:0035426 | extracellular matrix-cell signaling(GO:0035426) |
| 1.1 | 5.3 | GO:0038018 | Wnt receptor catabolic process(GO:0038018) |
| 0.9 | 7.3 | GO:0007016 | cytoskeletal anchoring at plasma membrane(GO:0007016) |
| 0.8 | 5.6 | GO:0045654 | positive regulation of megakaryocyte differentiation(GO:0045654) |
| 0.7 | 2.8 | GO:0042360 | vitamin E metabolic process(GO:0042360) |
| 0.6 | 7.7 | GO:0031274 | positive regulation of pseudopodium assembly(GO:0031274) |
| 0.6 | 1.7 | GO:0038165 | oncostatin-M-mediated signaling pathway(GO:0038165) regulation of interleukin-6-mediated signaling pathway(GO:0070103) negative regulation of interleukin-6-mediated signaling pathway(GO:0070104) |
| 0.6 | 2.8 | GO:0002667 | lymphocyte anergy(GO:0002249) regulation of T cell anergy(GO:0002667) T cell anergy(GO:0002870) regulation of lymphocyte anergy(GO:0002911) negative regulation of protein kinase C signaling(GO:0090038) |
| 0.5 | 2.5 | GO:0051151 | negative regulation of smooth muscle cell differentiation(GO:0051151) |
| 0.5 | 4.9 | GO:1902459 | positive regulation of stem cell population maintenance(GO:1902459) |
| 0.5 | 6.3 | GO:0042219 | cellular modified amino acid catabolic process(GO:0042219) |
| 0.4 | 2.4 | GO:1904491 | protein localization to ciliary transition zone(GO:1904491) |
| 0.4 | 2.0 | GO:2001168 | regulation of histone H2B ubiquitination(GO:2001166) positive regulation of histone H2B ubiquitination(GO:2001168) |
| 0.4 | 2.0 | GO:0071947 | protein deubiquitination involved in ubiquitin-dependent protein catabolic process(GO:0071947) |
| 0.4 | 9.6 | GO:0001946 | lymphangiogenesis(GO:0001946) lymph vessel morphogenesis(GO:0036303) |
| 0.3 | 2.4 | GO:2000124 | regulation of endocannabinoid signaling pathway(GO:2000124) |
| 0.3 | 2.1 | GO:2001269 | positive regulation of cysteine-type endopeptidase activity involved in apoptotic signaling pathway(GO:2001269) |
| 0.3 | 1.5 | GO:0042997 | negative regulation of Golgi to plasma membrane protein transport(GO:0042997) |
| 0.3 | 1.4 | GO:0003406 | retinal pigment epithelium development(GO:0003406) |
| 0.3 | 11.1 | GO:0006890 | retrograde vesicle-mediated transport, Golgi to ER(GO:0006890) |
| 0.2 | 7.1 | GO:2000249 | regulation of actin cytoskeleton reorganization(GO:2000249) |
| 0.2 | 1.7 | GO:0090557 | establishment of endothelial intestinal barrier(GO:0090557) |
| 0.2 | 9.5 | GO:0042058 | regulation of epidermal growth factor receptor signaling pathway(GO:0042058) |
| 0.1 | 6.6 | GO:0032611 | interleukin-1 beta production(GO:0032611) |
| 0.1 | 0.4 | GO:0072718 | response to cisplatin(GO:0072718) |
| 0.1 | 2.4 | GO:0060707 | trophoblast giant cell differentiation(GO:0060707) |
| 0.1 | 5.9 | GO:0070527 | platelet aggregation(GO:0070527) |
| 0.1 | 0.3 | GO:0006481 | C-terminal protein methylation(GO:0006481) |
| 0.1 | 3.9 | GO:0072661 | protein targeting to plasma membrane(GO:0072661) |
| 0.1 | 2.8 | GO:0006940 | regulation of smooth muscle contraction(GO:0006940) |
| 0.1 | 7.5 | GO:0070374 | positive regulation of ERK1 and ERK2 cascade(GO:0070374) |
| 0.1 | 1.1 | GO:0070536 | protein K63-linked deubiquitination(GO:0070536) |
| 0.0 | 0.3 | GO:0006361 | transcription initiation from RNA polymerase I promoter(GO:0006361) termination of RNA polymerase I transcription(GO:0006363) |
| 0.0 | 0.5 | GO:0000290 | deadenylation-dependent decapping of nuclear-transcribed mRNA(GO:0000290) |
| 0.0 | 3.2 | GO:0051453 | regulation of intracellular pH(GO:0051453) |
| 0.0 | 0.5 | GO:0035721 | intraciliary retrograde transport(GO:0035721) |
| 0.0 | 1.9 | GO:2000134 | negative regulation of G1/S transition of mitotic cell cycle(GO:2000134) |
| 0.0 | 0.3 | GO:0035988 | chondrocyte proliferation(GO:0035988) |
| 0.0 | 4.1 | GO:0009636 | response to toxic substance(GO:0009636) |
| 0.0 | 3.5 | GO:0048706 | embryonic skeletal system development(GO:0048706) |
| 0.0 | 0.6 | GO:0051898 | negative regulation of protein kinase B signaling(GO:0051898) |
| 0.0 | 2.1 | GO:0000187 | activation of MAPK activity(GO:0000187) |
| 0.0 | 0.8 | GO:0045737 | positive regulation of cyclin-dependent protein serine/threonine kinase activity(GO:0045737) |
| 0.0 | 0.2 | GO:0070935 | 3'-UTR-mediated mRNA stabilization(GO:0070935) |
| 0.0 | 1.1 | GO:0006888 | ER to Golgi vesicle-mediated transport(GO:0006888) endoplasmic reticulum unfolded protein response(GO:0030968) |
| 0.0 | 0.1 | GO:1901184 | regulation of ERBB signaling pathway(GO:1901184) |
| 0.0 | 0.4 | GO:0045104 | intermediate filament cytoskeleton organization(GO:0045104) |
| 0.0 | 1.3 | GO:0050821 | protein stabilization(GO:0050821) |
Gene overrepresentation in cellular_component category:
| Log-likelihood per target | Total log-likelihood | Term | Description |
|---|---|---|---|
| 2.3 | 9.1 | GO:0070022 | transforming growth factor beta receptor homodimeric complex(GO:0070022) |
| 0.7 | 9.8 | GO:0016460 | myosin II complex(GO:0016460) |
| 0.6 | 1.7 | GO:0005896 | interleukin-6 receptor complex(GO:0005896) |
| 0.5 | 4.1 | GO:0033269 | internode region of axon(GO:0033269) |
| 0.5 | 7.9 | GO:0016600 | flotillin complex(GO:0016600) |
| 0.4 | 6.8 | GO:0002080 | acrosomal membrane(GO:0002080) |
| 0.3 | 15.4 | GO:0005801 | cis-Golgi network(GO:0005801) |
| 0.3 | 2.8 | GO:0030478 | actin cap(GO:0030478) |
| 0.2 | 2.0 | GO:0008024 | cyclin/CDK positive transcription elongation factor complex(GO:0008024) |
| 0.2 | 1.7 | GO:0046581 | intercellular canaliculus(GO:0046581) |
| 0.2 | 10.6 | GO:0005871 | kinesin complex(GO:0005871) |
| 0.2 | 0.8 | GO:0000308 | cytoplasmic cyclin-dependent protein kinase holoenzyme complex(GO:0000308) |
| 0.1 | 48.6 | GO:0005667 | transcription factor complex(GO:0005667) |
| 0.1 | 0.6 | GO:0030991 | intraciliary transport particle A(GO:0030991) |
| 0.1 | 2.4 | GO:0035869 | ciliary transition zone(GO:0035869) |
| 0.1 | 0.4 | GO:0097197 | tetraspanin-enriched microdomain(GO:0097197) |
| 0.0 | 4.9 | GO:0005604 | basement membrane(GO:0005604) |
| 0.0 | 8.4 | GO:0001726 | ruffle(GO:0001726) |
| 0.0 | 0.5 | GO:0030126 | COPI vesicle coat(GO:0030126) |
| 0.0 | 5.6 | GO:0000793 | condensed chromosome(GO:0000793) |
| 0.0 | 0.5 | GO:0016442 | RISC complex(GO:0016442) RNAi effector complex(GO:0031332) |
| 0.0 | 1.7 | GO:0005882 | intermediate filament(GO:0005882) |
| 0.0 | 2.1 | GO:0017053 | transcriptional repressor complex(GO:0017053) |
| 0.0 | 0.1 | GO:0000938 | GARP complex(GO:0000938) |
| 0.0 | 1.2 | GO:0016328 | lateral plasma membrane(GO:0016328) |
| 0.0 | 0.3 | GO:0016010 | dystrophin-associated glycoprotein complex(GO:0016010) glycoprotein complex(GO:0090665) |
| 0.0 | 0.2 | GO:0010369 | chromocenter(GO:0010369) |
| 0.0 | 6.7 | GO:0005925 | focal adhesion(GO:0005925) |
| 0.0 | 6.9 | GO:0005789 | endoplasmic reticulum membrane(GO:0005789) |
| 0.0 | 2.3 | GO:0098852 | lysosomal membrane(GO:0005765) lytic vacuole membrane(GO:0098852) |
| 0.0 | 2.4 | GO:0019898 | extrinsic component of membrane(GO:0019898) |
Gene overrepresentation in molecular_function category:
| Log-likelihood per target | Total log-likelihood | Term | Description |
|---|---|---|---|
| 2.1 | 6.3 | GO:0003839 | gamma-glutamylcyclotransferase activity(GO:0003839) |
| 1.4 | 6.8 | GO:0070320 | inward rectifier potassium channel inhibitor activity(GO:0070320) |
| 1.0 | 4.1 | GO:0019911 | structural constituent of myelin sheath(GO:0019911) |
| 1.0 | 9.1 | GO:0035615 | clathrin adaptor activity(GO:0035615) endocytic adaptor activity(GO:0098748) |
| 0.9 | 5.6 | GO:0050786 | RAGE receptor binding(GO:0050786) |
| 0.8 | 10.1 | GO:0045294 | alpha-catenin binding(GO:0045294) |
| 0.7 | 7.3 | GO:0030274 | LIM domain binding(GO:0030274) |
| 0.7 | 15.4 | GO:0005520 | insulin-like growth factor binding(GO:0005520) |
| 0.7 | 4.9 | GO:0043237 | laminin-1 binding(GO:0043237) |
| 0.7 | 0.7 | GO:0031762 | alpha-1A adrenergic receptor binding(GO:0031691) alpha-1B adrenergic receptor binding(GO:0031692) follicle-stimulating hormone receptor binding(GO:0031762) |
| 0.6 | 5.9 | GO:0032036 | myosin heavy chain binding(GO:0032036) |
| 0.6 | 1.7 | GO:0004923 | leukemia inhibitory factor receptor activity(GO:0004923) oncostatin-M receptor activity(GO:0004924) |
| 0.4 | 2.0 | GO:1990380 | Lys48-specific deubiquitinase activity(GO:1990380) |
| 0.4 | 2.3 | GO:0015379 | potassium:chloride symporter activity(GO:0015379) potassium ion symporter activity(GO:0022820) |
| 0.4 | 8.3 | GO:0070064 | proline-rich region binding(GO:0070064) |
| 0.3 | 7.7 | GO:0017049 | GTP-Rho binding(GO:0017049) |
| 0.3 | 11.6 | GO:0070888 | E-box binding(GO:0070888) |
| 0.3 | 17.5 | GO:0030971 | receptor tyrosine kinase binding(GO:0030971) |
| 0.3 | 9.5 | GO:0071837 | HMG box domain binding(GO:0071837) |
| 0.3 | 2.0 | GO:0097322 | 7SK snRNA binding(GO:0097322) |
| 0.3 | 0.8 | GO:0019966 | interleukin-1 binding(GO:0019966) |
| 0.2 | 1.9 | GO:0008420 | CTD phosphatase activity(GO:0008420) |
| 0.2 | 2.4 | GO:0047372 | acylglycerol lipase activity(GO:0047372) |
| 0.2 | 7.5 | GO:0017112 | Rab guanyl-nucleotide exchange factor activity(GO:0017112) |
| 0.2 | 10.6 | GO:0003777 | microtubule motor activity(GO:0003777) |
| 0.2 | 3.2 | GO:0005452 | inorganic anion exchanger activity(GO:0005452) |
| 0.1 | 1.5 | GO:0008474 | palmitoyl-(protein) hydrolase activity(GO:0008474) palmitoyl hydrolase activity(GO:0098599) |
| 0.1 | 2.5 | GO:1990841 | promoter-specific chromatin binding(GO:1990841) |
| 0.1 | 5.1 | GO:0043027 | cysteine-type endopeptidase inhibitor activity involved in apoptotic process(GO:0043027) |
| 0.1 | 1.1 | GO:0070097 | delta-catenin binding(GO:0070097) |
| 0.1 | 5.4 | GO:0016831 | carboxy-lyase activity(GO:0016831) |
| 0.1 | 8.4 | GO:0004252 | serine-type endopeptidase activity(GO:0004252) |
| 0.1 | 4.2 | GO:0005109 | frizzled binding(GO:0005109) |
| 0.1 | 1.1 | GO:0035497 | cAMP response element binding(GO:0035497) |
| 0.1 | 0.3 | GO:0042134 | rRNA primary transcript binding(GO:0042134) |
| 0.1 | 1.4 | GO:0003708 | retinoic acid receptor activity(GO:0003708) |
| 0.1 | 5.9 | GO:0032947 | protein complex scaffold(GO:0032947) |
| 0.1 | 0.3 | GO:1990254 | keratin filament binding(GO:1990254) |
| 0.1 | 3.9 | GO:0035254 | glutamate receptor binding(GO:0035254) |
| 0.1 | 0.3 | GO:0008140 | cAMP response element binding protein binding(GO:0008140) |
| 0.1 | 2.8 | GO:0004722 | protein serine/threonine phosphatase activity(GO:0004722) |
| 0.0 | 0.6 | GO:0010314 | phosphatidylinositol-5-phosphate binding(GO:0010314) |
| 0.0 | 0.5 | GO:0050072 | m7G(5')pppN diphosphatase activity(GO:0050072) |
| 0.0 | 1.1 | GO:0001786 | phosphatidylserine binding(GO:0001786) |
| 0.0 | 4.9 | GO:0001085 | RNA polymerase II transcription factor binding(GO:0001085) |
| 0.0 | 0.4 | GO:0005375 | copper ion transmembrane transporter activity(GO:0005375) |
| 0.0 | 0.8 | GO:0016538 | cyclin-dependent protein serine/threonine kinase regulator activity(GO:0016538) |
| 0.0 | 0.2 | GO:0035925 | mRNA 3'-UTR AU-rich region binding(GO:0035925) |
| 0.0 | 1.1 | GO:0004843 | thiol-dependent ubiquitin-specific protease activity(GO:0004843) |