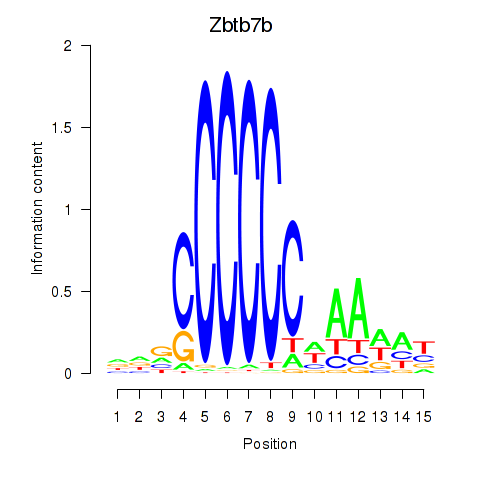
Motif ID: Zbtb7b
Z-value: 0.919
Transcription factors associated with Zbtb7b:
| Gene Symbol | Entrez ID | Gene Name |
|---|---|---|
| Zbtb7b | ENSMUSG00000028042.9 | Zbtb7b |
Activity-expression correlation:
| Gene Symbol | Promoter | Pearson corr. coef. | P-value | Plot |
|---|---|---|---|---|
| Zbtb7b | mm10_v2_chr3_-_89393294_89393378 | 0.52 | 3.4e-06 | Click! |

Top targets:
Gene overrepresentation in biological_process category:
| Log-likelihood per target | Total log-likelihood | Term | Description |
|---|---|---|---|
| 3.3 | 9.8 | GO:0097402 | neuroblast migration(GO:0097402) |
| 3.0 | 11.9 | GO:2000054 | negative regulation of Wnt signaling pathway involved in dorsal/ventral axis specification(GO:2000054) |
| 2.7 | 13.5 | GO:0021914 | negative regulation of smoothened signaling pathway involved in ventral spinal cord patterning(GO:0021914) |
| 2.5 | 9.9 | GO:0060032 | notochord regression(GO:0060032) |
| 2.1 | 8.4 | GO:2000525 | regulation of T cell costimulation(GO:2000523) positive regulation of T cell costimulation(GO:2000525) |
| 1.5 | 4.5 | GO:0048818 | embryonic nail plate morphogenesis(GO:0035880) positive regulation of hair follicle maturation(GO:0048818) positive regulation of catagen(GO:0051795) frontal suture morphogenesis(GO:0060364) |
| 1.5 | 10.2 | GO:0071699 | olfactory placode formation(GO:0030910) olfactory placode development(GO:0071698) olfactory placode morphogenesis(GO:0071699) |
| 1.5 | 19.0 | GO:0032252 | secretory granule localization(GO:0032252) |
| 1.5 | 5.8 | GO:1990086 | lens fiber cell apoptotic process(GO:1990086) |
| 1.1 | 4.2 | GO:0046874 | quinolinate metabolic process(GO:0046874) |
| 1.0 | 3.1 | GO:0061537 | glycine secretion(GO:0061536) glycine secretion, neurotransmission(GO:0061537) |
| 1.0 | 10.2 | GO:0030388 | fructose 1,6-bisphosphate metabolic process(GO:0030388) |
| 1.0 | 8.6 | GO:0060770 | negative regulation of epithelial cell proliferation involved in prostate gland development(GO:0060770) |
| 0.9 | 2.7 | GO:0048352 | neural plate mediolateral regionalization(GO:0021998) mesoderm structural organization(GO:0048338) paraxial mesoderm structural organization(GO:0048352) |
| 0.9 | 2.7 | GO:0019676 | ammonia assimilation cycle(GO:0019676) |
| 0.9 | 2.6 | GO:1903795 | regulation of inorganic anion transmembrane transport(GO:1903795) |
| 0.8 | 5.9 | GO:0043569 | negative regulation of insulin-like growth factor receptor signaling pathway(GO:0043569) |
| 0.8 | 2.3 | GO:1902071 | regulation of hypoxia-inducible factor-1alpha signaling pathway(GO:1902071) |
| 0.7 | 4.7 | GO:0072539 | T-helper 17 cell differentiation(GO:0072539) |
| 0.6 | 4.2 | GO:2001185 | regulation of CD8-positive, alpha-beta T cell activation(GO:2001185) |
| 0.6 | 4.1 | GO:0006363 | termination of RNA polymerase I transcription(GO:0006363) |
| 0.6 | 6.4 | GO:1902459 | positive regulation of stem cell population maintenance(GO:1902459) |
| 0.6 | 4.5 | GO:0015074 | DNA integration(GO:0015074) |
| 0.6 | 2.8 | GO:0044340 | neural plate elongation(GO:0014022) convergent extension involved in neural plate elongation(GO:0022007) canonical Wnt signaling pathway involved in regulation of cell proliferation(GO:0044340) |
| 0.5 | 1.6 | GO:0033566 | gamma-tubulin complex localization(GO:0033566) |
| 0.5 | 3.8 | GO:0035726 | common myeloid progenitor cell proliferation(GO:0035726) |
| 0.5 | 1.6 | GO:0070476 | rRNA (guanine-N7)-methylation(GO:0070476) |
| 0.5 | 10.2 | GO:0035873 | lactate transport(GO:0015727) lactate transmembrane transport(GO:0035873) plasma membrane lactate transport(GO:0035879) |
| 0.5 | 2.5 | GO:0050862 | positive regulation of T cell receptor signaling pathway(GO:0050862) |
| 0.5 | 6.4 | GO:0042711 | maternal behavior(GO:0042711) |
| 0.5 | 2.3 | GO:0006564 | L-serine biosynthetic process(GO:0006564) |
| 0.5 | 8.1 | GO:0000920 | cell separation after cytokinesis(GO:0000920) |
| 0.4 | 2.2 | GO:0014886 | transition between slow and fast fiber(GO:0014886) |
| 0.4 | 2.9 | GO:0070458 | detoxification of nitrogen compound(GO:0051410) cellular detoxification of nitrogen compound(GO:0070458) |
| 0.4 | 2.5 | GO:0070475 | rRNA base methylation(GO:0070475) |
| 0.4 | 1.2 | GO:0015772 | disaccharide transport(GO:0015766) sucrose transport(GO:0015770) oligosaccharide transport(GO:0015772) |
| 0.4 | 2.2 | GO:0001980 | regulation of systemic arterial blood pressure by ischemic conditions(GO:0001980) |
| 0.4 | 3.7 | GO:0070574 | cadmium ion transport(GO:0015691) cadmium ion transmembrane transport(GO:0070574) |
| 0.3 | 3.1 | GO:0036123 | histone H3-K9 dimethylation(GO:0036123) |
| 0.3 | 2.2 | GO:0038028 | insulin receptor signaling pathway via phosphatidylinositol 3-kinase(GO:0038028) |
| 0.3 | 1.7 | GO:0089711 | L-glutamate transmembrane transport(GO:0089711) |
| 0.3 | 0.8 | GO:0038165 | oncostatin-M-mediated signaling pathway(GO:0038165) regulation of interleukin-6-mediated signaling pathway(GO:0070103) negative regulation of interleukin-6-mediated signaling pathway(GO:0070104) |
| 0.3 | 5.1 | GO:0009954 | proximal/distal pattern formation(GO:0009954) |
| 0.3 | 3.5 | GO:0051451 | myoblast migration(GO:0051451) |
| 0.2 | 2.6 | GO:0060340 | positive regulation of type I interferon-mediated signaling pathway(GO:0060340) |
| 0.2 | 1.1 | GO:0006348 | chromatin silencing at telomere(GO:0006348) |
| 0.2 | 1.3 | GO:0071455 | cellular response to increased oxygen levels(GO:0036295) cellular response to hyperoxia(GO:0071455) |
| 0.2 | 4.9 | GO:0042474 | middle ear morphogenesis(GO:0042474) |
| 0.2 | 3.9 | GO:0000188 | inactivation of MAPK activity(GO:0000188) |
| 0.2 | 2.0 | GO:0045040 | protein import into mitochondrial outer membrane(GO:0045040) negative regulation of protein folding(GO:1903333) |
| 0.2 | 1.0 | GO:0032237 | activation of store-operated calcium channel activity(GO:0032237) enamel mineralization(GO:0070166) |
| 0.2 | 0.9 | GO:0075525 | viral translational termination-reinitiation(GO:0075525) |
| 0.2 | 0.7 | GO:1903347 | negative regulation of bicellular tight junction assembly(GO:1903347) |
| 0.2 | 4.9 | GO:0032467 | positive regulation of cytokinesis(GO:0032467) |
| 0.2 | 5.3 | GO:1901522 | positive regulation of transcription from RNA polymerase II promoter involved in cellular response to chemical stimulus(GO:1901522) |
| 0.2 | 1.1 | GO:0090086 | negative regulation of protein deubiquitination(GO:0090086) |
| 0.2 | 3.0 | GO:0031065 | positive regulation of histone deacetylation(GO:0031065) |
| 0.2 | 4.4 | GO:0009299 | mRNA transcription(GO:0009299) |
| 0.2 | 11.6 | GO:0046785 | microtubule polymerization(GO:0046785) |
| 0.1 | 3.1 | GO:0051894 | positive regulation of focal adhesion assembly(GO:0051894) |
| 0.1 | 2.1 | GO:0060391 | positive regulation of SMAD protein import into nucleus(GO:0060391) |
| 0.1 | 1.5 | GO:0071357 | type I interferon signaling pathway(GO:0060337) cellular response to type I interferon(GO:0071357) |
| 0.1 | 0.3 | GO:0009298 | GDP-mannose biosynthetic process(GO:0009298) |
| 0.1 | 4.0 | GO:0000038 | very long-chain fatty acid metabolic process(GO:0000038) |
| 0.1 | 1.8 | GO:0016339 | calcium-dependent cell-cell adhesion via plasma membrane cell adhesion molecules(GO:0016339) |
| 0.1 | 4.9 | GO:0007628 | adult walking behavior(GO:0007628) walking behavior(GO:0090659) |
| 0.1 | 4.8 | GO:0005978 | glycogen biosynthetic process(GO:0005978) glucan biosynthetic process(GO:0009250) |
| 0.1 | 1.1 | GO:0048672 | positive regulation of collateral sprouting(GO:0048672) |
| 0.1 | 0.2 | GO:0042663 | regulation of endodermal cell fate specification(GO:0042663) |
| 0.1 | 0.6 | GO:0000467 | exonucleolytic trimming involved in rRNA processing(GO:0000459) exonucleolytic trimming to generate mature 3'-end of 5.8S rRNA from tricistronic rRNA transcript (SSU-rRNA, 5.8S rRNA, LSU-rRNA)(GO:0000467) |
| 0.1 | 3.7 | GO:0035058 | nonmotile primary cilium assembly(GO:0035058) |
| 0.1 | 4.9 | GO:0008543 | fibroblast growth factor receptor signaling pathway(GO:0008543) |
| 0.1 | 5.3 | GO:0001885 | endothelial cell development(GO:0001885) |
| 0.1 | 1.3 | GO:0050650 | chondroitin sulfate proteoglycan biosynthetic process(GO:0050650) |
| 0.1 | 0.3 | GO:0097494 | regulation of vesicle size(GO:0097494) |
| 0.1 | 0.2 | GO:0035507 | regulation of myosin-light-chain-phosphatase activity(GO:0035507) |
| 0.1 | 0.4 | GO:0043137 | DNA replication, removal of RNA primer(GO:0043137) |
| 0.1 | 2.5 | GO:0051973 | positive regulation of telomerase activity(GO:0051973) |
| 0.1 | 12.3 | GO:0008360 | regulation of cell shape(GO:0008360) |
| 0.1 | 2.8 | GO:0045670 | regulation of osteoclast differentiation(GO:0045670) |
| 0.1 | 0.5 | GO:0060501 | positive regulation of epithelial cell proliferation involved in lung morphogenesis(GO:0060501) |
| 0.0 | 1.0 | GO:1902043 | positive regulation of extrinsic apoptotic signaling pathway via death domain receptors(GO:1902043) |
| 0.0 | 0.8 | GO:0060219 | camera-type eye photoreceptor cell differentiation(GO:0060219) |
| 0.0 | 0.9 | GO:0006474 | N-terminal protein amino acid acetylation(GO:0006474) |
| 0.0 | 1.1 | GO:0042775 | tricarboxylic acid cycle(GO:0006099) mitochondrial ATP synthesis coupled electron transport(GO:0042775) |
| 0.0 | 0.7 | GO:0070208 | protein heterotrimerization(GO:0070208) |
| 0.0 | 5.5 | GO:0007219 | Notch signaling pathway(GO:0007219) |
| 0.0 | 1.8 | GO:0002209 | behavioral fear response(GO:0001662) behavioral defense response(GO:0002209) |
| 0.0 | 0.5 | GO:0000028 | ribosomal small subunit assembly(GO:0000028) |
| 0.0 | 2.1 | GO:0051592 | response to calcium ion(GO:0051592) |
| 0.0 | 0.2 | GO:0036506 | maintenance of unfolded protein(GO:0036506) protein insertion into ER membrane(GO:0045048) tail-anchored membrane protein insertion into ER membrane(GO:0071816) maintenance of unfolded protein involved in ERAD pathway(GO:1904378) |
| 0.0 | 0.3 | GO:0006527 | arginine catabolic process(GO:0006527) |
| 0.0 | 1.3 | GO:0061077 | chaperone-mediated protein folding(GO:0061077) |
| 0.0 | 0.9 | GO:1901998 | toxin transport(GO:1901998) |
| 0.0 | 0.5 | GO:0030317 | sperm motility(GO:0030317) |
| 0.0 | 0.1 | GO:0071044 | histone mRNA catabolic process(GO:0071044) |
| 0.0 | 0.1 | GO:0007113 | endomitotic cell cycle(GO:0007113) |
| 0.0 | 1.1 | GO:0000725 | double-strand break repair via homologous recombination(GO:0000724) recombinational repair(GO:0000725) |
| 0.0 | 1.3 | GO:0051028 | mRNA transport(GO:0051028) |
| 0.0 | 0.1 | GO:0034720 | histone H3-K4 demethylation(GO:0034720) |
Gene overrepresentation in cellular_component category:
| Log-likelihood per target | Total log-likelihood | Term | Description |
|---|---|---|---|
| 1.2 | 5.8 | GO:0035189 | Rb-E2F complex(GO:0035189) |
| 0.9 | 7.8 | GO:0042587 | glycogen granule(GO:0042587) |
| 0.8 | 9.9 | GO:0097542 | ciliary tip(GO:0097542) |
| 0.7 | 6.6 | GO:0070369 | beta-catenin-TCF7L2 complex(GO:0070369) |
| 0.7 | 4.4 | GO:0005853 | eukaryotic translation elongation factor 1 complex(GO:0005853) |
| 0.7 | 10.2 | GO:0035686 | sperm fibrous sheath(GO:0035686) |
| 0.6 | 8.6 | GO:0043203 | axon hillock(GO:0043203) |
| 0.5 | 11.9 | GO:0030877 | beta-catenin destruction complex(GO:0030877) |
| 0.5 | 3.5 | GO:0036195 | muscle cell projection(GO:0036194) muscle cell projection membrane(GO:0036195) |
| 0.4 | 2.2 | GO:0005861 | troponin complex(GO:0005861) |
| 0.4 | 6.3 | GO:0030061 | mitochondrial crista(GO:0030061) |
| 0.3 | 0.8 | GO:0005896 | interleukin-6 receptor complex(GO:0005896) |
| 0.3 | 2.7 | GO:0097386 | glial cell projection(GO:0097386) |
| 0.3 | 2.7 | GO:0031594 | neuromuscular junction(GO:0031594) |
| 0.3 | 4.1 | GO:0005736 | DNA-directed RNA polymerase I complex(GO:0005736) |
| 0.2 | 1.1 | GO:0019907 | cyclin-dependent protein kinase activating kinase holoenzyme complex(GO:0019907) |
| 0.2 | 1.8 | GO:0016281 | eukaryotic translation initiation factor 4F complex(GO:0016281) |
| 0.2 | 1.0 | GO:0032541 | cortical endoplasmic reticulum(GO:0032541) |
| 0.2 | 2.3 | GO:0031462 | Cul2-RING ubiquitin ligase complex(GO:0031462) |
| 0.2 | 0.5 | GO:1990879 | CST complex(GO:1990879) |
| 0.2 | 4.9 | GO:0051233 | spindle midzone(GO:0051233) |
| 0.2 | 8.9 | GO:0005871 | kinesin complex(GO:0005871) |
| 0.1 | 0.7 | GO:1990462 | omegasome(GO:1990462) |
| 0.1 | 3.4 | GO:0034451 | centriolar satellite(GO:0034451) |
| 0.1 | 0.7 | GO:0044613 | nuclear pore central transport channel(GO:0044613) Flemming body(GO:0090543) |
| 0.1 | 0.9 | GO:0071541 | eukaryotic translation initiation factor 3 complex, eIF3m(GO:0071541) |
| 0.1 | 1.1 | GO:0048188 | MLL3/4 complex(GO:0044666) Set1C/COMPASS complex(GO:0048188) |
| 0.1 | 0.6 | GO:0034464 | BBSome(GO:0034464) |
| 0.1 | 10.2 | GO:0044798 | nuclear transcription factor complex(GO:0044798) |
| 0.1 | 0.4 | GO:0032299 | ribonuclease H2 complex(GO:0032299) |
| 0.1 | 17.5 | GO:0005667 | transcription factor complex(GO:0005667) |
| 0.1 | 0.5 | GO:0045095 | keratin filament(GO:0045095) |
| 0.1 | 2.2 | GO:0000315 | organellar large ribosomal subunit(GO:0000315) mitochondrial large ribosomal subunit(GO:0005762) |
| 0.1 | 0.2 | GO:0072357 | PTW/PP1 phosphatase complex(GO:0072357) |
| 0.1 | 3.1 | GO:0005720 | nuclear heterochromatin(GO:0005720) |
| 0.1 | 1.7 | GO:0030673 | axolemma(GO:0030673) |
| 0.0 | 1.0 | GO:0005839 | proteasome core complex(GO:0005839) |
| 0.0 | 5.3 | GO:0005901 | caveola(GO:0005901) |
| 0.0 | 2.8 | GO:0016328 | lateral plasma membrane(GO:0016328) |
| 0.0 | 3.1 | GO:0005581 | collagen trimer(GO:0005581) |
| 0.0 | 0.4 | GO:0001891 | phagocytic cup(GO:0001891) |
| 0.0 | 0.2 | GO:0071818 | BAT3 complex(GO:0071818) ER membrane insertion complex(GO:0072379) |
| 0.0 | 1.1 | GO:1990391 | DNA repair complex(GO:1990391) |
| 0.0 | 0.5 | GO:0030992 | intraciliary transport particle B(GO:0030992) |
| 0.0 | 1.5 | GO:0016234 | inclusion body(GO:0016234) |
| 0.0 | 2.7 | GO:0005777 | peroxisome(GO:0005777) microbody(GO:0042579) |
| 0.0 | 2.3 | GO:0071013 | catalytic step 2 spliceosome(GO:0071013) |
| 0.0 | 1.3 | GO:0005776 | autophagosome(GO:0005776) |
| 0.0 | 0.2 | GO:0008074 | guanylate cyclase complex, soluble(GO:0008074) |
| 0.0 | 0.3 | GO:0008385 | IkappaB kinase complex(GO:0008385) |
| 0.0 | 3.8 | GO:0030027 | lamellipodium(GO:0030027) |
| 0.0 | 1.0 | GO:0000932 | cytoplasmic mRNA processing body(GO:0000932) |
| 0.0 | 1.1 | GO:0098803 | respiratory chain complex(GO:0098803) |
| 0.0 | 1.9 | GO:0005923 | bicellular tight junction(GO:0005923) |
| 0.0 | 2.7 | GO:0005770 | late endosome(GO:0005770) |
| 0.0 | 0.5 | GO:0000314 | organellar small ribosomal subunit(GO:0000314) mitochondrial small ribosomal subunit(GO:0005763) |
| 0.0 | 0.7 | GO:0005882 | intermediate filament(GO:0005882) |
| 0.0 | 2.5 | GO:0016324 | apical plasma membrane(GO:0016324) |
Gene overrepresentation in molecular_function category:
| Log-likelihood per target | Total log-likelihood | Term | Description |
|---|---|---|---|
| 1.7 | 10.2 | GO:0004332 | fructose-bisphosphate aldolase activity(GO:0004332) |
| 1.6 | 4.9 | GO:0005105 | type 1 fibroblast growth factor receptor binding(GO:0005105) |
| 1.2 | 4.7 | GO:0008142 | oxysterol binding(GO:0008142) |
| 1.1 | 12.4 | GO:0019992 | diacylglycerol binding(GO:0019992) |
| 0.9 | 2.7 | GO:0016880 | acid-ammonia (or amide) ligase activity(GO:0016880) |
| 0.8 | 2.3 | GO:0004647 | phosphoserine phosphatase activity(GO:0004647) |
| 0.7 | 2.2 | GO:0030172 | troponin C binding(GO:0030172) |
| 0.7 | 2.0 | GO:0010698 | acetyltransferase activator activity(GO:0010698) |
| 0.6 | 10.2 | GO:0015129 | lactate transmembrane transporter activity(GO:0015129) |
| 0.6 | 2.5 | GO:0016286 | small conductance calcium-activated potassium channel activity(GO:0016286) |
| 0.6 | 11.9 | GO:0070411 | I-SMAD binding(GO:0070411) |
| 0.6 | 5.9 | GO:0004445 | inositol-polyphosphate 5-phosphatase activity(GO:0004445) |
| 0.5 | 9.8 | GO:0001222 | transcription corepressor binding(GO:0001222) |
| 0.5 | 10.2 | GO:0035198 | miRNA binding(GO:0035198) |
| 0.5 | 5.3 | GO:0004886 | 9-cis retinoic acid receptor activity(GO:0004886) |
| 0.5 | 3.1 | GO:0015375 | glycine:sodium symporter activity(GO:0015375) |
| 0.5 | 2.7 | GO:0098821 | BMP receptor activity(GO:0098821) |
| 0.4 | 8.4 | GO:0005003 | ephrin receptor activity(GO:0005003) |
| 0.4 | 1.7 | GO:0015501 | glutamate:sodium symporter activity(GO:0015501) |
| 0.4 | 1.2 | GO:0008515 | sucrose:proton symporter activity(GO:0008506) sucrose transmembrane transporter activity(GO:0008515) disaccharide transmembrane transporter activity(GO:0015154) oligosaccharide transmembrane transporter activity(GO:0015157) |
| 0.4 | 3.1 | GO:0046974 | histone methyltransferase activity (H3-K9 specific)(GO:0046974) |
| 0.4 | 4.0 | GO:0031957 | very long-chain fatty acid-CoA ligase activity(GO:0031957) |
| 0.3 | 1.1 | GO:0000104 | succinate dehydrogenase activity(GO:0000104) |
| 0.3 | 4.1 | GO:0001054 | RNA polymerase I activity(GO:0001054) |
| 0.3 | 0.8 | GO:0004923 | leukemia inhibitory factor receptor activity(GO:0004923) oncostatin-M receptor activity(GO:0004924) |
| 0.3 | 6.6 | GO:0045295 | gamma-catenin binding(GO:0045295) |
| 0.3 | 6.3 | GO:0016676 | cytochrome-c oxidase activity(GO:0004129) heme-copper terminal oxidase activity(GO:0015002) oxidoreductase activity, acting on a heme group of donors, oxygen as acceptor(GO:0016676) |
| 0.2 | 0.7 | GO:0051425 | PTB domain binding(GO:0051425) |
| 0.2 | 2.3 | GO:0019871 | sodium channel inhibitor activity(GO:0019871) |
| 0.2 | 1.3 | GO:0001223 | transcription coactivator binding(GO:0001223) |
| 0.2 | 8.6 | GO:0004867 | serine-type endopeptidase inhibitor activity(GO:0004867) |
| 0.2 | 1.1 | GO:0070915 | lysophosphatidic acid receptor activity(GO:0070915) |
| 0.2 | 1.6 | GO:0008329 | signaling pattern recognition receptor activity(GO:0008329) pattern recognition receptor activity(GO:0038187) |
| 0.2 | 1.8 | GO:0008190 | eukaryotic initiation factor 4E binding(GO:0008190) |
| 0.2 | 4.9 | GO:0071837 | HMG box domain binding(GO:0071837) |
| 0.2 | 4.4 | GO:0003746 | translation elongation factor activity(GO:0003746) |
| 0.1 | 3.7 | GO:0005385 | zinc ion transmembrane transporter activity(GO:0005385) |
| 0.1 | 8.9 | GO:0003777 | microtubule motor activity(GO:0003777) |
| 0.1 | 35.2 | GO:0001077 | transcriptional activator activity, RNA polymerase II core promoter proximal region sequence-specific binding(GO:0001077) |
| 0.1 | 2.1 | GO:0008143 | poly(A) binding(GO:0008143) |
| 0.1 | 2.9 | GO:1900750 | glutathione binding(GO:0043295) oligopeptide binding(GO:1900750) |
| 0.1 | 1.0 | GO:0051010 | microtubule plus-end binding(GO:0051010) |
| 0.1 | 2.2 | GO:0043539 | protein serine/threonine kinase activator activity(GO:0043539) |
| 0.1 | 0.3 | GO:0008384 | IkappaB kinase activity(GO:0008384) |
| 0.1 | 8.7 | GO:0001085 | RNA polymerase II transcription factor binding(GO:0001085) |
| 0.1 | 5.7 | GO:0019888 | protein phosphatase regulator activity(GO:0019888) |
| 0.1 | 2.6 | GO:0017080 | sodium channel regulator activity(GO:0017080) |
| 0.1 | 2.8 | GO:0005109 | frizzled binding(GO:0005109) |
| 0.1 | 0.4 | GO:0000774 | adenyl-nucleotide exchange factor activity(GO:0000774) |
| 0.1 | 7.4 | GO:0000982 | transcription factor activity, RNA polymerase II core promoter proximal region sequence-specific binding(GO:0000982) |
| 0.1 | 1.1 | GO:0042800 | histone methyltransferase activity (H3-K4 specific)(GO:0042800) |
| 0.1 | 1.1 | GO:0070628 | proteasome binding(GO:0070628) |
| 0.1 | 2.7 | GO:0016763 | transferase activity, transferring pentosyl groups(GO:0016763) |
| 0.1 | 0.4 | GO:0004523 | RNA-DNA hybrid ribonuclease activity(GO:0004523) |
| 0.0 | 0.5 | GO:0010521 | telomerase inhibitor activity(GO:0010521) |
| 0.0 | 1.0 | GO:0004298 | threonine-type endopeptidase activity(GO:0004298) threonine-type peptidase activity(GO:0070003) |
| 0.0 | 5.1 | GO:0001047 | core promoter binding(GO:0001047) |
| 0.0 | 2.2 | GO:0051019 | mitogen-activated protein kinase binding(GO:0051019) |
| 0.0 | 0.5 | GO:0070181 | mRNA 5'-UTR binding(GO:0048027) small ribosomal subunit rRNA binding(GO:0070181) |
| 0.0 | 1.0 | GO:0042805 | actinin binding(GO:0042805) |
| 0.0 | 2.6 | GO:0003727 | single-stranded RNA binding(GO:0003727) |
| 0.0 | 0.3 | GO:0016813 | hydrolase activity, acting on carbon-nitrogen (but not peptide) bonds, in linear amidines(GO:0016813) |
| 0.0 | 1.3 | GO:0051879 | Hsp90 protein binding(GO:0051879) |
| 0.0 | 2.7 | GO:0004540 | ribonuclease activity(GO:0004540) |
| 0.0 | 0.9 | GO:0031369 | translation initiation factor binding(GO:0031369) |
| 0.0 | 0.1 | GO:0005127 | ciliary neurotrophic factor receptor binding(GO:0005127) |
| 0.0 | 1.8 | GO:0008186 | ATP-dependent RNA helicase activity(GO:0004004) RNA-dependent ATPase activity(GO:0008186) |
| 0.0 | 0.3 | GO:0016868 | intramolecular transferase activity, phosphotransferases(GO:0016868) |
| 0.0 | 0.9 | GO:0034945 | dihydrolipoamide branched chain acyltransferase activity(GO:0004147) palmitoleoyl [acyl-carrier-protein]-dependent acyltransferase activity(GO:0008951) serine O-acyltransferase activity(GO:0016412) O-succinyltransferase activity(GO:0016750) sinapoyltransferase activity(GO:0016752) O-sinapoyltransferase activity(GO:0016753) peptidyl-lysine N6-myristoyltransferase activity(GO:0018030) peptidyl-lysine N6-palmitoyltransferase activity(GO:0018031) benzoyl acetate-CoA thiolase activity(GO:0018711) 3-hydroxybutyryl-CoA thiolase activity(GO:0018712) 3-ketopimelyl-CoA thiolase activity(GO:0018713) N-palmitoyltransferase activity(GO:0019105) acyl-CoA N-acyltransferase activity(GO:0019186) protein-cysteine S-myristoyltransferase activity(GO:0019705) glucosaminyl-phosphotidylinositol O-acyltransferase activity(GO:0032216) ergosterol O-acyltransferase activity(GO:0034737) lanosterol O-acyltransferase activity(GO:0034738) naphthyl-2-oxomethyl-succinyl-CoA succinyl transferase activity(GO:0034848) 2,4,4-trimethyl-3-oxopentanoyl-CoA 2-C-propanoyl transferase activity(GO:0034851) 2-methylhexanoyl-CoA C-acetyltransferase activity(GO:0034915) butyryl-CoA 2-C-propionyltransferase activity(GO:0034919) 2,6-dimethyl-5-methylene-3-oxo-heptanoyl-CoA C-acetyltransferase activity(GO:0034945) L-2-aminoadipate N-acetyltransferase activity(GO:0043741) keto acid formate lyase activity(GO:0043806) azetidine-2-carboxylic acid acetyltransferase activity(GO:0046941) peptidyl-lysine N-acetyltransferase activity, acting on acetyl phosphate as donor(GO:0052858) acetyl-CoA:L-lysine N6-acetyltransferase(GO:0090595) |
| 0.0 | 0.2 | GO:0004383 | guanylate cyclase activity(GO:0004383) |
| 0.0 | 7.1 | GO:0043565 | sequence-specific DNA binding(GO:0043565) |
| 0.0 | 0.2 | GO:0019208 | phosphatase regulator activity(GO:0019208) |
| 0.0 | 0.1 | GO:0004652 | polynucleotide adenylyltransferase activity(GO:0004652) |
| 0.0 | 8.3 | GO:0046982 | protein heterodimerization activity(GO:0046982) |
| 0.0 | 0.4 | GO:0005164 | tumor necrosis factor receptor binding(GO:0005164) |
| 0.0 | 1.3 | GO:0043851 | rRNA (adenine-N6,N6-)-dimethyltransferase activity(GO:0000179) rRNA (uridine-2'-O-)-methyltransferase activity(GO:0008650) rRNA (adenine-N6-)-methyltransferase activity(GO:0008988) rRNA (cytosine-C5-)-methyltransferase activity(GO:0009383) selenocysteine methyltransferase activity(GO:0016205) rRNA (adenine) methyltransferase activity(GO:0016433) rRNA (cytosine) methyltransferase activity(GO:0016434) rRNA (guanine) methyltransferase activity(GO:0016435) 1-phenanthrol methyltransferase activity(GO:0018707) protein-arginine N5-methyltransferase activity(GO:0019702) dimethylarsinite methyltransferase activity(GO:0034541) 4,5-dihydroxybenzo(a)pyrene methyltransferase activity(GO:0034807) 1-hydroxypyrene methyltransferase activity(GO:0034931) 1-hydroxy-6-methoxypyrene methyltransferase activity(GO:0034933) demethylmenaquinone methyltransferase activity(GO:0043770) cobalt-precorrin-6B C5-methyltransferase activity(GO:0043776) cobalt-precorrin-7 C15-methyltransferase activity(GO:0043777) cobalt-precorrin-5B C1-methyltransferase activity(GO:0043780) cobalt-precorrin-3 C17-methyltransferase activity(GO:0043782) dimethylamine methyltransferase activity(GO:0043791) hydroxyneurosporene-O-methyltransferase activity(GO:0043803) tRNA (adenine-57, 58-N(1)-) methyltransferase activity(GO:0043827) methylamine-specific methylcobalamin:coenzyme M methyltransferase activity(GO:0043833) trimethylamine methyltransferase activity(GO:0043834) methanol-specific methylcobalamin:coenzyme M methyltransferase activity(GO:0043851) monomethylamine methyltransferase activity(GO:0043852) P-methyltransferase activity(GO:0051994) Se-methyltransferase activity(GO:0051995) 2-phytyl-1,4-naphthoquinone methyltransferase activity(GO:0052624) tRNA (uracil-2'-O-)-methyltransferase activity(GO:0052665) tRNA (cytosine-2'-O-)-methyltransferase activity(GO:0052666) phosphomethylethanolamine N-methyltransferase activity(GO:0052667) tRNA (cytosine-3-)-methyltransferase activity(GO:0052735) rRNA (cytosine-2'-O-)-methyltransferase activity(GO:0070677) rRNA (cytosine-N4-)-methyltransferase activity(GO:0071424) trihydroxyferuloyl spermidine O-methyltransferase activity(GO:0080012) |
| 0.0 | 4.2 | GO:0016791 | phosphatase activity(GO:0016791) |
| 0.0 | 0.6 | GO:0004527 | exonuclease activity(GO:0004527) |
| 0.0 | 4.9 | GO:0005509 | calcium ion binding(GO:0005509) |