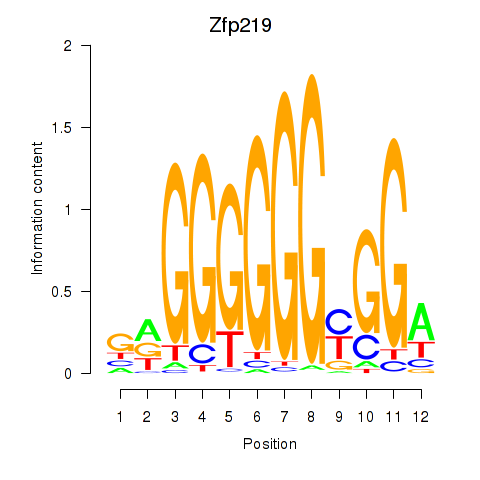
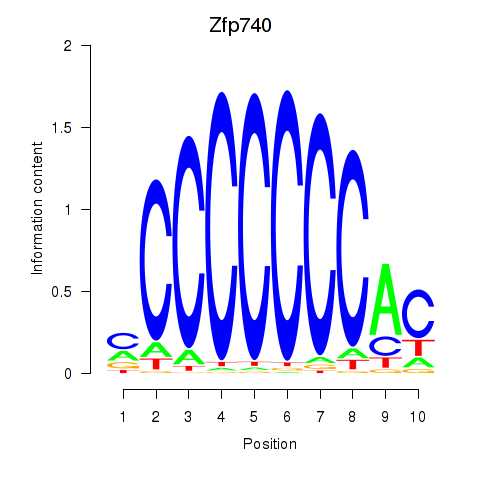
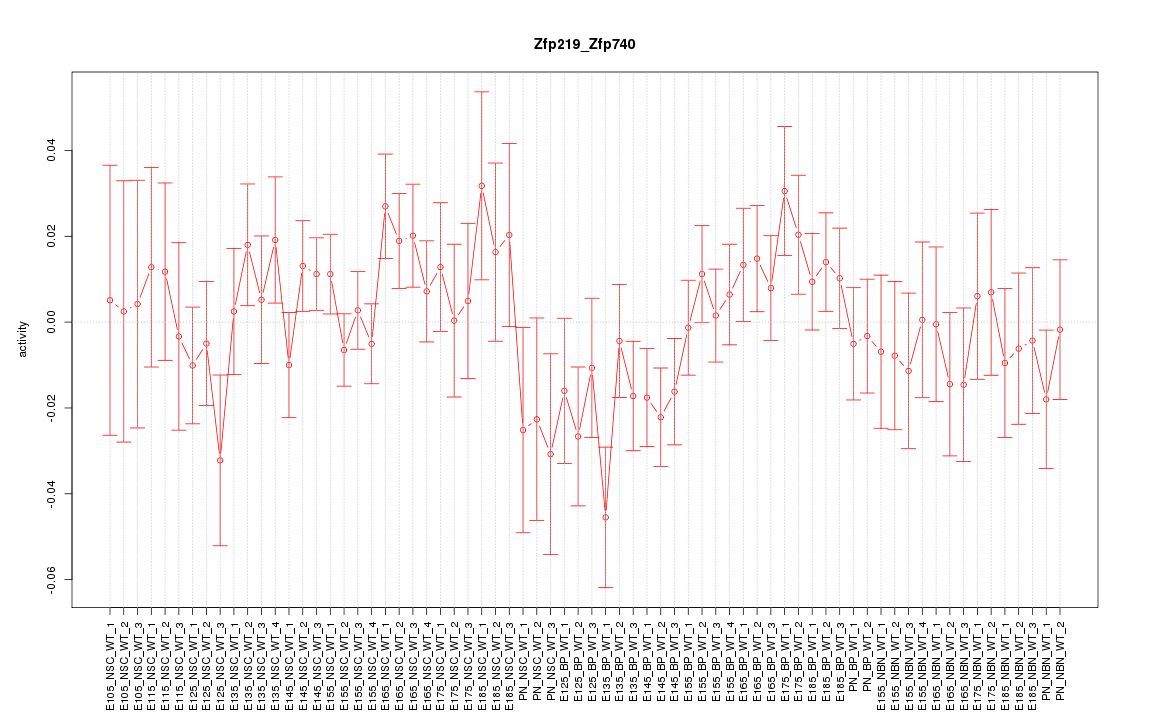
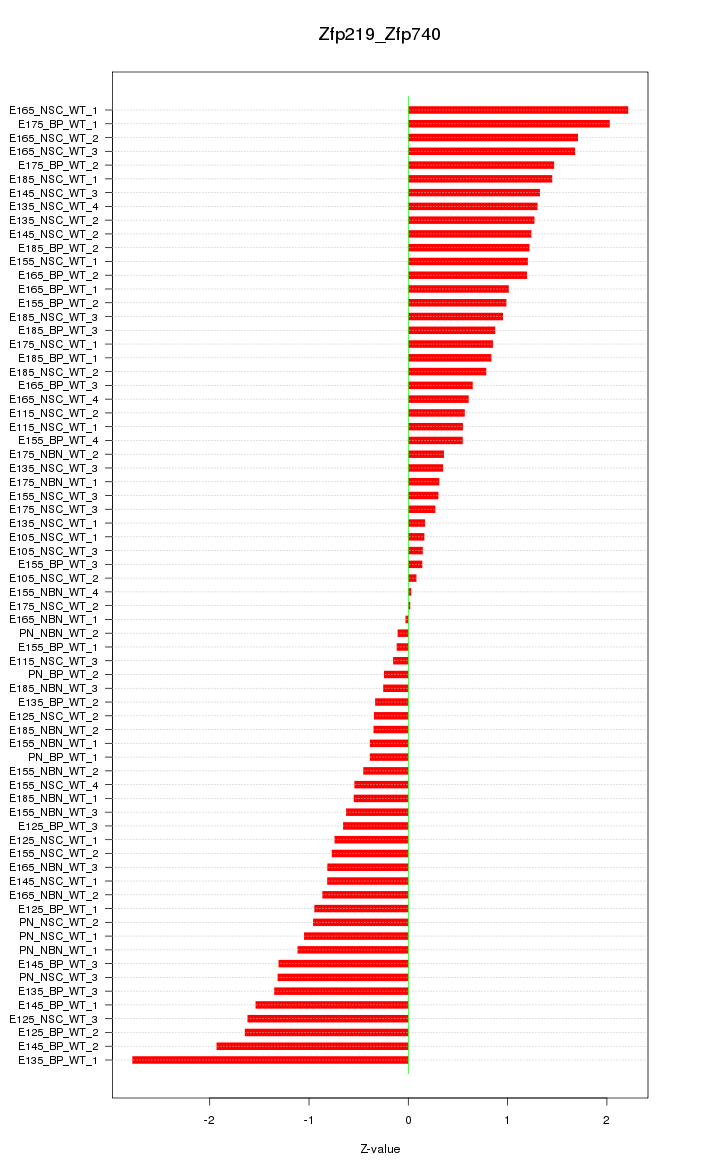
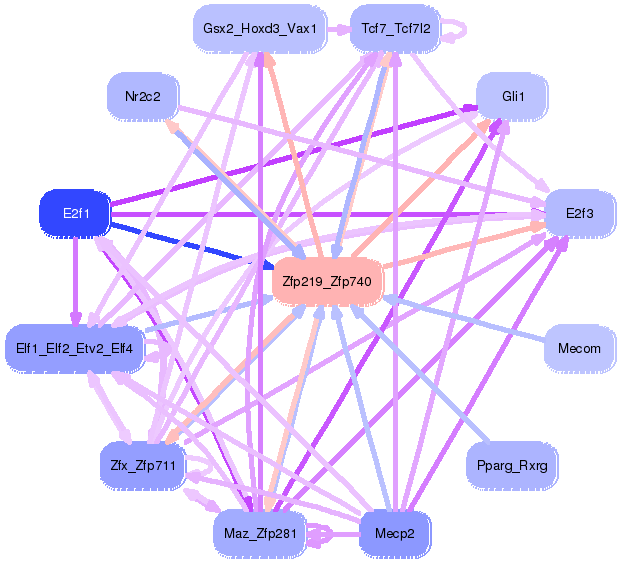
Motif ID: Zfp219_Zfp740
Z-value: 1.016
Transcription factors associated with Zfp219_Zfp740:
| Gene Symbol | Entrez ID | Gene Name |
|---|---|---|
| Zfp219 | ENSMUSG00000049295.10 | Zfp219 |
| Zfp740 | ENSMUSG00000046897.10 | Zfp740 |
Activity-expression correlation:
| Gene Symbol | Promoter | Pearson corr. coef. | P-value | Plot |
|---|---|---|---|---|
| Zfp740 | mm10_v2_chr15_+_102203639_102203709 | 0.29 | 1.6e-02 | Click! |
| Zfp219 | mm10_v2_chr14_-_52020698_52020737 | 0.26 | 3.2e-02 | Click! |

Top targets:
Gene overrepresentation in biological_process category:
| Log-likelihood per target | Total log-likelihood | Term | Description |
|---|---|---|---|
| 1.9 | 5.8 | GO:0048686 | regulation of sprouting of injured axon(GO:0048686) regulation of axon extension involved in regeneration(GO:0048690) |
| 1.2 | 6.1 | GO:2000587 | regulation of platelet-derived growth factor receptor-beta signaling pathway(GO:2000586) negative regulation of platelet-derived growth factor receptor-beta signaling pathway(GO:2000587) |
| 1.1 | 4.5 | GO:0003357 | noradrenergic neuron differentiation(GO:0003357) |
| 1.1 | 4.5 | GO:0060032 | notochord regression(GO:0060032) |
| 1.1 | 3.3 | GO:0060399 | positive regulation of growth hormone receptor signaling pathway(GO:0060399) |
| 1.1 | 3.3 | GO:1904049 | regulation of spontaneous neurotransmitter secretion(GO:1904048) negative regulation of spontaneous neurotransmitter secretion(GO:1904049) |
| 1.0 | 4.2 | GO:2000525 | regulation of T cell costimulation(GO:2000523) positive regulation of T cell costimulation(GO:2000525) |
| 0.9 | 2.7 | GO:0097402 | neuroblast migration(GO:0097402) |
| 0.8 | 3.8 | GO:0070345 | negative regulation of fat cell proliferation(GO:0070345) |
| 0.8 | 3.0 | GO:0043974 | histone H3-K27 acetylation(GO:0043974) regulation of histone H3-K27 acetylation(GO:1901674) |
| 0.7 | 3.9 | GO:1903056 | regulation of lens fiber cell differentiation(GO:1902746) positive regulation of lens fiber cell differentiation(GO:1902748) regulation of melanosome organization(GO:1903056) |
| 0.6 | 1.7 | GO:0072718 | response to cisplatin(GO:0072718) |
| 0.6 | 4.6 | GO:0007406 | negative regulation of neuroblast proliferation(GO:0007406) |
| 0.6 | 1.1 | GO:2001027 | negative regulation of endothelial cell chemotaxis(GO:2001027) |
| 0.5 | 3.2 | GO:1904936 | cerebral cortex GABAergic interneuron migration(GO:0021853) interneuron migration(GO:1904936) |
| 0.5 | 2.0 | GO:0018076 | N-terminal peptidyl-lysine acetylation(GO:0018076) |
| 0.5 | 1.0 | GO:0021759 | globus pallidus development(GO:0021759) |
| 0.4 | 0.9 | GO:0021965 | spinal cord ventral commissure morphogenesis(GO:0021965) |
| 0.4 | 1.3 | GO:0036091 | positive regulation of transcription from RNA polymerase II promoter in response to oxidative stress(GO:0036091) |
| 0.4 | 1.3 | GO:2000297 | negative regulation of synapse maturation(GO:2000297) |
| 0.4 | 1.6 | GO:0001907 | killing by symbiont of host cells(GO:0001907) induction of programmed cell death(GO:0012502) disruption by symbiont of host cell(GO:0044004) positive regulation of apoptotic process in other organism(GO:0044533) positive regulation by symbiont of host programmed cell death(GO:0052042) positive regulation by symbiont of host apoptotic process(GO:0052151) positive regulation by organism of programmed cell death in other organism involved in symbiotic interaction(GO:0052330) positive regulation by organism of apoptotic process in other organism involved in symbiotic interaction(GO:0052501) positive regulation of apoptotic process by virus(GO:0060139) apoptotic process involved in embryonic digit morphogenesis(GO:1902263) positive regulation of fibroblast apoptotic process(GO:2000271) |
| 0.4 | 0.8 | GO:0072103 | glomerulus vasculature morphogenesis(GO:0072103) glomerular capillary formation(GO:0072104) |
| 0.4 | 1.6 | GO:0033088 | negative regulation of immature T cell proliferation in thymus(GO:0033088) |
| 0.4 | 0.7 | GO:2000078 | positive regulation of type B pancreatic cell development(GO:2000078) |
| 0.4 | 0.7 | GO:2000974 | inhibition of neuroepithelial cell differentiation(GO:0002085) ascending aorta development(GO:0035905) ascending aorta morphogenesis(GO:0035910) negative regulation of auditory receptor cell differentiation(GO:0045608) negative regulation of pro-B cell differentiation(GO:2000974) |
| 0.4 | 1.1 | GO:0021830 | interneuron migration from the subpallium to the cortex(GO:0021830) |
| 0.4 | 5.3 | GO:0048096 | chromatin-mediated maintenance of transcription(GO:0048096) |
| 0.4 | 1.1 | GO:0046881 | positive regulation of follicle-stimulating hormone secretion(GO:0046881) |
| 0.3 | 4.0 | GO:1990403 | embryonic brain development(GO:1990403) |
| 0.3 | 1.0 | GO:1904395 | positive regulation of receptor clustering(GO:1903911) regulation of skeletal muscle acetylcholine-gated channel clustering(GO:1904393) positive regulation of skeletal muscle acetylcholine-gated channel clustering(GO:1904395) |
| 0.3 | 1.7 | GO:0060178 | regulation of exocyst localization(GO:0060178) |
| 0.3 | 1.3 | GO:0003192 | mitral valve formation(GO:0003192) condensed mesenchymal cell proliferation(GO:0072137) |
| 0.3 | 1.0 | GO:0021698 | cerebellar cortex structural organization(GO:0021698) |
| 0.3 | 1.2 | GO:0002457 | T cell antigen processing and presentation(GO:0002457) |
| 0.3 | 0.9 | GO:0015910 | peroxisomal long-chain fatty acid import(GO:0015910) |
| 0.3 | 1.2 | GO:0051305 | chromosome movement towards spindle pole(GO:0051305) |
| 0.3 | 1.5 | GO:0014886 | transition between slow and fast fiber(GO:0014886) |
| 0.3 | 2.0 | GO:0090336 | positive regulation of brown fat cell differentiation(GO:0090336) |
| 0.3 | 2.0 | GO:2001185 | regulation of CD8-positive, alpha-beta T cell activation(GO:2001185) |
| 0.3 | 2.5 | GO:0042118 | endothelial cell activation(GO:0042118) |
| 0.3 | 1.6 | GO:1900112 | regulation of histone H3-K9 trimethylation(GO:1900112) negative regulation of histone H3-K9 trimethylation(GO:1900113) |
| 0.3 | 1.1 | GO:0003150 | muscular septum morphogenesis(GO:0003150) |
| 0.3 | 1.3 | GO:1900109 | regulation of histone H3-K9 dimethylation(GO:1900109) |
| 0.3 | 2.1 | GO:0060836 | lymphatic endothelial cell differentiation(GO:0060836) |
| 0.3 | 2.6 | GO:0010571 | positive regulation of nuclear cell cycle DNA replication(GO:0010571) |
| 0.3 | 0.5 | GO:0072095 | regulation of branch elongation involved in ureteric bud branching(GO:0072095) |
| 0.2 | 2.5 | GO:0032876 | negative regulation of DNA endoreduplication(GO:0032876) |
| 0.2 | 3.2 | GO:0021902 | commitment of neuronal cell to specific neuron type in forebrain(GO:0021902) |
| 0.2 | 2.6 | GO:0042572 | retinol metabolic process(GO:0042572) |
| 0.2 | 0.7 | GO:0044340 | neural plate elongation(GO:0014022) convergent extension involved in neural plate elongation(GO:0022007) canonical Wnt signaling pathway involved in regulation of cell proliferation(GO:0044340) |
| 0.2 | 1.6 | GO:0070814 | hydrogen sulfide biosynthetic process(GO:0070814) |
| 0.2 | 0.9 | GO:0044268 | multicellular organismal protein metabolic process(GO:0044268) |
| 0.2 | 0.2 | GO:1904398 | positive regulation of neuromuscular junction development(GO:1904398) |
| 0.2 | 0.6 | GO:1900039 | positive regulation of cellular response to hypoxia(GO:1900039) |
| 0.2 | 0.8 | GO:0061010 | gall bladder development(GO:0061010) |
| 0.2 | 3.5 | GO:0030325 | adrenal gland development(GO:0030325) |
| 0.2 | 1.3 | GO:0043569 | negative regulation of insulin-like growth factor receptor signaling pathway(GO:0043569) |
| 0.2 | 0.8 | GO:1901165 | positive regulation of trophoblast cell migration(GO:1901165) |
| 0.2 | 2.1 | GO:0060746 | parental behavior(GO:0060746) |
| 0.2 | 1.1 | GO:0000160 | phosphorelay signal transduction system(GO:0000160) |
| 0.2 | 0.6 | GO:1902915 | negative regulation of protein K63-linked ubiquitination(GO:1900045) negative regulation of protein polyubiquitination(GO:1902915) |
| 0.2 | 1.1 | GO:0050861 | positive regulation of B cell receptor signaling pathway(GO:0050861) |
| 0.2 | 1.6 | GO:0097154 | GABAergic neuron differentiation(GO:0097154) |
| 0.2 | 0.4 | GO:0003221 | right ventricular cardiac muscle tissue morphogenesis(GO:0003221) |
| 0.2 | 3.6 | GO:0061029 | eyelid development in camera-type eye(GO:0061029) |
| 0.2 | 0.5 | GO:0007290 | spermatid nucleus elongation(GO:0007290) |
| 0.2 | 0.8 | GO:2000623 | regulation of nuclear-transcribed mRNA catabolic process, nonsense-mediated decay(GO:2000622) negative regulation of nuclear-transcribed mRNA catabolic process, nonsense-mediated decay(GO:2000623) |
| 0.2 | 1.5 | GO:0002903 | negative regulation of B cell apoptotic process(GO:0002903) |
| 0.2 | 1.2 | GO:0072321 | chaperone-mediated protein transport(GO:0072321) |
| 0.2 | 0.3 | GO:0072553 | terminal button organization(GO:0072553) |
| 0.2 | 0.2 | GO:0043585 | nose morphogenesis(GO:0043585) |
| 0.2 | 0.5 | GO:2000054 | regulation of centromeric sister chromatid cohesion(GO:0070602) regulation of Wnt signaling pathway involved in dorsal/ventral axis specification(GO:2000053) negative regulation of Wnt signaling pathway involved in dorsal/ventral axis specification(GO:2000054) |
| 0.2 | 1.0 | GO:0036444 | calcium ion transmembrane import into mitochondrion(GO:0036444) |
| 0.2 | 0.9 | GO:0048934 | peripheral nervous system neuron differentiation(GO:0048934) peripheral nervous system neuron development(GO:0048935) |
| 0.1 | 1.2 | GO:0070317 | negative regulation of G0 to G1 transition(GO:0070317) |
| 0.1 | 0.7 | GO:0006072 | glycerol-3-phosphate metabolic process(GO:0006072) |
| 0.1 | 2.2 | GO:0060736 | prostate gland growth(GO:0060736) |
| 0.1 | 1.6 | GO:1902459 | positive regulation of stem cell population maintenance(GO:1902459) |
| 0.1 | 1.0 | GO:0016584 | nucleosome positioning(GO:0016584) |
| 0.1 | 0.8 | GO:0000056 | ribosomal small subunit export from nucleus(GO:0000056) |
| 0.1 | 2.2 | GO:0070935 | 3'-UTR-mediated mRNA stabilization(GO:0070935) |
| 0.1 | 0.6 | GO:0035426 | extracellular matrix-cell signaling(GO:0035426) |
| 0.1 | 0.6 | GO:0035609 | C-terminal protein deglutamylation(GO:0035609) |
| 0.1 | 0.3 | GO:0006344 | maintenance of chromatin silencing(GO:0006344) |
| 0.1 | 0.3 | GO:0060129 | thyroid-stimulating hormone-secreting cell differentiation(GO:0060129) |
| 0.1 | 0.9 | GO:1990118 | sodium ion import across plasma membrane(GO:0098719) sodium ion import into cell(GO:1990118) |
| 0.1 | 0.7 | GO:0036337 | Fas signaling pathway(GO:0036337) |
| 0.1 | 2.1 | GO:0070816 | phosphorylation of RNA polymerase II C-terminal domain(GO:0070816) |
| 0.1 | 0.3 | GO:2000807 | regulation of synaptic vesicle clustering(GO:2000807) |
| 0.1 | 0.9 | GO:0070544 | histone H3-K36 demethylation(GO:0070544) |
| 0.1 | 0.8 | GO:0090188 | negative regulation of pancreatic juice secretion(GO:0090188) |
| 0.1 | 0.7 | GO:0043568 | positive regulation of insulin-like growth factor receptor signaling pathway(GO:0043568) |
| 0.1 | 0.1 | GO:1901187 | regulation of ephrin receptor signaling pathway(GO:1901187) |
| 0.1 | 0.4 | GO:0097494 | regulation of vesicle size(GO:0097494) |
| 0.1 | 0.9 | GO:0044027 | hypermethylation of CpG island(GO:0044027) |
| 0.1 | 1.5 | GO:0051764 | actin crosslink formation(GO:0051764) |
| 0.1 | 5.6 | GO:0035019 | somatic stem cell population maintenance(GO:0035019) |
| 0.1 | 0.8 | GO:0007379 | segment specification(GO:0007379) |
| 0.1 | 1.0 | GO:0014842 | regulation of skeletal muscle satellite cell proliferation(GO:0014842) |
| 0.1 | 1.5 | GO:0033234 | negative regulation of protein sumoylation(GO:0033234) |
| 0.1 | 0.5 | GO:0032911 | nerve growth factor production(GO:0032902) negative regulation of transforming growth factor beta1 production(GO:0032911) |
| 0.1 | 0.6 | GO:0045078 | positive regulation of interferon-gamma biosynthetic process(GO:0045078) |
| 0.1 | 0.5 | GO:1903300 | negative regulation of glucokinase activity(GO:0033132) negative regulation of hexokinase activity(GO:1903300) |
| 0.1 | 0.3 | GO:0090038 | negative regulation of protein kinase C signaling(GO:0090038) |
| 0.1 | 0.4 | GO:0090219 | negative regulation of lipid kinase activity(GO:0090219) |
| 0.1 | 3.2 | GO:0032728 | positive regulation of interferon-beta production(GO:0032728) |
| 0.1 | 2.1 | GO:1902043 | positive regulation of extrinsic apoptotic signaling pathway via death domain receptors(GO:1902043) |
| 0.1 | 0.8 | GO:0070102 | interleukin-6-mediated signaling pathway(GO:0070102) |
| 0.1 | 0.7 | GO:0016480 | negative regulation of transcription from RNA polymerase III promoter(GO:0016480) |
| 0.1 | 0.7 | GO:0097151 | positive regulation of inhibitory postsynaptic potential(GO:0097151) |
| 0.1 | 0.4 | GO:1903288 | regulation of potassium ion import(GO:1903286) positive regulation of potassium ion import(GO:1903288) |
| 0.1 | 0.4 | GO:0035878 | nail development(GO:0035878) |
| 0.1 | 0.5 | GO:0042756 | drinking behavior(GO:0042756) |
| 0.1 | 0.3 | GO:0000350 | generation of catalytic spliceosome for second transesterification step(GO:0000350) |
| 0.1 | 1.0 | GO:0061302 | smooth muscle cell-matrix adhesion(GO:0061302) |
| 0.1 | 0.3 | GO:0010700 | negative regulation of norepinephrine secretion(GO:0010700) purinergic nucleotide receptor signaling pathway(GO:0035590) |
| 0.1 | 2.0 | GO:0060445 | branching involved in salivary gland morphogenesis(GO:0060445) |
| 0.1 | 1.4 | GO:0044243 | collagen catabolic process(GO:0030574) multicellular organism catabolic process(GO:0044243) |
| 0.1 | 0.8 | GO:0032926 | negative regulation of activin receptor signaling pathway(GO:0032926) |
| 0.1 | 0.3 | GO:1901491 | negative regulation of lymphangiogenesis(GO:1901491) |
| 0.1 | 1.3 | GO:0006353 | DNA-templated transcription, termination(GO:0006353) |
| 0.1 | 1.3 | GO:0030213 | hyaluronan biosynthetic process(GO:0030213) |
| 0.1 | 0.9 | GO:1904262 | negative regulation of TORC1 signaling(GO:1904262) |
| 0.1 | 0.4 | GO:1903553 | positive regulation of extracellular exosome assembly(GO:1903553) |
| 0.1 | 0.3 | GO:0010961 | cellular magnesium ion homeostasis(GO:0010961) |
| 0.1 | 1.2 | GO:0032967 | positive regulation of collagen biosynthetic process(GO:0032967) |
| 0.1 | 0.9 | GO:0010388 | protein deneddylation(GO:0000338) cullin deneddylation(GO:0010388) |
| 0.1 | 0.7 | GO:0014049 | positive regulation of glutamate secretion(GO:0014049) |
| 0.1 | 0.4 | GO:1900246 | positive regulation of RIG-I signaling pathway(GO:1900246) |
| 0.1 | 0.2 | GO:2000973 | regulation of pro-B cell differentiation(GO:2000973) |
| 0.1 | 0.4 | GO:0071361 | cellular response to ethanol(GO:0071361) |
| 0.1 | 0.2 | GO:0061156 | pulmonary artery morphogenesis(GO:0061156) |
| 0.1 | 0.4 | GO:0001842 | neural fold formation(GO:0001842) |
| 0.1 | 0.2 | GO:0035964 | COPI-coated vesicle budding(GO:0035964) |
| 0.1 | 2.3 | GO:0006284 | base-excision repair(GO:0006284) |
| 0.1 | 0.7 | GO:0055090 | acylglycerol homeostasis(GO:0055090) triglyceride homeostasis(GO:0070328) |
| 0.1 | 1.3 | GO:0071108 | protein K48-linked deubiquitination(GO:0071108) |
| 0.1 | 0.4 | GO:0060903 | positive regulation of meiosis I(GO:0060903) |
| 0.1 | 0.6 | GO:0036037 | CD8-positive, alpha-beta T cell activation(GO:0036037) CD8-positive, alpha-beta T cell differentiation(GO:0043374) |
| 0.1 | 1.5 | GO:0007520 | myoblast fusion(GO:0007520) |
| 0.1 | 0.2 | GO:0097298 | regulation of nucleus size(GO:0097298) |
| 0.0 | 0.0 | GO:0060741 | prostate gland stromal morphogenesis(GO:0060741) |
| 0.0 | 1.2 | GO:0009409 | response to cold(GO:0009409) |
| 0.0 | 1.1 | GO:0042474 | middle ear morphogenesis(GO:0042474) |
| 0.0 | 0.3 | GO:0034720 | histone H3-K4 demethylation(GO:0034720) |
| 0.0 | 0.7 | GO:0038092 | nodal signaling pathway(GO:0038092) |
| 0.0 | 1.7 | GO:0021591 | ventricular system development(GO:0021591) |
| 0.0 | 2.4 | GO:0043268 | positive regulation of potassium ion transport(GO:0043268) |
| 0.0 | 0.5 | GO:0090435 | protein localization to nuclear envelope(GO:0090435) |
| 0.0 | 5.8 | GO:0006333 | chromatin assembly or disassembly(GO:0006333) |
| 0.0 | 0.8 | GO:0007205 | protein kinase C-activating G-protein coupled receptor signaling pathway(GO:0007205) |
| 0.0 | 0.3 | GO:0051574 | positive regulation of histone H3-K9 methylation(GO:0051574) |
| 0.0 | 0.1 | GO:0000733 | DNA strand renaturation(GO:0000733) |
| 0.0 | 0.1 | GO:0071318 | cellular response to ATP(GO:0071318) |
| 0.0 | 0.2 | GO:0070589 | cell wall mannoprotein biosynthetic process(GO:0000032) mannoprotein metabolic process(GO:0006056) mannoprotein biosynthetic process(GO:0006057) cell wall glycoprotein biosynthetic process(GO:0031506) cell wall biogenesis(GO:0042546) cell wall macromolecule metabolic process(GO:0044036) cell wall macromolecule biosynthetic process(GO:0044038) chain elongation of O-linked mannose residue(GO:0044845) cellular component macromolecule biosynthetic process(GO:0070589) cell wall organization or biogenesis(GO:0071554) |
| 0.0 | 0.6 | GO:0045663 | positive regulation of myoblast differentiation(GO:0045663) |
| 0.0 | 0.6 | GO:0010574 | regulation of vascular endothelial growth factor production(GO:0010574) |
| 0.0 | 0.2 | GO:1901163 | trophoblast cell migration(GO:0061450) regulation of trophoblast cell migration(GO:1901163) negative regulation of trophoblast cell migration(GO:1901164) |
| 0.0 | 0.6 | GO:0007064 | mitotic sister chromatid cohesion(GO:0007064) |
| 0.0 | 0.1 | GO:0090335 | regulation of brown fat cell differentiation(GO:0090335) |
| 0.0 | 0.4 | GO:0071378 | growth hormone receptor signaling pathway(GO:0060396) cellular response to growth hormone stimulus(GO:0071378) |
| 0.0 | 0.6 | GO:2000651 | positive regulation of sodium ion transmembrane transporter activity(GO:2000651) |
| 0.0 | 0.2 | GO:0003148 | outflow tract septum morphogenesis(GO:0003148) |
| 0.0 | 0.5 | GO:0010801 | negative regulation of peptidyl-threonine phosphorylation(GO:0010801) |
| 0.0 | 0.9 | GO:0007020 | microtubule nucleation(GO:0007020) |
| 0.0 | 0.2 | GO:0007158 | neuron cell-cell adhesion(GO:0007158) |
| 0.0 | 0.5 | GO:0040034 | regulation of development, heterochronic(GO:0040034) |
| 0.0 | 0.5 | GO:0050860 | negative regulation of T cell receptor signaling pathway(GO:0050860) |
| 0.0 | 0.5 | GO:0048305 | immunoglobulin secretion(GO:0048305) |
| 0.0 | 0.5 | GO:0010225 | response to UV-C(GO:0010225) |
| 0.0 | 1.9 | GO:0006446 | regulation of translational initiation(GO:0006446) |
| 0.0 | 3.1 | GO:0043149 | contractile actin filament bundle assembly(GO:0030038) stress fiber assembly(GO:0043149) |
| 0.0 | 0.7 | GO:0030033 | microvillus assembly(GO:0030033) |
| 0.0 | 0.1 | GO:0019858 | cytosine metabolic process(GO:0019858) |
| 0.0 | 1.7 | GO:0045638 | negative regulation of myeloid cell differentiation(GO:0045638) |
| 0.0 | 0.9 | GO:0010591 | regulation of lamellipodium assembly(GO:0010591) |
| 0.0 | 0.1 | GO:0006438 | valyl-tRNA aminoacylation(GO:0006438) |
| 0.0 | 0.1 | GO:0070634 | transepithelial ammonium transport(GO:0070634) |
| 0.0 | 0.2 | GO:0006362 | transcription elongation from RNA polymerase I promoter(GO:0006362) |
| 0.0 | 0.3 | GO:0031100 | organ regeneration(GO:0031100) |
| 0.0 | 1.6 | GO:0060021 | palate development(GO:0060021) |
| 0.0 | 0.1 | GO:0043137 | DNA replication, Okazaki fragment processing(GO:0033567) DNA replication, removal of RNA primer(GO:0043137) |
| 0.0 | 0.1 | GO:0006558 | L-phenylalanine metabolic process(GO:0006558) erythrose 4-phosphate/phosphoenolpyruvate family amino acid metabolic process(GO:1902221) |
| 0.0 | 0.3 | GO:0043982 | histone H4-K5 acetylation(GO:0043981) histone H4-K8 acetylation(GO:0043982) |
| 0.0 | 0.3 | GO:0015937 | coenzyme A biosynthetic process(GO:0015937) |
| 0.0 | 0.9 | GO:0030032 | lamellipodium assembly(GO:0030032) |
| 0.0 | 0.1 | GO:0042795 | snRNA transcription from RNA polymerase II promoter(GO:0042795) |
| 0.0 | 0.1 | GO:0051602 | response to electrical stimulus(GO:0051602) |
| 0.0 | 0.0 | GO:0070562 | regulation of vitamin D receptor signaling pathway(GO:0070562) |
| 0.0 | 0.0 | GO:0030578 | PML body organization(GO:0030578) |
| 0.0 | 0.3 | GO:0035020 | regulation of Rac protein signal transduction(GO:0035020) |
| 0.0 | 0.5 | GO:0007143 | female meiotic division(GO:0007143) |
| 0.0 | 0.8 | GO:0048384 | retinoic acid receptor signaling pathway(GO:0048384) |
| 0.0 | 1.1 | GO:0046847 | filopodium assembly(GO:0046847) |
| 0.0 | 0.3 | GO:0035493 | SNARE complex assembly(GO:0035493) |
| 0.0 | 0.1 | GO:0045925 | positive regulation of female receptivity(GO:0045925) |
| 0.0 | 0.7 | GO:2000134 | negative regulation of G1/S transition of mitotic cell cycle(GO:2000134) |
| 0.0 | 0.2 | GO:0051894 | positive regulation of focal adhesion assembly(GO:0051894) |
| 0.0 | 0.2 | GO:0000042 | protein targeting to Golgi(GO:0000042) |
| 0.0 | 0.7 | GO:0045773 | positive regulation of axon extension(GO:0045773) |
| 0.0 | 0.2 | GO:2000114 | regulation of establishment of cell polarity(GO:2000114) |
| 0.0 | 0.2 | GO:0032060 | bleb assembly(GO:0032060) |
| 0.0 | 0.1 | GO:0036506 | maintenance of unfolded protein(GO:0036506) protein insertion into ER membrane(GO:0045048) tail-anchored membrane protein insertion into ER membrane(GO:0071816) maintenance of unfolded protein involved in ERAD pathway(GO:1904378) |
| 0.0 | 1.8 | GO:0048864 | stem cell development(GO:0048864) |
| 0.0 | 0.1 | GO:0061687 | detoxification of inorganic compound(GO:0061687) |
| 0.0 | 0.9 | GO:0045740 | positive regulation of DNA replication(GO:0045740) |
| 0.0 | 0.1 | GO:0006049 | UDP-N-acetylglucosamine catabolic process(GO:0006049) |
| 0.0 | 0.1 | GO:0070914 | UV-damage excision repair(GO:0070914) |
| 0.0 | 0.2 | GO:0071480 | cellular response to gamma radiation(GO:0071480) |
| 0.0 | 0.2 | GO:0043968 | histone H2A acetylation(GO:0043968) |
| 0.0 | 0.1 | GO:0016127 | cholesterol catabolic process(GO:0006707) sterol catabolic process(GO:0016127) |
| 0.0 | 0.2 | GO:0001516 | prostaglandin biosynthetic process(GO:0001516) prostanoid biosynthetic process(GO:0046457) |
| 0.0 | 0.3 | GO:0048041 | cell-substrate adherens junction assembly(GO:0007045) focal adhesion assembly(GO:0048041) |
| 0.0 | 0.1 | GO:0030644 | cellular chloride ion homeostasis(GO:0030644) |
| 0.0 | 0.5 | GO:0048286 | lung alveolus development(GO:0048286) |
| 0.0 | 0.1 | GO:0071225 | cellular response to muramyl dipeptide(GO:0071225) |
| 0.0 | 0.5 | GO:0006376 | mRNA splice site selection(GO:0006376) |
| 0.0 | 0.0 | GO:0015675 | nickel cation transport(GO:0015675) |
| 0.0 | 0.4 | GO:0060976 | coronary vasculature development(GO:0060976) |
Gene overrepresentation in cellular_component category:
| Log-likelihood per target | Total log-likelihood | Term | Description |
|---|---|---|---|
| 1.3 | 3.8 | GO:0071953 | elastic fiber(GO:0071953) |
| 0.7 | 2.2 | GO:0038045 | large latent transforming growth factor-beta complex(GO:0038045) |
| 0.7 | 2.1 | GO:0002944 | cyclin K-CDK12 complex(GO:0002944) |
| 0.7 | 2.8 | GO:0043259 | laminin-10 complex(GO:0043259) |
| 0.7 | 3.3 | GO:1990761 | growth cone lamellipodium(GO:1990761) |
| 0.6 | 1.9 | GO:0030868 | smooth endoplasmic reticulum membrane(GO:0030868) smooth endoplasmic reticulum part(GO:0097425) |
| 0.6 | 3.0 | GO:0044666 | MLL3/4 complex(GO:0044666) |
| 0.6 | 1.1 | GO:0005577 | fibrinogen complex(GO:0005577) |
| 0.4 | 4.4 | GO:0048188 | Set1C/COMPASS complex(GO:0048188) |
| 0.3 | 4.5 | GO:0097542 | ciliary tip(GO:0097542) |
| 0.3 | 1.2 | GO:0036454 | insulin-like growth factor binding protein complex(GO:0016942) growth factor complex(GO:0036454) insulin-like growth factor ternary complex(GO:0042567) |
| 0.3 | 2.1 | GO:0016281 | eukaryotic translation initiation factor 4F complex(GO:0016281) |
| 0.3 | 1.1 | GO:0043511 | inhibin complex(GO:0043511) |
| 0.2 | 0.9 | GO:0032127 | dense core granule membrane(GO:0032127) |
| 0.2 | 0.9 | GO:1990421 | subtelomeric heterochromatin(GO:1990421) nuclear subtelomeric heterochromatin(GO:1990707) |
| 0.2 | 0.9 | GO:1990590 | ATF1-ATF4 transcription factor complex(GO:1990590) |
| 0.2 | 1.6 | GO:0097136 | Bcl-2 family protein complex(GO:0097136) |
| 0.2 | 2.4 | GO:0000940 | condensed chromosome outer kinetochore(GO:0000940) |
| 0.2 | 1.1 | GO:0044294 | dendritic growth cone(GO:0044294) |
| 0.2 | 3.9 | GO:0010369 | chromocenter(GO:0010369) |
| 0.2 | 1.0 | GO:0070776 | H3 histone acetyltransferase complex(GO:0070775) MOZ/MORF histone acetyltransferase complex(GO:0070776) |
| 0.2 | 0.8 | GO:0036056 | filtration diaphragm(GO:0036056) slit diaphragm(GO:0036057) |
| 0.1 | 0.7 | GO:0009331 | glycerol-3-phosphate dehydrogenase complex(GO:0009331) |
| 0.1 | 1.0 | GO:1990246 | uniplex complex(GO:1990246) |
| 0.1 | 1.2 | GO:0005862 | muscle thin filament tropomyosin(GO:0005862) |
| 0.1 | 2.4 | GO:0005665 | DNA-directed RNA polymerase II, core complex(GO:0005665) |
| 0.1 | 0.4 | GO:0034679 | integrin alpha9-beta1 complex(GO:0034679) |
| 0.1 | 1.6 | GO:0031011 | Ino80 complex(GO:0031011) |
| 0.1 | 4.0 | GO:0035869 | ciliary transition zone(GO:0035869) |
| 0.1 | 2.6 | GO:0071339 | MLL1/2 complex(GO:0044665) MLL1 complex(GO:0071339) |
| 0.1 | 0.9 | GO:0005916 | fascia adherens(GO:0005916) |
| 0.1 | 1.2 | GO:0071782 | endoplasmic reticulum tubular network(GO:0071782) |
| 0.1 | 1.6 | GO:0005721 | pericentric heterochromatin(GO:0005721) |
| 0.1 | 1.2 | GO:0043219 | lateral loop(GO:0043219) |
| 0.1 | 0.9 | GO:0032584 | growth cone membrane(GO:0032584) |
| 0.1 | 1.3 | GO:0031010 | ISWI-type complex(GO:0031010) |
| 0.1 | 0.9 | GO:0061700 | GATOR2 complex(GO:0061700) |
| 0.1 | 7.3 | GO:0005905 | clathrin-coated pit(GO:0005905) |
| 0.1 | 4.3 | GO:0005844 | polysome(GO:0005844) |
| 0.1 | 2.0 | GO:0055038 | recycling endosome membrane(GO:0055038) |
| 0.1 | 0.5 | GO:0012510 | trans-Golgi network transport vesicle membrane(GO:0012510) |
| 0.1 | 0.7 | GO:0043083 | synaptic cleft(GO:0043083) |
| 0.1 | 6.3 | GO:0000118 | histone deacetylase complex(GO:0000118) |
| 0.1 | 0.3 | GO:0030665 | clathrin-coated vesicle membrane(GO:0030665) |
| 0.1 | 3.2 | GO:0009925 | basal plasma membrane(GO:0009925) |
| 0.1 | 0.6 | GO:0097449 | astrocyte projection(GO:0097449) |
| 0.1 | 0.2 | GO:0070765 | gamma-secretase complex(GO:0070765) |
| 0.1 | 0.4 | GO:0005890 | sodium:potassium-exchanging ATPase complex(GO:0005890) |
| 0.1 | 0.5 | GO:0005677 | chromatin silencing complex(GO:0005677) |
| 0.1 | 0.4 | GO:0044232 | organelle membrane contact site(GO:0044232) |
| 0.0 | 0.3 | GO:0071664 | beta-catenin-TCF7L2 complex(GO:0070369) catenin-TCF7L2 complex(GO:0071664) |
| 0.0 | 0.6 | GO:0031235 | intrinsic component of the cytoplasmic side of the plasma membrane(GO:0031235) |
| 0.0 | 1.1 | GO:0016592 | mediator complex(GO:0016592) |
| 0.0 | 0.2 | GO:0031502 | dolichyl-phosphate-mannose-protein mannosyltransferase complex(GO:0031502) |
| 0.0 | 1.3 | GO:0000307 | cyclin-dependent protein kinase holoenzyme complex(GO:0000307) |
| 0.0 | 2.3 | GO:0017053 | transcriptional repressor complex(GO:0017053) |
| 0.0 | 14.3 | GO:0005667 | transcription factor complex(GO:0005667) |
| 0.0 | 0.9 | GO:0005779 | integral component of peroxisomal membrane(GO:0005779) |
| 0.0 | 1.1 | GO:0030673 | axolemma(GO:0030673) |
| 0.0 | 0.4 | GO:0005662 | DNA replication factor A complex(GO:0005662) |
| 0.0 | 1.4 | GO:0045171 | intercellular bridge(GO:0045171) |
| 0.0 | 0.5 | GO:0097539 | ciliary transition fiber(GO:0097539) |
| 0.0 | 1.0 | GO:0008023 | transcription elongation factor complex(GO:0008023) |
| 0.0 | 0.2 | GO:0030127 | COPII vesicle coat(GO:0030127) |
| 0.0 | 0.4 | GO:1990124 | messenger ribonucleoprotein complex(GO:1990124) |
| 0.0 | 0.6 | GO:0001741 | XY body(GO:0001741) |
| 0.0 | 0.2 | GO:1990909 | Wnt signalosome(GO:1990909) |
| 0.0 | 0.5 | GO:0071004 | U2-type prespliceosome(GO:0071004) |
| 0.0 | 1.7 | GO:0000786 | nucleosome(GO:0000786) |
| 0.0 | 0.5 | GO:0030877 | beta-catenin destruction complex(GO:0030877) |
| 0.0 | 0.4 | GO:0031430 | M band(GO:0031430) |
| 0.0 | 0.1 | GO:0097165 | nuclear stress granule(GO:0097165) |
| 0.0 | 0.3 | GO:0035098 | ESC/E(Z) complex(GO:0035098) |
| 0.0 | 1.6 | GO:0005814 | centriole(GO:0005814) |
| 0.0 | 0.1 | GO:0032299 | ribonuclease H2 complex(GO:0032299) |
| 0.0 | 0.1 | GO:0031465 | Cul4B-RING E3 ubiquitin ligase complex(GO:0031465) |
| 0.0 | 0.2 | GO:0005641 | nuclear envelope lumen(GO:0005641) |
| 0.0 | 3.3 | GO:0005925 | focal adhesion(GO:0005925) |
| 0.0 | 5.3 | GO:0000785 | chromatin(GO:0000785) |
| 0.0 | 0.1 | GO:0071818 | BAT3 complex(GO:0071818) ER membrane insertion complex(GO:0072379) |
| 0.0 | 0.7 | GO:0016328 | lateral plasma membrane(GO:0016328) |
| 0.0 | 0.7 | GO:0008180 | COP9 signalosome(GO:0008180) |
| 0.0 | 0.3 | GO:0030864 | cortical actin cytoskeleton(GO:0030864) |
| 0.0 | 0.5 | GO:0010494 | cytoplasmic stress granule(GO:0010494) |
| 0.0 | 0.2 | GO:0005840 | ribosome(GO:0005840) |
| 0.0 | 0.2 | GO:0042405 | nuclear inclusion body(GO:0042405) |
| 0.0 | 0.1 | GO:0070578 | RISC-loading complex(GO:0070578) |
| 0.0 | 0.1 | GO:0031501 | mannosyltransferase complex(GO:0031501) |
| 0.0 | 0.3 | GO:0035371 | microtubule plus-end(GO:0035371) |
| 0.0 | 0.1 | GO:0034663 | endoplasmic reticulum chaperone complex(GO:0034663) |
| 0.0 | 0.2 | GO:0001650 | fibrillar center(GO:0001650) |
| 0.0 | 0.1 | GO:0005614 | interstitial matrix(GO:0005614) |
| 0.0 | 0.3 | GO:0035145 | exon-exon junction complex(GO:0035145) |
Gene overrepresentation in molecular_function category:
| Log-likelihood per target | Total log-likelihood | Term | Description |
|---|---|---|---|
| 1.2 | 5.8 | GO:0005030 | neurotrophin receptor activity(GO:0005030) |
| 0.8 | 4.1 | GO:0001093 | TFIIB-class transcription factor binding(GO:0001093) |
| 0.6 | 4.4 | GO:1990188 | euchromatin binding(GO:1990188) |
| 0.6 | 2.2 | GO:0050436 | microfibril binding(GO:0050436) |
| 0.5 | 4.2 | GO:0001162 | RNA polymerase II intronic transcription regulatory region sequence-specific DNA binding(GO:0001162) |
| 0.5 | 1.9 | GO:0072320 | volume-sensitive chloride channel activity(GO:0072320) |
| 0.4 | 2.1 | GO:0001069 | regulatory region RNA binding(GO:0001069) |
| 0.4 | 1.6 | GO:0008802 | betaine-aldehyde dehydrogenase activity(GO:0008802) |
| 0.4 | 2.6 | GO:0052650 | NADP-retinol dehydrogenase activity(GO:0052650) |
| 0.4 | 1.5 | GO:0032422 | purine-rich negative regulatory element binding(GO:0032422) |
| 0.4 | 1.1 | GO:0070052 | collagen V binding(GO:0070052) |
| 0.3 | 5.3 | GO:0042800 | histone methyltransferase activity (H3-K4 specific)(GO:0042800) |
| 0.3 | 0.9 | GO:0003989 | acetyl-CoA carboxylase activity(GO:0003989) |
| 0.3 | 5.7 | GO:0008266 | poly(U) RNA binding(GO:0008266) |
| 0.3 | 1.0 | GO:0038049 | glucocorticoid receptor activity(GO:0004883) transcription factor activity, ligand-activated RNA polymerase II transcription factor binding(GO:0038049) glucocorticoid-activated RNA polymerase II transcription factor binding transcription factor activity(GO:0038051) |
| 0.3 | 5.9 | GO:0034185 | apolipoprotein binding(GO:0034185) |
| 0.2 | 4.2 | GO:0005003 | ephrin receptor activity(GO:0005003) |
| 0.2 | 0.7 | GO:0004368 | glycerol-3-phosphate dehydrogenase activity(GO:0004368) |
| 0.2 | 1.0 | GO:0001161 | intronic transcription regulatory region sequence-specific DNA binding(GO:0001161) |
| 0.2 | 1.2 | GO:0097001 | ceramide binding(GO:0097001) |
| 0.2 | 1.5 | GO:0032453 | histone demethylase activity (H3-K4 specific)(GO:0032453) |
| 0.2 | 1.7 | GO:0070087 | chromo shadow domain binding(GO:0070087) |
| 0.2 | 1.3 | GO:0098821 | BMP receptor activity(GO:0098821) |
| 0.2 | 0.8 | GO:0035374 | chondroitin sulfate binding(GO:0035374) |
| 0.2 | 0.8 | GO:0005176 | ErbB-2 class receptor binding(GO:0005176) |
| 0.2 | 1.1 | GO:0000155 | phosphorelay sensor kinase activity(GO:0000155) |
| 0.2 | 0.9 | GO:0005324 | long-chain fatty acid transporter activity(GO:0005324) |
| 0.2 | 2.7 | GO:0051864 | histone demethylase activity (H3-K36 specific)(GO:0051864) |
| 0.2 | 7.3 | GO:0001205 | transcriptional activator activity, RNA polymerase II distal enhancer sequence-specific binding(GO:0001205) |
| 0.2 | 0.8 | GO:0038085 | vascular endothelial growth factor binding(GO:0038085) |
| 0.2 | 0.8 | GO:0050265 | RNA uridylyltransferase activity(GO:0050265) |
| 0.2 | 0.5 | GO:0038132 | neuregulin binding(GO:0038132) |
| 0.1 | 0.9 | GO:0034711 | inhibin binding(GO:0034711) |
| 0.1 | 0.9 | GO:0005042 | netrin receptor activity(GO:0005042) |
| 0.1 | 1.3 | GO:0008420 | CTD phosphatase activity(GO:0008420) |
| 0.1 | 1.2 | GO:0004716 | receptor signaling protein tyrosine kinase activity(GO:0004716) |
| 0.1 | 3.4 | GO:0043395 | heparan sulfate proteoglycan binding(GO:0043395) |
| 0.1 | 0.6 | GO:0043237 | laminin-1 binding(GO:0043237) |
| 0.1 | 1.1 | GO:0035184 | histone threonine kinase activity(GO:0035184) |
| 0.1 | 0.8 | GO:0046404 | ATP-dependent polydeoxyribonucleotide 5'-hydroxyl-kinase activity(GO:0046404) polydeoxyribonucleotide kinase activity(GO:0051733) |
| 0.1 | 0.8 | GO:0070699 | type II activin receptor binding(GO:0070699) |
| 0.1 | 1.3 | GO:0019870 | potassium channel inhibitor activity(GO:0019870) |
| 0.1 | 1.2 | GO:0045294 | alpha-catenin binding(GO:0045294) |
| 0.1 | 0.9 | GO:0005451 | monovalent cation:proton antiporter activity(GO:0005451) sodium:proton antiporter activity(GO:0015385) potassium:proton antiporter activity(GO:0015386) |
| 0.1 | 8.3 | GO:0003705 | transcription factor activity, RNA polymerase II distal enhancer sequence-specific binding(GO:0003705) |
| 0.1 | 1.0 | GO:0038062 | protein tyrosine kinase collagen receptor activity(GO:0038062) |
| 0.1 | 0.3 | GO:0031686 | A1 adenosine receptor binding(GO:0031686) |
| 0.1 | 1.0 | GO:0001727 | lipid kinase activity(GO:0001727) |
| 0.1 | 0.9 | GO:0051718 | DNA (cytosine-5-)-methyltransferase activity(GO:0003886) DNA (cytosine-5-)-methyltransferase activity, acting on CpG substrates(GO:0051718) |
| 0.1 | 1.1 | GO:0001055 | RNA polymerase II activity(GO:0001055) |
| 0.1 | 2.2 | GO:0008353 | RNA polymerase II carboxy-terminal domain kinase activity(GO:0008353) |
| 0.1 | 1.3 | GO:0008190 | eukaryotic initiation factor 4E binding(GO:0008190) |
| 0.1 | 2.3 | GO:0070577 | lysine-acetylated histone binding(GO:0070577) |
| 0.1 | 0.4 | GO:0004468 | lysine N-acetyltransferase activity, acting on acetyl phosphate as donor(GO:0004468) |
| 0.1 | 0.6 | GO:0019784 | NEDD8-specific protease activity(GO:0019784) |
| 0.1 | 0.8 | GO:0008429 | phosphatidylethanolamine binding(GO:0008429) |
| 0.1 | 2.1 | GO:0042813 | Wnt-activated receptor activity(GO:0042813) |
| 0.1 | 0.3 | GO:0030368 | interleukin-17 receptor activity(GO:0030368) |
| 0.1 | 3.3 | GO:0005201 | extracellular matrix structural constituent(GO:0005201) |
| 0.1 | 1.9 | GO:0030506 | ankyrin binding(GO:0030506) |
| 0.1 | 1.3 | GO:0017166 | vinculin binding(GO:0017166) |
| 0.1 | 1.6 | GO:0071837 | HMG box domain binding(GO:0071837) |
| 0.1 | 0.2 | GO:0005105 | type 1 fibroblast growth factor receptor binding(GO:0005105) |
| 0.1 | 2.2 | GO:0018602 | sulfonate dioxygenase activity(GO:0000907) 2,4-dichlorophenoxyacetate alpha-ketoglutarate dioxygenase activity(GO:0018602) hypophosphite dioxygenase activity(GO:0034792) gibberellin 2-beta-dioxygenase activity(GO:0045543) C-19 gibberellin 2-beta-dioxygenase activity(GO:0052634) C-20 gibberellin 2-beta-dioxygenase activity(GO:0052635) |
| 0.1 | 2.3 | GO:0097472 | cyclin-dependent protein serine/threonine kinase activity(GO:0004693) cyclin-dependent protein kinase activity(GO:0097472) |
| 0.1 | 0.3 | GO:0004594 | pantothenate kinase activity(GO:0004594) |
| 0.1 | 1.0 | GO:0001221 | transcription cofactor binding(GO:0001221) |
| 0.1 | 0.5 | GO:0048406 | nerve growth factor binding(GO:0048406) |
| 0.1 | 0.7 | GO:0004972 | NMDA glutamate receptor activity(GO:0004972) |
| 0.1 | 0.3 | GO:0000386 | second spliceosomal transesterification activity(GO:0000386) |
| 0.1 | 0.2 | GO:0043125 | ErbB-3 class receptor binding(GO:0043125) |
| 0.1 | 1.7 | GO:0019789 | SUMO transferase activity(GO:0019789) |
| 0.1 | 1.3 | GO:0042975 | peroxisome proliferator activated receptor binding(GO:0042975) |
| 0.1 | 0.2 | GO:0008142 | oxysterol binding(GO:0008142) |
| 0.1 | 2.0 | GO:0005086 | ARF guanyl-nucleotide exchange factor activity(GO:0005086) |
| 0.1 | 1.2 | GO:0001968 | fibronectin binding(GO:0001968) |
| 0.1 | 2.0 | GO:0008536 | Ran GTPase binding(GO:0008536) |
| 0.1 | 0.7 | GO:0008656 | cysteine-type endopeptidase activator activity involved in apoptotic process(GO:0008656) |
| 0.1 | 1.4 | GO:0008157 | protein phosphatase 1 binding(GO:0008157) |
| 0.0 | 0.6 | GO:1990841 | promoter-specific chromatin binding(GO:1990841) |
| 0.0 | 0.3 | GO:0032452 | histone demethylase activity(GO:0032452) |
| 0.0 | 0.3 | GO:0043995 | histone acetyltransferase activity (H4-K5 specific)(GO:0043995) histone acetyltransferase activity (H4-K8 specific)(GO:0043996) histone acetyltransferase activity (H4-K16 specific)(GO:0046972) |
| 0.0 | 8.2 | GO:0001227 | transcriptional repressor activity, RNA polymerase II transcription regulatory region sequence-specific binding(GO:0001227) |
| 0.0 | 0.2 | GO:0004667 | prostaglandin-D synthase activity(GO:0004667) prostaglandin-E synthase activity(GO:0050220) |
| 0.0 | 2.0 | GO:0004402 | histone acetyltransferase activity(GO:0004402) |
| 0.0 | 3.5 | GO:0046332 | SMAD binding(GO:0046332) |
| 0.0 | 0.8 | GO:0003708 | retinoic acid receptor activity(GO:0003708) |
| 0.0 | 0.4 | GO:0008556 | sodium:potassium-exchanging ATPase activity(GO:0005391) potassium-transporting ATPase activity(GO:0008556) |
| 0.0 | 0.6 | GO:0034450 | ubiquitin-ubiquitin ligase activity(GO:0034450) |
| 0.0 | 11.5 | GO:0000987 | core promoter proximal region sequence-specific DNA binding(GO:0000987) core promoter proximal region DNA binding(GO:0001159) |
| 0.0 | 1.8 | GO:0045502 | dynein binding(GO:0045502) |
| 0.0 | 0.8 | GO:0070530 | K63-linked polyubiquitin binding(GO:0070530) |
| 0.0 | 0.1 | GO:0005118 | sevenless binding(GO:0005118) |
| 0.0 | 1.2 | GO:0071889 | 14-3-3 protein binding(GO:0071889) |
| 0.0 | 0.6 | GO:0005035 | tumor necrosis factor-activated receptor activity(GO:0005031) death receptor activity(GO:0005035) |
| 0.0 | 0.2 | GO:0005173 | stem cell factor receptor binding(GO:0005173) |
| 0.0 | 0.4 | GO:0043236 | laminin binding(GO:0043236) |
| 0.0 | 0.7 | GO:0030371 | translation repressor activity(GO:0030371) |
| 0.0 | 0.2 | GO:0008321 | Ral guanyl-nucleotide exchange factor activity(GO:0008321) |
| 0.0 | 0.6 | GO:0004181 | metallocarboxypeptidase activity(GO:0004181) |
| 0.0 | 20.0 | GO:0003700 | nucleic acid binding transcription factor activity(GO:0001071) transcription factor activity, sequence-specific DNA binding(GO:0003700) |
| 0.0 | 0.7 | GO:0017161 | phosphohistidine phosphatase activity(GO:0008969) inositol-1,3,4-trisphosphate 4-phosphatase activity(GO:0017161) NADP phosphatase activity(GO:0019178) 5-amino-6-(5-phosphoribitylamino)uracil phosphatase activity(GO:0043726) phosphatidylinositol-3,5-bisphosphate 5-phosphatase activity(GO:0043813) inositol-1,3,4,5,6-pentakisphosphate 1-phosphatase activity(GO:0052825) inositol-3,4-bisphosphate 4-phosphatase activity(GO:0052828) inositol-1,3,4-trisphosphate 1-phosphatase activity(GO:0052829) inositol-1,3,4,6-tetrakisphosphate 6-phosphatase activity(GO:0052830) inositol-1,3,4,6-tetrakisphosphate 1-phosphatase activity(GO:0052831) phosphatidylinositol-1,4,5-trisphosphate 5-phosphatase activity(GO:0052867) IDP phosphatase activity(GO:1990003) |
| 0.0 | 0.1 | GO:0046790 | virion binding(GO:0046790) |
| 0.0 | 2.3 | GO:0008013 | beta-catenin binding(GO:0008013) |
| 0.0 | 1.8 | GO:0003678 | DNA helicase activity(GO:0003678) |
| 0.0 | 0.4 | GO:0097602 | cullin family protein binding(GO:0097602) |
| 0.0 | 0.1 | GO:0004832 | valine-tRNA ligase activity(GO:0004832) |
| 0.0 | 0.4 | GO:0015269 | calcium-activated potassium channel activity(GO:0015269) |
| 0.0 | 0.4 | GO:0008601 | protein phosphatase type 2A regulator activity(GO:0008601) |
| 0.0 | 2.2 | GO:0043851 | rRNA (adenine-N6,N6-)-dimethyltransferase activity(GO:0000179) rRNA (uridine-2'-O-)-methyltransferase activity(GO:0008650) rRNA (adenine-N6-)-methyltransferase activity(GO:0008988) DNA-methyltransferase activity(GO:0009008) rRNA (cytosine-C5-)-methyltransferase activity(GO:0009383) selenocysteine methyltransferase activity(GO:0016205) rRNA (adenine) methyltransferase activity(GO:0016433) rRNA (cytosine) methyltransferase activity(GO:0016434) rRNA (guanine) methyltransferase activity(GO:0016435) 1-phenanthrol methyltransferase activity(GO:0018707) protein-arginine N5-methyltransferase activity(GO:0019702) dimethylarsinite methyltransferase activity(GO:0034541) 4,5-dihydroxybenzo(a)pyrene methyltransferase activity(GO:0034807) 1-hydroxypyrene methyltransferase activity(GO:0034931) 1-hydroxy-6-methoxypyrene methyltransferase activity(GO:0034933) demethylmenaquinone methyltransferase activity(GO:0043770) cobalt-precorrin-6B C5-methyltransferase activity(GO:0043776) cobalt-precorrin-7 C15-methyltransferase activity(GO:0043777) cobalt-precorrin-5B C1-methyltransferase activity(GO:0043780) cobalt-precorrin-3 C17-methyltransferase activity(GO:0043782) dimethylamine methyltransferase activity(GO:0043791) hydroxyneurosporene-O-methyltransferase activity(GO:0043803) tRNA (adenine-57, 58-N(1)-) methyltransferase activity(GO:0043827) methylamine-specific methylcobalamin:coenzyme M methyltransferase activity(GO:0043833) trimethylamine methyltransferase activity(GO:0043834) methanol-specific methylcobalamin:coenzyme M methyltransferase activity(GO:0043851) monomethylamine methyltransferase activity(GO:0043852) P-methyltransferase activity(GO:0051994) Se-methyltransferase activity(GO:0051995) 2-phytyl-1,4-naphthoquinone methyltransferase activity(GO:0052624) tRNA (uracil-2'-O-)-methyltransferase activity(GO:0052665) tRNA (cytosine-2'-O-)-methyltransferase activity(GO:0052666) phosphomethylethanolamine N-methyltransferase activity(GO:0052667) tRNA (cytosine-3-)-methyltransferase activity(GO:0052735) rRNA (cytosine-2'-O-)-methyltransferase activity(GO:0070677) rRNA (cytosine-N4-)-methyltransferase activity(GO:0071424) trihydroxyferuloyl spermidine O-methyltransferase activity(GO:0080012) |
| 0.0 | 0.8 | GO:0019212 | phosphatase inhibitor activity(GO:0019212) |
| 0.0 | 0.2 | GO:0004169 | dolichyl-phosphate-mannose-protein mannosyltransferase activity(GO:0004169) |
| 0.0 | 0.4 | GO:0033549 | MAP kinase phosphatase activity(GO:0033549) |
| 0.0 | 0.3 | GO:0015491 | cation:cation antiporter activity(GO:0015491) |
| 0.0 | 0.2 | GO:0030550 | acetylcholine receptor inhibitor activity(GO:0030550) |
| 0.0 | 0.4 | GO:0046966 | thyroid hormone receptor binding(GO:0046966) |
| 0.0 | 0.2 | GO:0097027 | ubiquitin-protein transferase activator activity(GO:0097027) |
| 0.0 | 0.5 | GO:0001671 | ATPase activator activity(GO:0001671) |
| 0.0 | 1.3 | GO:0004197 | cysteine-type endopeptidase activity(GO:0004197) |
| 0.0 | 0.3 | GO:0030898 | actin-dependent ATPase activity(GO:0030898) |
| 0.0 | 2.1 | GO:0043565 | sequence-specific DNA binding(GO:0043565) |
| 0.0 | 0.8 | GO:0042393 | histone binding(GO:0042393) |
| 0.0 | 0.1 | GO:0004046 | aminoacylase activity(GO:0004046) |
| 0.0 | 1.1 | GO:0004712 | protein serine/threonine/tyrosine kinase activity(GO:0004712) |
| 0.0 | 0.1 | GO:0003836 | beta-galactoside (CMP) alpha-2,3-sialyltransferase activity(GO:0003836) |
| 0.0 | 0.1 | GO:0004523 | RNA-DNA hybrid ribonuclease activity(GO:0004523) |
| 0.0 | 0.1 | GO:0003827 | alpha-1,3-mannosylglycoprotein 2-beta-N-acetylglucosaminyltransferase activity(GO:0003827) |
| 0.0 | 0.3 | GO:0017075 | syntaxin-1 binding(GO:0017075) |
| 0.0 | 0.4 | GO:0031624 | ubiquitin conjugating enzyme binding(GO:0031624) |
| 0.0 | 0.3 | GO:0005164 | tumor necrosis factor receptor binding(GO:0005164) |
| 0.0 | 0.3 | GO:0070491 | repressing transcription factor binding(GO:0070491) |
| 0.0 | 0.4 | GO:0042169 | SH2 domain binding(GO:0042169) |
| 0.0 | 0.2 | GO:0003906 | DNA-(apurinic or apyrimidinic site) lyase activity(GO:0003906) |
| 0.0 | 0.1 | GO:0035198 | miRNA binding(GO:0035198) |
| 0.0 | 1.7 | GO:0000975 | regulatory region DNA binding(GO:0000975) transcription regulatory region DNA binding(GO:0044212) |
| 0.0 | 0.2 | GO:0070006 | metalloaminopeptidase activity(GO:0070006) |
| 0.0 | 0.4 | GO:0051018 | protein kinase A binding(GO:0051018) |
| 0.0 | 0.1 | GO:0070700 | BMP receptor binding(GO:0070700) |
|
|
|
|