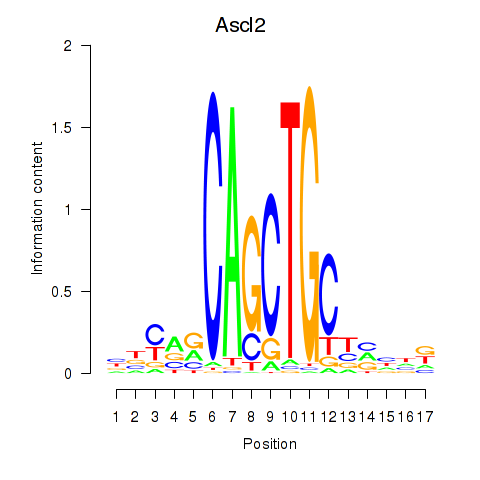
Motif ID: Ascl2
Z-value: 0.631
Transcription factors associated with Ascl2:
| Gene Symbol | Entrez ID | Gene Name |
|---|---|---|
| Ascl2 | ENSMUSG00000009248.5 | Ascl2 |

Top targets:
Gene overrepresentation in biological_process category:
| Log-likelihood per target | Total log-likelihood | Term | Description |
|---|---|---|---|
| 0.9 | 2.6 | GO:1902310 | positive regulation of peptidyl-serine dephosphorylation(GO:1902310) |
| 0.5 | 2.6 | GO:0007386 | compartment pattern specification(GO:0007386) |
| 0.5 | 1.4 | GO:0072076 | hyaluranon cable assembly(GO:0036118) nephrogenic mesenchyme development(GO:0072076) negative regulation of glomerular mesangial cell proliferation(GO:0072125) negative regulation of glomerulus development(GO:0090194) regulation of hyaluranon cable assembly(GO:1900104) positive regulation of hyaluranon cable assembly(GO:1900106) |
| 0.3 | 0.9 | GO:1903903 | striated muscle atrophy(GO:0014891) positive regulation of keratinocyte apoptotic process(GO:1902174) regulation of establishment of T cell polarity(GO:1903903) |
| 0.2 | 0.7 | GO:1903279 | regulation of calcium:sodium antiporter activity(GO:1903279) |
| 0.2 | 0.7 | GO:0010958 | regulation of amino acid import(GO:0010958) regulation of L-arginine import(GO:0010963) |
| 0.2 | 0.7 | GO:0001830 | trophectodermal cell fate commitment(GO:0001830) |
| 0.2 | 0.7 | GO:0021577 | hindbrain structural organization(GO:0021577) cerebellum structural organization(GO:0021589) |
| 0.2 | 1.5 | GO:0031536 | positive regulation of exit from mitosis(GO:0031536) |
| 0.2 | 1.1 | GO:0035331 | negative regulation of hippo signaling(GO:0035331) |
| 0.2 | 0.8 | GO:0051599 | response to hydrostatic pressure(GO:0051599) |
| 0.2 | 0.6 | GO:0042998 | positive regulation of Golgi to plasma membrane protein transport(GO:0042998) |
| 0.2 | 0.4 | GO:0086017 | Purkinje myocyte action potential(GO:0086017) |
| 0.2 | 2.0 | GO:0007220 | Notch receptor processing(GO:0007220) |
| 0.2 | 0.5 | GO:0046544 | development of secondary male sexual characteristics(GO:0046544) |
| 0.2 | 0.6 | GO:0021586 | pons maturation(GO:0021586) |
| 0.2 | 2.1 | GO:0060159 | regulation of dopamine receptor signaling pathway(GO:0060159) |
| 0.2 | 0.6 | GO:2001271 | negative regulation of cysteine-type endopeptidase activity involved in execution phase of apoptosis(GO:2001271) |
| 0.2 | 1.1 | GO:1903715 | regulation of aerobic respiration(GO:1903715) |
| 0.2 | 1.1 | GO:0060923 | cardiac muscle cell fate commitment(GO:0060923) |
| 0.1 | 1.0 | GO:0051461 | protein import into peroxisome matrix, docking(GO:0016560) regulation of corticotropin secretion(GO:0051459) positive regulation of corticotropin secretion(GO:0051461) |
| 0.1 | 0.4 | GO:1903244 | positive regulation of cardiac muscle adaptation(GO:0010615) positive regulation of cardiac muscle hypertrophy in response to stress(GO:1903244) |
| 0.1 | 0.4 | GO:0071550 | regulation of muscle atrophy(GO:0014735) death-inducing signaling complex assembly(GO:0071550) negative regulation of mitochondrial membrane permeability involved in apoptotic process(GO:1902109) |
| 0.1 | 1.5 | GO:0045603 | positive regulation of endothelial cell differentiation(GO:0045603) |
| 0.1 | 0.4 | GO:0060800 | regulation of cell differentiation involved in embryonic placenta development(GO:0060800) |
| 0.1 | 1.5 | GO:0001977 | renal system process involved in regulation of blood volume(GO:0001977) |
| 0.1 | 0.8 | GO:0003065 | positive regulation of heart rate by epinephrine(GO:0003065) |
| 0.1 | 4.0 | GO:0050873 | brown fat cell differentiation(GO:0050873) |
| 0.1 | 0.5 | GO:0019919 | peptidyl-arginine methylation, to asymmetrical-dimethyl arginine(GO:0019919) peptidyl-arginine omega-N-methylation(GO:0035247) |
| 0.1 | 0.5 | GO:0035606 | peptidyl-cysteine S-trans-nitrosylation(GO:0035606) |
| 0.1 | 1.1 | GO:1904153 | tumor necrosis factor biosynthetic process(GO:0042533) regulation of tumor necrosis factor biosynthetic process(GO:0042534) negative regulation of protein exit from endoplasmic reticulum(GO:0070862) negative regulation of retrograde protein transport, ER to cytosol(GO:1904153) |
| 0.1 | 0.3 | GO:0030327 | prenylated protein catabolic process(GO:0030327) |
| 0.1 | 1.2 | GO:0060539 | diaphragm development(GO:0060539) |
| 0.1 | 2.3 | GO:0010763 | positive regulation of fibroblast migration(GO:0010763) |
| 0.1 | 0.5 | GO:0034421 | post-translational protein acetylation(GO:0034421) |
| 0.1 | 0.2 | GO:0002578 | negative regulation of antigen processing and presentation(GO:0002578) |
| 0.1 | 1.3 | GO:0042711 | maternal behavior(GO:0042711) |
| 0.1 | 1.4 | GO:0060052 | neurofilament cytoskeleton organization(GO:0060052) |
| 0.1 | 0.9 | GO:0021678 | third ventricle development(GO:0021678) |
| 0.1 | 0.2 | GO:0042126 | nitrate metabolic process(GO:0042126) |
| 0.1 | 0.5 | GO:1901029 | negative regulation of mitochondrial outer membrane permeabilization involved in apoptotic signaling pathway(GO:1901029) |
| 0.1 | 0.4 | GO:0007182 | common-partner SMAD protein phosphorylation(GO:0007182) |
| 0.1 | 0.9 | GO:0060501 | positive regulation of epithelial cell proliferation involved in lung morphogenesis(GO:0060501) |
| 0.1 | 1.5 | GO:0043567 | regulation of insulin-like growth factor receptor signaling pathway(GO:0043567) |
| 0.1 | 3.0 | GO:0001709 | cell fate determination(GO:0001709) |
| 0.1 | 0.5 | GO:0002315 | marginal zone B cell differentiation(GO:0002315) |
| 0.1 | 0.2 | GO:0006011 | UDP-glucose metabolic process(GO:0006011) |
| 0.1 | 0.4 | GO:1903361 | protein localization to basolateral plasma membrane(GO:1903361) |
| 0.1 | 0.4 | GO:2000491 | positive regulation of hepatic stellate cell activation(GO:2000491) |
| 0.1 | 0.2 | GO:0048496 | maintenance of organ identity(GO:0048496) |
| 0.1 | 0.4 | GO:1900017 | positive regulation of cytokine production involved in inflammatory response(GO:1900017) |
| 0.1 | 1.7 | GO:0015813 | L-glutamate transport(GO:0015813) |
| 0.1 | 0.7 | GO:0042095 | interferon-gamma biosynthetic process(GO:0042095) |
| 0.1 | 0.2 | GO:0001732 | formation of cytoplasmic translation initiation complex(GO:0001732) |
| 0.1 | 0.7 | GO:0051823 | radial glia guided migration of Purkinje cell(GO:0021942) regulation of synapse structural plasticity(GO:0051823) |
| 0.1 | 0.9 | GO:2000353 | positive regulation of endothelial cell apoptotic process(GO:2000353) |
| 0.1 | 0.6 | GO:0046826 | negative regulation of protein export from nucleus(GO:0046826) |
| 0.1 | 0.2 | GO:1990034 | calcium ion export from cell(GO:1990034) |
| 0.1 | 0.7 | GO:0009650 | UV protection(GO:0009650) |
| 0.1 | 0.4 | GO:0051418 | interphase microtubule nucleation by interphase microtubule organizing center(GO:0051415) microtubule nucleation by microtubule organizing center(GO:0051418) |
| 0.1 | 0.1 | GO:1901187 | regulation of ephrin receptor signaling pathway(GO:1901187) |
| 0.1 | 0.7 | GO:0006610 | ribosomal protein import into nucleus(GO:0006610) |
| 0.1 | 0.2 | GO:0090289 | regulation of osteoclast proliferation(GO:0090289) |
| 0.1 | 0.4 | GO:0042769 | DNA damage response, detection of DNA damage(GO:0042769) |
| 0.1 | 0.3 | GO:0035426 | extracellular matrix-cell signaling(GO:0035426) |
| 0.0 | 2.1 | GO:0010718 | positive regulation of epithelial to mesenchymal transition(GO:0010718) |
| 0.0 | 0.4 | GO:0015791 | polyol transport(GO:0015791) |
| 0.0 | 0.7 | GO:0090308 | regulation of methylation-dependent chromatin silencing(GO:0090308) |
| 0.0 | 2.3 | GO:0019228 | neuronal action potential(GO:0019228) |
| 0.0 | 1.4 | GO:0048741 | skeletal muscle fiber development(GO:0048741) |
| 0.0 | 0.2 | GO:0016080 | synaptic vesicle targeting(GO:0016080) protein localization to adherens junction(GO:0071896) |
| 0.0 | 0.6 | GO:0090205 | positive regulation of cholesterol biosynthetic process(GO:0045542) positive regulation of cholesterol metabolic process(GO:0090205) |
| 0.0 | 0.2 | GO:0002949 | tRNA threonylcarbamoyladenosine modification(GO:0002949) |
| 0.0 | 0.2 | GO:0060056 | mammary gland involution(GO:0060056) |
| 0.0 | 1.0 | GO:0010719 | negative regulation of epithelial to mesenchymal transition(GO:0010719) |
| 0.0 | 0.1 | GO:0044339 | canonical Wnt signaling pathway involved in osteoblast differentiation(GO:0044339) |
| 0.0 | 0.7 | GO:0046069 | cGMP catabolic process(GO:0046069) |
| 0.0 | 0.3 | GO:0032020 | ISG15-protein conjugation(GO:0032020) |
| 0.0 | 0.1 | GO:0072061 | inner medullary collecting duct development(GO:0072061) |
| 0.0 | 0.5 | GO:0021521 | ventral spinal cord interneuron specification(GO:0021521) cell fate specification involved in pattern specification(GO:0060573) |
| 0.0 | 0.1 | GO:0035582 | sequestering of BMP in extracellular matrix(GO:0035582) |
| 0.0 | 0.1 | GO:0060166 | olfactory pit development(GO:0060166) |
| 0.0 | 0.5 | GO:0016339 | calcium-dependent cell-cell adhesion via plasma membrane cell adhesion molecules(GO:0016339) |
| 0.0 | 0.1 | GO:0046618 | drug export(GO:0046618) |
| 0.0 | 0.1 | GO:0007171 | activation of transmembrane receptor protein tyrosine kinase activity(GO:0007171) |
| 0.0 | 0.1 | GO:1900864 | mitochondrial tRNA modification(GO:0070900) mitochondrial RNA modification(GO:1900864) |
| 0.0 | 0.1 | GO:1903587 | regulation of blood vessel endothelial cell proliferation involved in sprouting angiogenesis(GO:1903587) |
| 0.0 | 0.1 | GO:0033600 | negative regulation of mammary gland epithelial cell proliferation(GO:0033600) |
| 0.0 | 0.2 | GO:0010825 | positive regulation of centrosome duplication(GO:0010825) |
| 0.0 | 0.1 | GO:0033860 | regulation of NAD(P)H oxidase activity(GO:0033860) |
| 0.0 | 0.3 | GO:0007216 | G-protein coupled glutamate receptor signaling pathway(GO:0007216) |
| 0.0 | 0.1 | GO:0046077 | dUDP biosynthetic process(GO:0006227) pyrimidine nucleoside diphosphate biosynthetic process(GO:0009139) pyrimidine deoxyribonucleoside diphosphate metabolic process(GO:0009196) pyrimidine deoxyribonucleoside diphosphate biosynthetic process(GO:0009197) dUDP metabolic process(GO:0046077) |
| 0.0 | 0.1 | GO:0097278 | virion attachment to host cell(GO:0019062) adhesion of symbiont to host cell(GO:0044650) complement-dependent cytotoxicity(GO:0097278) |
| 0.0 | 0.2 | GO:1900454 | positive regulation of long term synaptic depression(GO:1900454) |
| 0.0 | 0.7 | GO:2001244 | positive regulation of intrinsic apoptotic signaling pathway(GO:2001244) |
| 0.0 | 0.0 | GO:0046878 | sperm ejaculation(GO:0042713) positive regulation of saliva secretion(GO:0046878) |
| 0.0 | 0.1 | GO:0070318 | positive regulation of G0 to G1 transition(GO:0070318) |
| 0.0 | 0.8 | GO:0034260 | negative regulation of GTPase activity(GO:0034260) |
| 0.0 | 1.2 | GO:0030512 | negative regulation of transforming growth factor beta receptor signaling pathway(GO:0030512) negative regulation of cellular response to transforming growth factor beta stimulus(GO:1903845) |
| 0.0 | 0.0 | GO:2000286 | receptor internalization involved in canonical Wnt signaling pathway(GO:2000286) |
| 0.0 | 0.3 | GO:0050774 | negative regulation of dendrite morphogenesis(GO:0050774) |
| 0.0 | 0.2 | GO:0061436 | establishment of skin barrier(GO:0061436) |
| 0.0 | 0.3 | GO:0035094 | response to nicotine(GO:0035094) |
| 0.0 | 0.5 | GO:0034063 | stress granule assembly(GO:0034063) |
| 0.0 | 0.3 | GO:0048172 | regulation of short-term neuronal synaptic plasticity(GO:0048172) |
| 0.0 | 0.3 | GO:0032780 | negative regulation of ATPase activity(GO:0032780) |
| 0.0 | 0.1 | GO:0042985 | negative regulation of amyloid precursor protein biosynthetic process(GO:0042985) |
| 0.0 | 0.1 | GO:0046381 | CMP-N-acetylneuraminate metabolic process(GO:0046381) |
| 0.0 | 1.7 | GO:0031638 | zymogen activation(GO:0031638) |
| 0.0 | 1.1 | GO:0045773 | positive regulation of axon extension(GO:0045773) |
| 0.0 | 1.2 | GO:0046785 | microtubule polymerization(GO:0046785) |
| 0.0 | 0.2 | GO:1901223 | negative regulation of NIK/NF-kappaB signaling(GO:1901223) |
| 0.0 | 0.2 | GO:1904587 | glycoprotein ERAD pathway(GO:0097466) response to glycoprotein(GO:1904587) |
| 0.0 | 0.2 | GO:0032463 | negative regulation of protein homooligomerization(GO:0032463) |
| 0.0 | 0.2 | GO:2000465 | regulation of glycogen (starch) synthase activity(GO:2000465) |
| 0.0 | 0.6 | GO:0030835 | negative regulation of actin filament depolymerization(GO:0030835) |
| 0.0 | 0.3 | GO:0009191 | ribonucleoside diphosphate catabolic process(GO:0009191) |
| 0.0 | 0.2 | GO:0021670 | lateral ventricle development(GO:0021670) |
| 0.0 | 0.4 | GO:0070979 | protein K11-linked ubiquitination(GO:0070979) |
| 0.0 | 0.5 | GO:0045668 | negative regulation of osteoblast differentiation(GO:0045668) |
| 0.0 | 0.3 | GO:0000028 | ribosomal small subunit assembly(GO:0000028) |
| 0.0 | 0.4 | GO:0007064 | mitotic sister chromatid cohesion(GO:0007064) |
| 0.0 | 0.3 | GO:0048026 | positive regulation of mRNA splicing, via spliceosome(GO:0048026) |
| 0.0 | 0.4 | GO:0007214 | gamma-aminobutyric acid signaling pathway(GO:0007214) |
| 0.0 | 0.4 | GO:0001782 | B cell homeostasis(GO:0001782) |
| 0.0 | 0.3 | GO:0071353 | cellular response to interleukin-4(GO:0071353) |
| 0.0 | 0.2 | GO:0010667 | negative regulation of cardiac muscle cell apoptotic process(GO:0010667) |
| 0.0 | 0.1 | GO:1902260 | negative regulation of delayed rectifier potassium channel activity(GO:1902260) negative regulation of voltage-gated potassium channel activity(GO:1903817) |
| 0.0 | 0.5 | GO:0019933 | cAMP-mediated signaling(GO:0019933) |
| 0.0 | 0.2 | GO:2000651 | positive regulation of sodium ion transmembrane transporter activity(GO:2000651) |
| 0.0 | 0.0 | GO:0003100 | regulation of systemic arterial blood pressure by endothelin(GO:0003100) |
| 0.0 | 0.4 | GO:2001222 | regulation of neuron migration(GO:2001222) |
| 0.0 | 0.6 | GO:0007200 | phospholipase C-activating G-protein coupled receptor signaling pathway(GO:0007200) |
| 0.0 | 0.0 | GO:0046341 | CDP-diacylglycerol metabolic process(GO:0046341) |
| 0.0 | 0.4 | GO:0031648 | protein destabilization(GO:0031648) |
| 0.0 | 0.0 | GO:0060743 | epithelial cell maturation involved in prostate gland development(GO:0060743) |
| 0.0 | 0.6 | GO:0061077 | chaperone-mediated protein folding(GO:0061077) |
| 0.0 | 2.9 | GO:0051260 | protein homooligomerization(GO:0051260) |
| 0.0 | 0.9 | GO:0010951 | negative regulation of endopeptidase activity(GO:0010951) |
| 0.0 | 1.2 | GO:0010921 | regulation of phosphatase activity(GO:0010921) |
| 0.0 | 0.1 | GO:0070296 | sarcoplasmic reticulum calcium ion transport(GO:0070296) |
| 0.0 | 0.2 | GO:0090280 | positive regulation of calcium ion import(GO:0090280) |
| 0.0 | 0.1 | GO:0002031 | G-protein coupled receptor internalization(GO:0002031) |
| 0.0 | 0.3 | GO:0045214 | sarcomere organization(GO:0045214) |
| 0.0 | 0.5 | GO:0032418 | lysosome localization(GO:0032418) |
Gene overrepresentation in cellular_component category:
| Log-likelihood per target | Total log-likelihood | Term | Description |
|---|---|---|---|
| 0.5 | 1.5 | GO:0031021 | interphase microtubule organizing center(GO:0031021) |
| 0.3 | 0.8 | GO:0005940 | septin ring(GO:0005940) |
| 0.3 | 1.0 | GO:0017071 | intracellular cyclic nucleotide activated cation channel complex(GO:0017071) |
| 0.2 | 1.4 | GO:0033116 | endoplasmic reticulum-Golgi intermediate compartment membrane(GO:0033116) |
| 0.2 | 0.6 | GO:0016533 | cyclin-dependent protein kinase 5 holoenzyme complex(GO:0016533) |
| 0.2 | 0.4 | GO:0005816 | spindle pole body(GO:0005816) |
| 0.2 | 1.7 | GO:0005862 | muscle thin filament tropomyosin(GO:0005862) |
| 0.2 | 0.6 | GO:0044614 | nuclear pore cytoplasmic filaments(GO:0044614) |
| 0.1 | 0.4 | GO:0032437 | cuticular plate(GO:0032437) |
| 0.1 | 1.3 | GO:0043083 | synaptic cleft(GO:0043083) |
| 0.1 | 0.7 | GO:0005890 | sodium:potassium-exchanging ATPase complex(GO:0005890) |
| 0.1 | 0.9 | GO:0030478 | actin cap(GO:0030478) |
| 0.1 | 0.8 | GO:0001520 | outer dense fiber(GO:0001520) |
| 0.1 | 0.6 | GO:0097452 | GAIT complex(GO:0097452) |
| 0.1 | 0.5 | GO:0071817 | MMXD complex(GO:0071817) |
| 0.1 | 0.4 | GO:0005955 | calcineurin complex(GO:0005955) |
| 0.1 | 0.9 | GO:0045095 | keratin filament(GO:0045095) |
| 0.1 | 1.1 | GO:0016327 | apicolateral plasma membrane(GO:0016327) |
| 0.1 | 0.7 | GO:0034663 | endoplasmic reticulum chaperone complex(GO:0034663) |
| 0.1 | 0.3 | GO:0048787 | presynaptic active zone membrane(GO:0048787) |
| 0.0 | 0.7 | GO:0032420 | stereocilium(GO:0032420) |
| 0.0 | 0.2 | GO:1990357 | terminal web(GO:1990357) |
| 0.0 | 0.2 | GO:0090498 | extrinsic component of Golgi membrane(GO:0090498) |
| 0.0 | 0.1 | GO:0005658 | alpha DNA polymerase:primase complex(GO:0005658) |
| 0.0 | 0.3 | GO:0045298 | tubulin complex(GO:0045298) |
| 0.0 | 0.2 | GO:0034750 | Scrib-APC-beta-catenin complex(GO:0034750) |
| 0.0 | 0.4 | GO:0034706 | voltage-gated sodium channel complex(GO:0001518) sodium channel complex(GO:0034706) |
| 0.0 | 0.4 | GO:1902710 | GABA receptor complex(GO:1902710) GABA-A receptor complex(GO:1902711) |
| 0.0 | 0.2 | GO:0016281 | eukaryotic translation initiation factor 4F complex(GO:0016281) |
| 0.0 | 0.1 | GO:0005588 | collagen type V trimer(GO:0005588) |
| 0.0 | 0.7 | GO:0000314 | organellar small ribosomal subunit(GO:0000314) mitochondrial small ribosomal subunit(GO:0005763) |
| 0.0 | 0.2 | GO:0000276 | mitochondrial proton-transporting ATP synthase complex, coupling factor F(o)(GO:0000276) |
| 0.0 | 0.5 | GO:0042470 | melanosome(GO:0042470) pigment granule(GO:0048770) |
| 0.0 | 0.3 | GO:0043034 | costamere(GO:0043034) |
| 0.0 | 1.5 | GO:0008076 | voltage-gated potassium channel complex(GO:0008076) |
| 0.0 | 0.7 | GO:0032809 | neuronal cell body membrane(GO:0032809) |
| 0.0 | 0.2 | GO:0061617 | MICOS complex(GO:0061617) |
| 0.0 | 0.7 | GO:0030672 | synaptic vesicle membrane(GO:0030672) exocytic vesicle membrane(GO:0099501) |
| 0.0 | 0.1 | GO:0070695 | FHF complex(GO:0070695) |
| 0.0 | 0.2 | GO:0044322 | endoplasmic reticulum quality control compartment(GO:0044322) |
| 0.0 | 0.3 | GO:0032281 | AMPA glutamate receptor complex(GO:0032281) |
| 0.0 | 0.1 | GO:0031235 | intrinsic component of the cytoplasmic side of the plasma membrane(GO:0031235) |
| 0.0 | 0.1 | GO:0005641 | nuclear envelope lumen(GO:0005641) |
| 0.0 | 0.9 | GO:0030864 | cortical actin cytoskeleton(GO:0030864) |
| 0.0 | 0.7 | GO:0016328 | lateral plasma membrane(GO:0016328) |
| 0.0 | 0.5 | GO:0001772 | immunological synapse(GO:0001772) |
| 0.0 | 0.7 | GO:0000791 | euchromatin(GO:0000791) |
| 0.0 | 1.3 | GO:0031225 | anchored component of membrane(GO:0031225) |
| 0.0 | 0.1 | GO:0097524 | sperm plasma membrane(GO:0097524) |
| 0.0 | 0.2 | GO:0005652 | nuclear lamina(GO:0005652) |
| 0.0 | 2.6 | GO:0045211 | postsynaptic membrane(GO:0045211) |
Gene overrepresentation in molecular_function category:
| Log-likelihood per target | Total log-likelihood | Term | Description |
|---|---|---|---|
| 0.9 | 2.6 | GO:0004647 | phosphoserine phosphatase activity(GO:0004647) |
| 0.2 | 0.7 | GO:0044729 | hemi-methylated DNA-binding(GO:0044729) |
| 0.2 | 1.0 | GO:0005052 | peroxisome matrix targeting signal-1 binding(GO:0005052) |
| 0.2 | 1.6 | GO:0031995 | insulin-like growth factor II binding(GO:0031995) |
| 0.2 | 0.5 | GO:0033829 | O-fucosylpeptide 3-beta-N-acetylglucosaminyltransferase activity(GO:0033829) |
| 0.2 | 0.7 | GO:0004096 | aminoacylase activity(GO:0004046) catalase activity(GO:0004096) |
| 0.2 | 0.5 | GO:0035605 | peptidyl-cysteine S-nitrosylase activity(GO:0035605) |
| 0.1 | 4.4 | GO:0005112 | Notch binding(GO:0005112) |
| 0.1 | 1.4 | GO:0070700 | BMP receptor binding(GO:0070700) |
| 0.1 | 1.2 | GO:0004865 | protein serine/threonine phosphatase inhibitor activity(GO:0004865) |
| 0.1 | 0.5 | GO:0031800 | type 3 metabotropic glutamate receptor binding(GO:0031800) |
| 0.1 | 0.7 | GO:0016813 | hydrolase activity, acting on carbon-nitrogen (but not peptide) bonds, in linear amidines(GO:0016813) |
| 0.1 | 1.9 | GO:0005078 | MAP-kinase scaffold activity(GO:0005078) |
| 0.1 | 0.1 | GO:0009019 | tRNA (guanine-N1-)-methyltransferase activity(GO:0009019) |
| 0.1 | 0.4 | GO:0035877 | death effector domain binding(GO:0035877) caspase binding(GO:0089720) |
| 0.1 | 1.2 | GO:0070097 | delta-catenin binding(GO:0070097) |
| 0.1 | 0.7 | GO:0048101 | calcium- and calmodulin-regulated 3',5'-cyclic-GMP phosphodiesterase activity(GO:0048101) |
| 0.1 | 0.5 | GO:0044020 | protein-arginine omega-N monomethyltransferase activity(GO:0035241) histone methyltransferase activity (H4-R3 specific)(GO:0044020) |
| 0.1 | 0.3 | GO:0005105 | type 1 fibroblast growth factor receptor binding(GO:0005105) |
| 0.1 | 0.9 | GO:0050072 | m7G(5')pppN diphosphatase activity(GO:0050072) |
| 0.1 | 1.2 | GO:0015197 | peptide transporter activity(GO:0015197) |
| 0.1 | 1.5 | GO:0005313 | L-glutamate transmembrane transporter activity(GO:0005313) |
| 0.1 | 2.3 | GO:0004708 | MAP kinase kinase activity(GO:0004708) |
| 0.1 | 0.7 | GO:0008556 | sodium:potassium-exchanging ATPase activity(GO:0005391) potassium-transporting ATPase activity(GO:0008556) |
| 0.1 | 0.4 | GO:0033192 | calcium-dependent protein serine/threonine phosphatase activity(GO:0004723) calmodulin-dependent protein phosphatase activity(GO:0033192) |
| 0.1 | 2.8 | GO:0008536 | Ran GTPase binding(GO:0008536) |
| 0.1 | 0.9 | GO:0008191 | metalloendopeptidase inhibitor activity(GO:0008191) |
| 0.1 | 0.2 | GO:0098809 | nitrite reductase activity(GO:0098809) |
| 0.1 | 0.7 | GO:0070181 | small ribosomal subunit rRNA binding(GO:0070181) |
| 0.1 | 0.3 | GO:0001640 | adenylate cyclase inhibiting G-protein coupled glutamate receptor activity(GO:0001640) |
| 0.1 | 0.3 | GO:0004839 | ubiquitin activating enzyme activity(GO:0004839) |
| 0.1 | 1.2 | GO:0005044 | scavenger receptor activity(GO:0005044) |
| 0.1 | 0.3 | GO:0005250 | A-type (transient outward) potassium channel activity(GO:0005250) |
| 0.1 | 0.7 | GO:0016868 | intramolecular transferase activity, phosphotransferases(GO:0016868) |
| 0.1 | 0.4 | GO:0086006 | voltage-gated sodium channel activity involved in cardiac muscle cell action potential(GO:0086006) |
| 0.1 | 0.3 | GO:0018121 | imidazoleglycerol-phosphate synthase activity(GO:0000107) NAD(P)-cysteine ADP-ribosyltransferase activity(GO:0018071) NAD(P)-asparagine ADP-ribosyltransferase activity(GO:0018121) NAD(P)-serine ADP-ribosyltransferase activity(GO:0018127) 7-cyano-7-deazaguanine tRNA-ribosyltransferase activity(GO:0043867) purine deoxyribosyltransferase activity(GO:0044102) |
| 0.1 | 0.2 | GO:2001069 | glycogen binding(GO:2001069) |
| 0.0 | 0.4 | GO:0055131 | C3HC4-type RING finger domain binding(GO:0055131) |
| 0.0 | 0.4 | GO:0051011 | microtubule minus-end binding(GO:0051011) |
| 0.0 | 0.2 | GO:0042731 | PH domain binding(GO:0042731) |
| 0.0 | 0.9 | GO:0003950 | NAD+ ADP-ribosyltransferase activity(GO:0003950) |
| 0.0 | 0.2 | GO:0004719 | protein-L-isoaspartate (D-aspartate) O-methyltransferase activity(GO:0004719) |
| 0.0 | 1.1 | GO:0005251 | delayed rectifier potassium channel activity(GO:0005251) |
| 0.0 | 1.8 | GO:0061631 | ubiquitin conjugating enzyme activity(GO:0061631) |
| 0.0 | 0.8 | GO:0035380 | C-3 sterol dehydrogenase (C-4 sterol decarboxylase) activity(GO:0000252) mevaldate reductase activity(GO:0004495) gluconate dehydrogenase activity(GO:0008875) epoxide dehydrogenase activity(GO:0018451) 5-exo-hydroxycamphor dehydrogenase activity(GO:0018452) 2-hydroxytetrahydrofuran dehydrogenase activity(GO:0018453) acetoin dehydrogenase activity(GO:0019152) phenylcoumaran benzylic ether reductase activity(GO:0032442) D-xylose:NADP reductase activity(GO:0032866) L-arabinose:NADP reductase activity(GO:0032867) D-arabinitol dehydrogenase, D-ribulose forming (NADP+) activity(GO:0033709) (R)-(-)-1,2,3,4-tetrahydronaphthol dehydrogenase activity(GO:0034831) 3-hydroxymenthone dehydrogenase activity(GO:0034840) very long-chain-3-hydroxyacyl-CoA dehydrogenase activity(GO:0035380) dihydrotestosterone 17-beta-dehydrogenase activity(GO:0035410) (R)-2-hydroxyisocaproate dehydrogenase activity(GO:0043713) L-arabinose 1-dehydrogenase (NADP+) activity(GO:0044103) L-xylulose reductase (NAD+) activity(GO:0044105) 3-ketoglucose-reductase activity(GO:0048258) D-arabinitol dehydrogenase, D-xylulose forming (NADP+) activity(GO:0052677) |
| 0.0 | 0.2 | GO:0001162 | RNA polymerase II intronic transcription regulatory region sequence-specific DNA binding(GO:0001162) |
| 0.0 | 0.3 | GO:0030550 | acetylcholine receptor inhibitor activity(GO:0030550) |
| 0.0 | 0.7 | GO:0042043 | neurexin family protein binding(GO:0042043) |
| 0.0 | 2.6 | GO:0005200 | structural constituent of cytoskeleton(GO:0005200) |
| 0.0 | 0.1 | GO:0016015 | morphogen activity(GO:0016015) |
| 0.0 | 1.4 | GO:0001965 | G-protein alpha-subunit binding(GO:0001965) |
| 0.0 | 0.6 | GO:0043539 | protein serine/threonine kinase activator activity(GO:0043539) |
| 0.0 | 1.5 | GO:0070888 | E-box binding(GO:0070888) |
| 0.0 | 0.3 | GO:0017169 | CDP-alcohol phosphatidyltransferase activity(GO:0017169) |
| 0.0 | 0.1 | GO:0008559 | xenobiotic-transporting ATPase activity(GO:0008559) |
| 0.0 | 0.6 | GO:0102391 | decanoate--CoA ligase activity(GO:0102391) |
| 0.0 | 0.8 | GO:0035259 | glucocorticoid receptor binding(GO:0035259) |
| 0.0 | 0.7 | GO:0051787 | misfolded protein binding(GO:0051787) |
| 0.0 | 1.1 | GO:0035035 | histone acetyltransferase binding(GO:0035035) |
| 0.0 | 0.2 | GO:0017040 | ceramidase activity(GO:0017040) |
| 0.0 | 0.8 | GO:0034930 | N-acetylglucosamine 6-O-sulfotransferase activity(GO:0001517) heparan sulfate 2-O-sulfotransferase activity(GO:0004394) HNK-1 sulfotransferase activity(GO:0016232) heparan sulfate 6-O-sulfotransferase activity(GO:0017095) trans-9R,10R-dihydrodiolphenanthrene sulfotransferase activity(GO:0018721) 1-phenanthrol sulfotransferase activity(GO:0018722) 3-phenanthrol sulfotransferase activity(GO:0018723) 4-phenanthrol sulfotransferase activity(GO:0018724) trans-3,4-dihydrodiolphenanthrene sulfotransferase activity(GO:0018725) 9-phenanthrol sulfotransferase activity(GO:0018726) 2-phenanthrol sulfotransferase activity(GO:0018727) phenanthrol sulfotransferase activity(GO:0019111) 1-hydroxypyrene sulfotransferase activity(GO:0034930) proteoglycan sulfotransferase activity(GO:0050698) cholesterol sulfotransferase activity(GO:0051922) hydroxyjasmonate sulfotransferase activity(GO:0080131) |
| 0.0 | 0.1 | GO:0004127 | cytidylate kinase activity(GO:0004127) uridylate kinase activity(GO:0009041) |
| 0.0 | 0.6 | GO:0005528 | macrolide binding(GO:0005527) FK506 binding(GO:0005528) |
| 0.0 | 0.4 | GO:0004890 | GABA-A receptor activity(GO:0004890) |
| 0.0 | 0.4 | GO:0008599 | protein phosphatase type 1 regulator activity(GO:0008599) |
| 0.0 | 0.1 | GO:0016716 | oxidoreductase activity, acting on paired donors, with incorporation or reduction of molecular oxygen, another compound as one donor, and incorporation of one atom of oxygen(GO:0016716) |
| 0.0 | 4.2 | GO:0003924 | GTPase activity(GO:0003924) |
| 0.0 | 0.2 | GO:0038191 | neuropilin binding(GO:0038191) |
| 0.0 | 0.2 | GO:1990247 | N6-methyladenosine-containing RNA binding(GO:1990247) |
| 0.0 | 0.7 | GO:0045296 | cadherin binding(GO:0045296) |
| 0.0 | 0.5 | GO:0005070 | SH3/SH2 adaptor activity(GO:0005070) |
| 0.0 | 0.2 | GO:1990459 | transferrin receptor binding(GO:1990459) |
| 0.0 | 0.5 | GO:0034945 | dihydrolipoamide branched chain acyltransferase activity(GO:0004147) palmitoleoyl [acyl-carrier-protein]-dependent acyltransferase activity(GO:0008951) serine O-acyltransferase activity(GO:0016412) O-succinyltransferase activity(GO:0016750) sinapoyltransferase activity(GO:0016752) O-sinapoyltransferase activity(GO:0016753) peptidyl-lysine N6-myristoyltransferase activity(GO:0018030) peptidyl-lysine N6-palmitoyltransferase activity(GO:0018031) benzoyl acetate-CoA thiolase activity(GO:0018711) 3-hydroxybutyryl-CoA thiolase activity(GO:0018712) 3-ketopimelyl-CoA thiolase activity(GO:0018713) N-palmitoyltransferase activity(GO:0019105) acyl-CoA N-acyltransferase activity(GO:0019186) protein-cysteine S-myristoyltransferase activity(GO:0019705) glucosaminyl-phosphotidylinositol O-acyltransferase activity(GO:0032216) ergosterol O-acyltransferase activity(GO:0034737) lanosterol O-acyltransferase activity(GO:0034738) naphthyl-2-oxomethyl-succinyl-CoA succinyl transferase activity(GO:0034848) 2,4,4-trimethyl-3-oxopentanoyl-CoA 2-C-propanoyl transferase activity(GO:0034851) 2-methylhexanoyl-CoA C-acetyltransferase activity(GO:0034915) butyryl-CoA 2-C-propionyltransferase activity(GO:0034919) 2,6-dimethyl-5-methylene-3-oxo-heptanoyl-CoA C-acetyltransferase activity(GO:0034945) L-2-aminoadipate N-acetyltransferase activity(GO:0043741) keto acid formate lyase activity(GO:0043806) azetidine-2-carboxylic acid acetyltransferase activity(GO:0046941) peptidyl-lysine N-acetyltransferase activity, acting on acetyl phosphate as donor(GO:0052858) acetyl-CoA:L-lysine N6-acetyltransferase(GO:0090595) |
| 0.0 | 0.5 | GO:0017091 | AU-rich element binding(GO:0017091) |
| 0.0 | 0.2 | GO:0070569 | uridylyltransferase activity(GO:0070569) |
| 0.0 | 0.0 | GO:0019966 | interleukin-1 binding(GO:0019966) |
| 0.0 | 0.2 | GO:1904264 | ubiquitin protein ligase activity involved in ERAD pathway(GO:1904264) |
| 0.0 | 0.1 | GO:0004030 | aldehyde dehydrogenase [NAD(P)+] activity(GO:0004030) |
| 0.0 | 0.1 | GO:0002135 | CTP binding(GO:0002135) |
| 0.0 | 1.4 | GO:0005089 | Rho guanyl-nucleotide exchange factor activity(GO:0005089) |
| 0.0 | 0.4 | GO:0043027 | cysteine-type endopeptidase inhibitor activity involved in apoptotic process(GO:0043027) |
| 0.0 | 4.4 | GO:0000982 | transcription factor activity, RNA polymerase II core promoter proximal region sequence-specific binding(GO:0000982) |
| 0.0 | 0.1 | GO:0099604 | calcium-release channel activity(GO:0015278) ligand-gated calcium channel activity(GO:0099604) |
| 0.0 | 0.1 | GO:0005161 | platelet-derived growth factor receptor binding(GO:0005161) |
| 0.0 | 0.2 | GO:0008146 | sulfotransferase activity(GO:0008146) |
| 0.0 | 1.0 | GO:0000987 | core promoter proximal region sequence-specific DNA binding(GO:0000987) |
| 0.0 | 0.2 | GO:0030275 | LRR domain binding(GO:0030275) |
| 0.0 | 0.8 | GO:0002039 | p53 binding(GO:0002039) |
| 0.0 | 4.1 | GO:0003779 | actin binding(GO:0003779) |
| 0.0 | 0.8 | GO:0008081 | phosphoric diester hydrolase activity(GO:0008081) |
| 0.0 | 0.1 | GO:0016805 | dipeptidase activity(GO:0016805) |