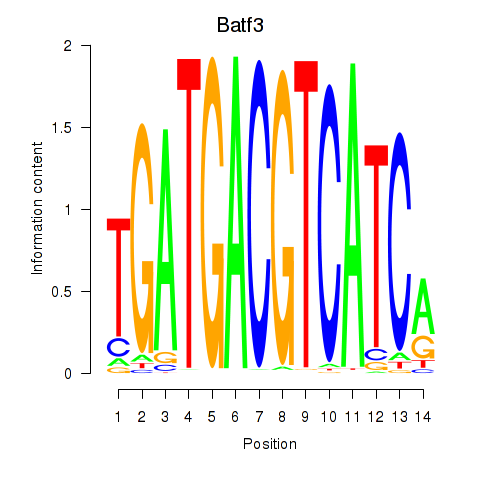
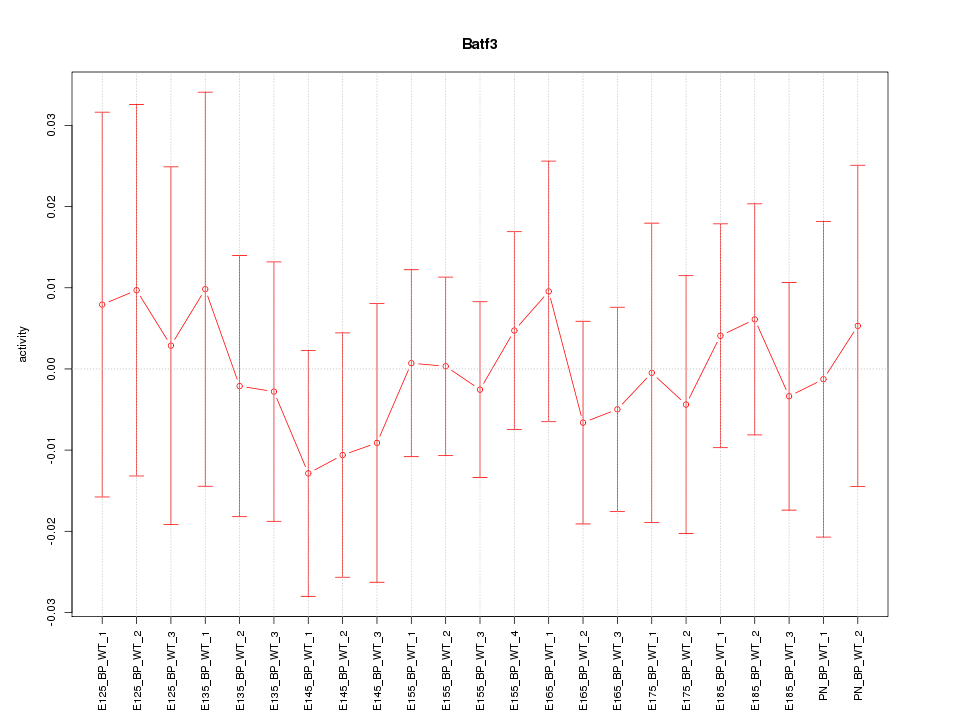
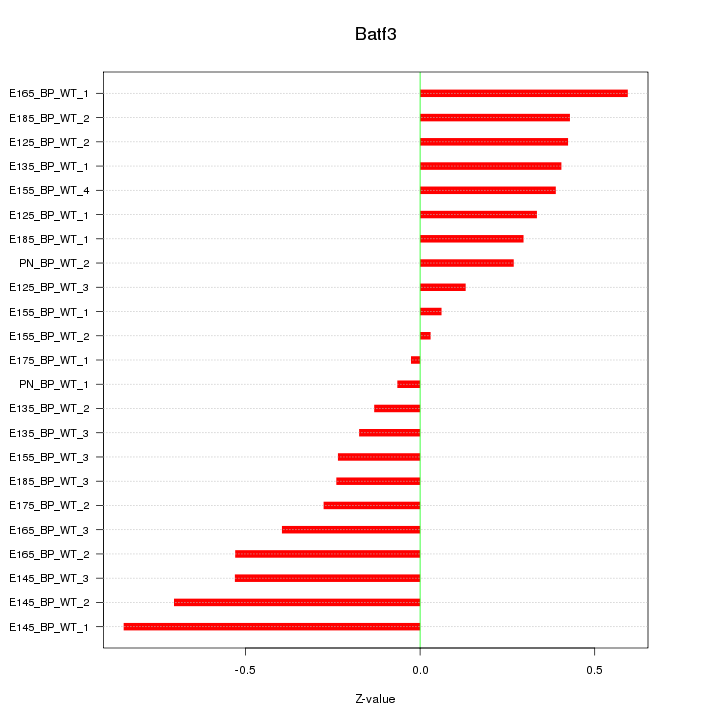
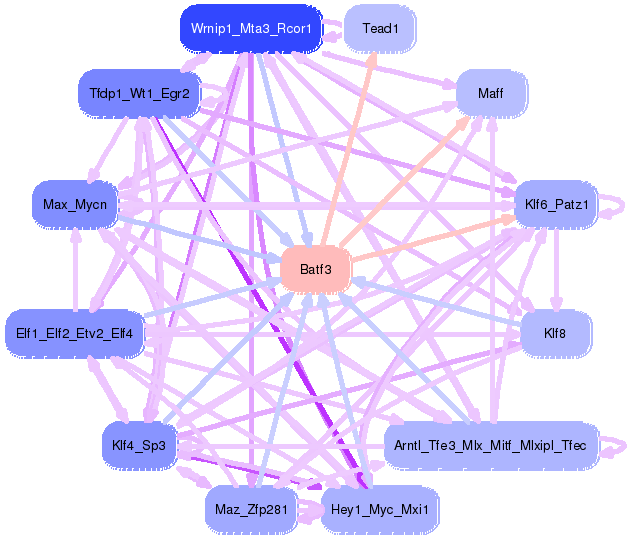
Motif ID: Batf3
Z-value: 0.390
Transcription factors associated with Batf3:
| Gene Symbol | Entrez ID | Gene Name |
|---|---|---|
| Batf3 | ENSMUSG00000026630.4 | Batf3 |
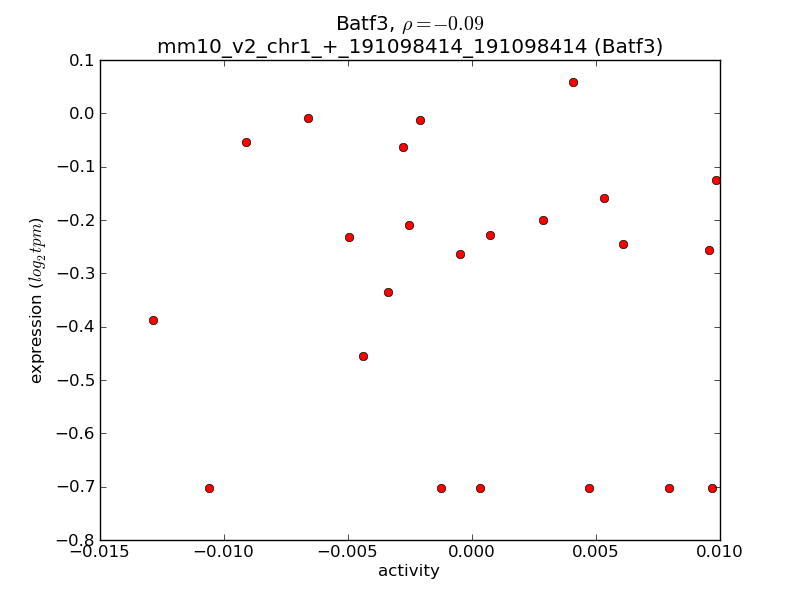
Activity-expression correlation:
| Gene Symbol | Promoter | Pearson corr. coef. | P-value | Plot |
|---|---|---|---|---|
| Batf3 | mm10_v2_chr1_+_191098414_191098414 | -0.09 | 6.8e-01 | Click! |

Top targets:
Gene overrepresentation in biological_process category:
| Log-likelihood per target | Total log-likelihood | Term | Description |
|---|---|---|---|
| 0.3 | 1.6 | GO:0021797 | forebrain anterior/posterior pattern specification(GO:0021797) |
| 0.2 | 0.5 | GO:0032918 | polyamine acetylation(GO:0032917) spermidine acetylation(GO:0032918) |
| 0.1 | 0.6 | GO:0051315 | attachment of mitotic spindle microtubules to kinetochore(GO:0051315) |
| 0.1 | 0.5 | GO:0046601 | positive regulation of centriole replication(GO:0046601) |
| 0.1 | 0.5 | GO:0090074 | negative regulation of protein homodimerization activity(GO:0090074) |
| 0.1 | 0.7 | GO:0042487 | regulation of odontogenesis of dentin-containing tooth(GO:0042487) |
| 0.1 | 0.2 | GO:0070649 | formin-nucleated actin cable assembly(GO:0070649) |
| 0.1 | 0.2 | GO:2000271 | positive regulation of fibroblast apoptotic process(GO:2000271) |
| 0.1 | 0.2 | GO:0035973 | aggrephagy(GO:0035973) |
| 0.0 | 0.4 | GO:0002318 | myeloid progenitor cell differentiation(GO:0002318) |
| 0.0 | 0.7 | GO:0072520 | seminiferous tubule development(GO:0072520) |
| 0.0 | 0.3 | GO:0044829 | positive regulation by host of viral genome replication(GO:0044829) |
| 0.0 | 0.1 | GO:0014028 | notochord formation(GO:0014028) axial mesoderm morphogenesis(GO:0048319) |
| 0.0 | 0.1 | GO:2000686 | regulation of rubidium ion transmembrane transporter activity(GO:2000686) |
| 0.0 | 0.1 | GO:0097089 | methyl-branched fatty acid metabolic process(GO:0097089) |
| 0.0 | 0.2 | GO:0006824 | cobalt ion transport(GO:0006824) |
| 0.0 | 0.1 | GO:0014883 | transition between fast and slow fiber(GO:0014883) positive regulation of stem cell population maintenance(GO:1902459) |
| 0.0 | 0.1 | GO:0042045 | epithelial fluid transport(GO:0042045) |
| 0.0 | 0.4 | GO:0003333 | amino acid transmembrane transport(GO:0003333) |
| 0.0 | 0.0 | GO:0035021 | negative regulation of Rac protein signal transduction(GO:0035021) glutamate secretion, neurotransmission(GO:0061535) |
Gene overrepresentation in cellular_component category:
| Log-likelihood per target | Total log-likelihood | Term | Description |
|---|---|---|---|
| 0.1 | 1.3 | GO:1990023 | mitotic spindle midzone(GO:1990023) |
| 0.1 | 0.5 | GO:0098536 | deuterosome(GO:0098536) |
| 0.1 | 0.2 | GO:0034274 | Atg12-Atg5-Atg16 complex(GO:0034274) |
| 0.0 | 0.3 | GO:0070652 | HAUS complex(GO:0070652) |
| 0.0 | 0.5 | GO:0000159 | protein phosphatase type 2A complex(GO:0000159) |
| 0.0 | 0.2 | GO:0072546 | ER membrane protein complex(GO:0072546) |
| 0.0 | 0.1 | GO:0030008 | TRAPP complex(GO:0030008) |
Gene overrepresentation in molecular_function category:
| Log-likelihood per target | Total log-likelihood | Term | Description |
|---|---|---|---|
| 0.2 | 0.5 | GO:0004145 | diamine N-acetyltransferase activity(GO:0004145) |
| 0.1 | 0.6 | GO:0043515 | kinetochore binding(GO:0043515) |
| 0.1 | 0.2 | GO:0019776 | Atg8 ligase activity(GO:0019776) |
| 0.1 | 0.7 | GO:0051010 | microtubule plus-end binding(GO:0051010) |
| 0.0 | 0.5 | GO:0048273 | mitogen-activated protein kinase p38 binding(GO:0048273) |
| 0.0 | 0.5 | GO:0008601 | protein phosphatase type 2A regulator activity(GO:0008601) |
| 0.0 | 0.3 | GO:1990247 | N6-methyladenosine-containing RNA binding(GO:1990247) |
| 0.0 | 0.2 | GO:0015087 | cobalt ion transmembrane transporter activity(GO:0015087) |
| 0.0 | 0.7 | GO:0005109 | frizzled binding(GO:0005109) |
| 0.0 | 0.1 | GO:0005093 | Rab GDP-dissociation inhibitor activity(GO:0005093) |
| 0.0 | 0.1 | GO:0004013 | adenosylhomocysteinase activity(GO:0004013) trialkylsulfonium hydrolase activity(GO:0016802) |