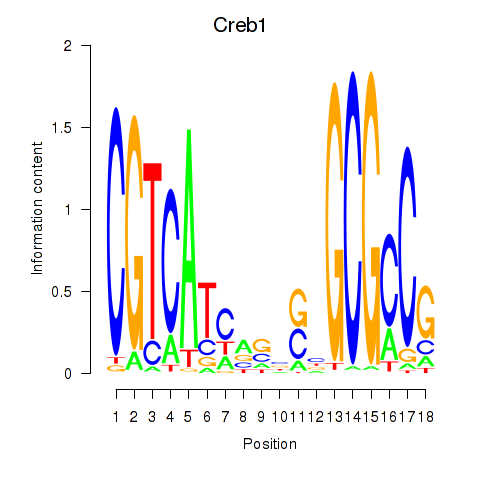
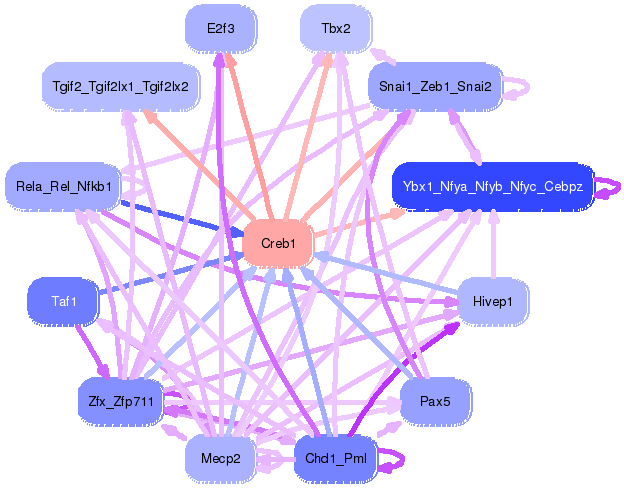
Motif ID: Creb1
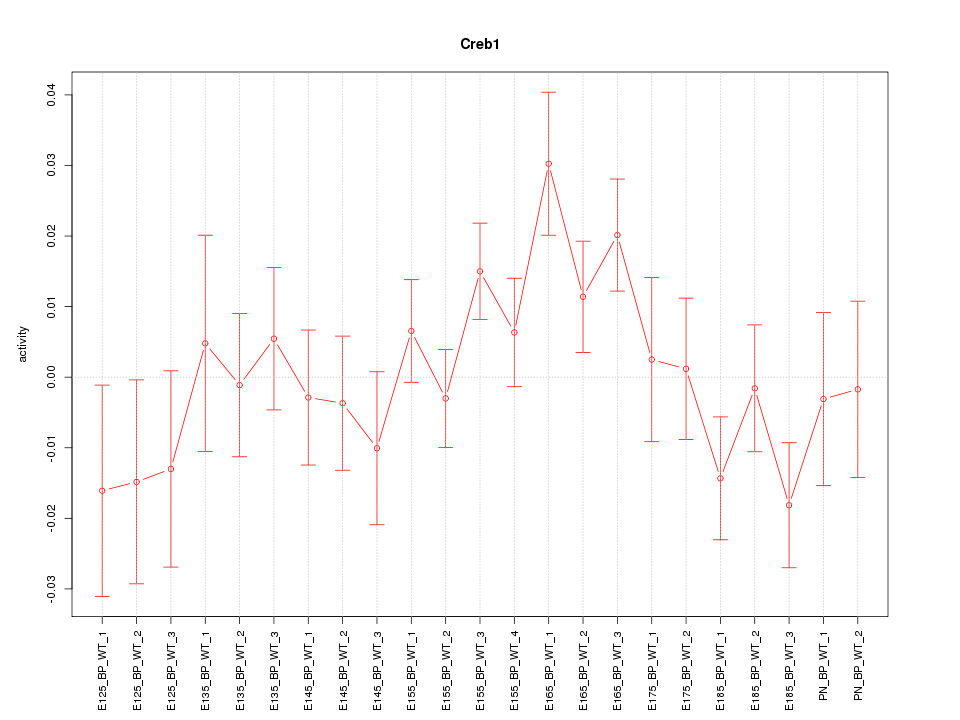
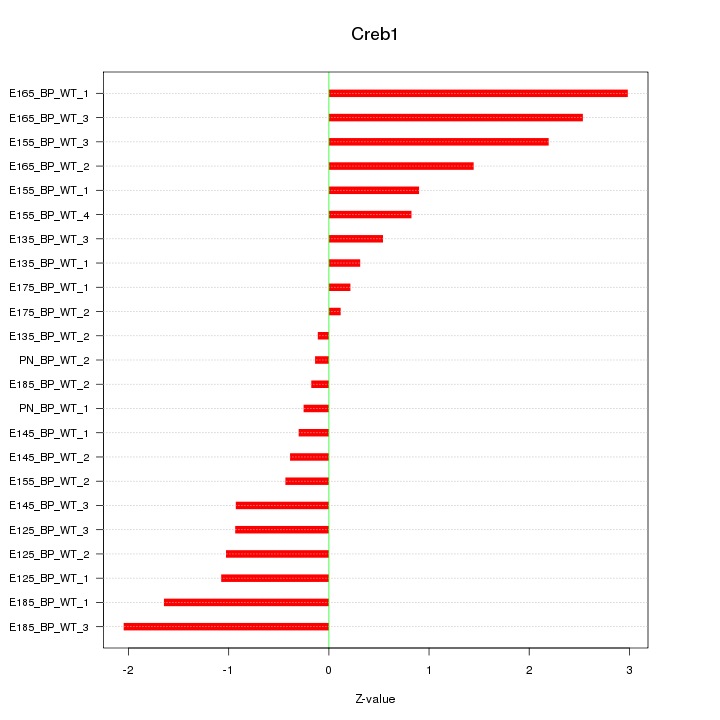
Z-value: 1.244
Transcription factors associated with Creb1:
| Gene Symbol | Entrez ID | Gene Name |
|---|---|---|
| Creb1 | ENSMUSG00000025958.8 | Creb1 |
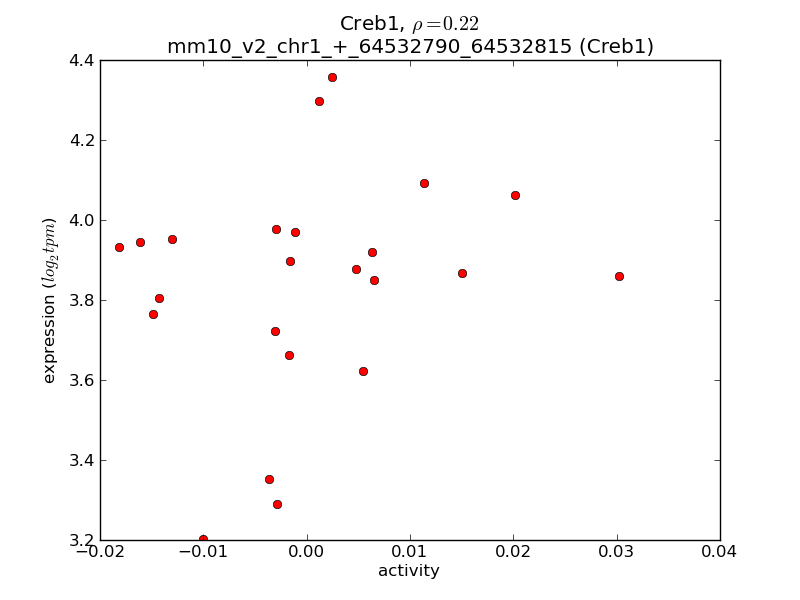
Activity-expression correlation:
| Gene Symbol | Promoter | Pearson corr. coef. | P-value | Plot |
|---|---|---|---|---|
| Creb1 | mm10_v2_chr1_+_64532790_64532815 | 0.22 | 3.1e-01 | Click! |

Top targets:
Gene overrepresentation in biological_process category:
| Log-likelihood per target | Total log-likelihood | Term | Description |
|---|---|---|---|
| 0.5 | 1.8 | GO:1904565 | response to 1-oleoyl-sn-glycerol 3-phosphate(GO:1904565) cellular response to 1-oleoyl-sn-glycerol 3-phosphate(GO:1904566) |
| 0.4 | 0.4 | GO:0032240 | negative regulation of nucleobase-containing compound transport(GO:0032240) negative regulation of RNA export from nucleus(GO:0046832) |
| 0.4 | 1.1 | GO:0097309 | cap1 mRNA methylation(GO:0097309) |
| 0.3 | 1.2 | GO:2000525 | regulation of T cell costimulation(GO:2000523) positive regulation of T cell costimulation(GO:2000525) |
| 0.3 | 3.4 | GO:0031468 | nuclear envelope reassembly(GO:0031468) |
| 0.3 | 0.8 | GO:0019482 | beta-alanine metabolic process(GO:0019482) |
| 0.2 | 0.7 | GO:1903225 | negative regulation of endodermal cell differentiation(GO:1903225) |
| 0.2 | 0.7 | GO:0035621 | ER to Golgi ceramide transport(GO:0035621) ceramide transport(GO:0035627) |
| 0.2 | 1.0 | GO:0070345 | negative regulation of fat cell proliferation(GO:0070345) |
| 0.2 | 0.6 | GO:0070428 | granuloma formation(GO:0002432) toll-like receptor 5 signaling pathway(GO:0034146) regulation of nucleotide-binding oligomerization domain containing 1 signaling pathway(GO:0070428) |
| 0.2 | 0.6 | GO:1901420 | negative regulation of response to alcohol(GO:1901420) |
| 0.2 | 0.9 | GO:0070236 | negative regulation of activation-induced cell death of T cells(GO:0070236) |
| 0.2 | 0.5 | GO:0010751 | regulation of arginine metabolic process(GO:0000821) negative regulation of nitric oxide mediated signal transduction(GO:0010751) negative regulation of cellular amino acid metabolic process(GO:0045763) |
| 0.2 | 0.5 | GO:0046166 | glyceraldehyde-3-phosphate biosynthetic process(GO:0046166) |
| 0.2 | 0.5 | GO:0006667 | sphinganine metabolic process(GO:0006667) |
| 0.2 | 0.5 | GO:0007521 | muscle cell fate determination(GO:0007521) mammary placode formation(GO:0060596) |
| 0.1 | 0.4 | GO:1903774 | positive regulation of viral budding via host ESCRT complex(GO:1903774) |
| 0.1 | 0.5 | GO:0010847 | regulation of chromatin assembly(GO:0010847) |
| 0.1 | 0.4 | GO:0046836 | glycolipid transport(GO:0046836) |
| 0.1 | 0.3 | GO:1903722 | regulation of centriole elongation(GO:1903722) |
| 0.1 | 0.4 | GO:0039521 | suppression by virus of host autophagy(GO:0039521) negative regulation of sphingolipid biosynthesis involved in cellular sphingolipid homeostasis(GO:0090157) |
| 0.1 | 0.3 | GO:0036092 | phosphatidylinositol-3-phosphate biosynthetic process(GO:0036092) |
| 0.1 | 0.3 | GO:0072554 | arterial endothelial cell fate commitment(GO:0060844) blood vessel endothelial cell fate commitment(GO:0060846) endothelial cell fate specification(GO:0060847) Notch signaling pathway involved in arterial endothelial cell fate commitment(GO:0060853) blood vessel lumenization(GO:0072554) blood vessel endothelial cell fate specification(GO:0097101) regulation of canonical Wnt signaling pathway involved in cardiac muscle cell fate commitment(GO:1901295) positive regulation of heart induction(GO:1901321) regulation of canonical Wnt signaling pathway involved in heart development(GO:1905066) |
| 0.1 | 0.3 | GO:1901856 | negative regulation of cellular respiration(GO:1901856) |
| 0.1 | 0.4 | GO:0002949 | tRNA threonylcarbamoyladenosine modification(GO:0002949) |
| 0.1 | 0.4 | GO:0007352 | zygotic specification of dorsal/ventral axis(GO:0007352) regulation of nodal signaling pathway involved in determination of left/right asymmetry(GO:1900145) regulation of nodal signaling pathway involved in determination of lateral mesoderm left/right asymmetry(GO:1900175) positive regulation of nodal signaling pathway involved in determination of lateral mesoderm left/right asymmetry(GO:1900224) |
| 0.1 | 0.6 | GO:0051004 | plasma membrane to endosome transport(GO:0048227) regulation of lipoprotein lipase activity(GO:0051004) |
| 0.1 | 0.3 | GO:1904742 | regulation of telomeric DNA binding(GO:1904742) |
| 0.1 | 0.2 | GO:0071947 | protein deubiquitination involved in ubiquitin-dependent protein catabolic process(GO:0071947) |
| 0.1 | 0.2 | GO:0015014 | heparan sulfate proteoglycan biosynthetic process, polysaccharide chain biosynthetic process(GO:0015014) |
| 0.1 | 0.4 | GO:0000480 | endonucleolytic cleavage in 5'-ETS of tricistronic rRNA transcript (SSU-rRNA, 5.8S rRNA, LSU-rRNA)(GO:0000480) |
| 0.1 | 0.2 | GO:0048208 | vesicle targeting, rough ER to cis-Golgi(GO:0048207) COPII vesicle coating(GO:0048208) |
| 0.1 | 0.4 | GO:0035234 | ectopic germ cell programmed cell death(GO:0035234) |
| 0.1 | 0.6 | GO:0034134 | toll-like receptor 2 signaling pathway(GO:0034134) negative regulation of cholesterol efflux(GO:0090370) |
| 0.1 | 0.9 | GO:0034773 | histone H4-K20 trimethylation(GO:0034773) |
| 0.1 | 0.5 | GO:1902035 | positive regulation of hematopoietic stem cell proliferation(GO:1902035) |
| 0.1 | 0.5 | GO:0051461 | regulation of corticotropin secretion(GO:0051459) positive regulation of corticotropin secretion(GO:0051461) |
| 0.1 | 0.3 | GO:0072365 | regulation of cellular ketone metabolic process by negative regulation of transcription from RNA polymerase II promoter(GO:0072365) |
| 0.1 | 0.5 | GO:0036265 | RNA (guanine-N7)-methylation(GO:0036265) |
| 0.1 | 0.2 | GO:0039530 | MDA-5 signaling pathway(GO:0039530) |
| 0.1 | 0.3 | GO:0006189 | 'de novo' IMP biosynthetic process(GO:0006189) |
| 0.1 | 0.3 | GO:0035878 | nail development(GO:0035878) |
| 0.1 | 0.3 | GO:1901491 | negative regulation of lymphangiogenesis(GO:1901491) |
| 0.1 | 0.3 | GO:0051311 | meiotic metaphase plate congression(GO:0051311) |
| 0.1 | 0.4 | GO:0042045 | epithelial fluid transport(GO:0042045) |
| 0.1 | 0.6 | GO:1904153 | negative regulation of protein exit from endoplasmic reticulum(GO:0070862) negative regulation of retrograde protein transport, ER to cytosol(GO:1904153) |
| 0.1 | 0.2 | GO:1902953 | positive regulation of ER to Golgi vesicle-mediated transport(GO:1902953) |
| 0.1 | 0.5 | GO:0090074 | negative regulation of protein homodimerization activity(GO:0090074) |
| 0.1 | 0.3 | GO:0034227 | tRNA thio-modification(GO:0034227) |
| 0.1 | 0.8 | GO:0016558 | protein import into peroxisome matrix(GO:0016558) |
| 0.1 | 0.4 | GO:0045078 | positive regulation of interferon-gamma biosynthetic process(GO:0045078) |
| 0.1 | 0.4 | GO:0008616 | queuosine biosynthetic process(GO:0008616) queuosine metabolic process(GO:0046116) |
| 0.1 | 0.2 | GO:1904569 | regulation of selenocysteine incorporation(GO:1904569) |
| 0.1 | 0.2 | GO:0045041 | protein import into mitochondrial intermembrane space(GO:0045041) |
| 0.1 | 0.2 | GO:0015886 | heme transport(GO:0015886) |
| 0.1 | 0.2 | GO:1900864 | mitochondrial tRNA modification(GO:0070900) mitochondrial RNA modification(GO:1900864) |
| 0.0 | 0.2 | GO:0033540 | fatty acid beta-oxidation using acyl-CoA oxidase(GO:0033540) |
| 0.0 | 0.3 | GO:0070072 | vacuolar proton-transporting V-type ATPase complex assembly(GO:0070072) |
| 0.0 | 0.5 | GO:0090385 | phagosome-lysosome fusion(GO:0090385) |
| 0.0 | 0.1 | GO:1903896 | positive regulation of IRE1-mediated unfolded protein response(GO:1903896) |
| 0.0 | 0.6 | GO:0032211 | negative regulation of telomere maintenance via telomerase(GO:0032211) |
| 0.0 | 0.5 | GO:0090557 | establishment of endothelial intestinal barrier(GO:0090557) |
| 0.0 | 0.5 | GO:0000012 | single strand break repair(GO:0000012) |
| 0.0 | 0.2 | GO:0048312 | intracellular distribution of mitochondria(GO:0048312) |
| 0.0 | 0.7 | GO:0038092 | nodal signaling pathway(GO:0038092) |
| 0.0 | 0.1 | GO:0032474 | otolith morphogenesis(GO:0032474) |
| 0.0 | 0.3 | GO:0035845 | photoreceptor cell outer segment organization(GO:0035845) |
| 0.0 | 0.2 | GO:0061084 | negative regulation of protein refolding(GO:0061084) |
| 0.0 | 0.2 | GO:0006071 | glycerol metabolic process(GO:0006071) |
| 0.0 | 0.7 | GO:0032981 | NADH dehydrogenase complex assembly(GO:0010257) mitochondrial respiratory chain complex I assembly(GO:0032981) mitochondrial respiratory chain complex I biogenesis(GO:0097031) |
| 0.0 | 0.6 | GO:0034389 | lipid particle organization(GO:0034389) |
| 0.0 | 0.2 | GO:0060011 | Sertoli cell proliferation(GO:0060011) |
| 0.0 | 0.2 | GO:0040038 | polar body extrusion after meiotic divisions(GO:0040038) |
| 0.0 | 0.3 | GO:1902902 | negative regulation of autophagosome assembly(GO:1902902) |
| 0.0 | 0.5 | GO:0072600 | establishment of protein localization to Golgi(GO:0072600) |
| 0.0 | 0.2 | GO:0051661 | maintenance of centrosome location(GO:0051661) maintenance of Golgi location(GO:0051684) |
| 0.0 | 0.3 | GO:0019368 | fatty acid elongation, saturated fatty acid(GO:0019367) fatty acid elongation, unsaturated fatty acid(GO:0019368) fatty acid elongation, monounsaturated fatty acid(GO:0034625) fatty acid elongation, polyunsaturated fatty acid(GO:0034626) |
| 0.0 | 0.3 | GO:0042989 | sequestering of actin monomers(GO:0042989) |
| 0.0 | 0.2 | GO:0060158 | phospholipase C-activating dopamine receptor signaling pathway(GO:0060158) |
| 0.0 | 0.2 | GO:0016127 | cholesterol catabolic process(GO:0006707) sterol catabolic process(GO:0016127) |
| 0.0 | 0.3 | GO:0006622 | protein targeting to lysosome(GO:0006622) |
| 0.0 | 0.1 | GO:0035984 | response to trichostatin A(GO:0035983) cellular response to trichostatin A(GO:0035984) |
| 0.0 | 1.4 | GO:0043038 | amino acid activation(GO:0043038) tRNA aminoacylation(GO:0043039) |
| 0.0 | 0.4 | GO:0060712 | spongiotrophoblast layer development(GO:0060712) |
| 0.0 | 0.5 | GO:2000001 | regulation of DNA damage checkpoint(GO:2000001) |
| 0.0 | 0.4 | GO:0034643 | establishment of mitochondrion localization, microtubule-mediated(GO:0034643) mitochondrion transport along microtubule(GO:0047497) |
| 0.0 | 0.2 | GO:0031145 | anaphase-promoting complex-dependent catabolic process(GO:0031145) |
| 0.0 | 0.2 | GO:0032364 | oxygen homeostasis(GO:0032364) |
| 0.0 | 1.2 | GO:0006493 | protein O-linked glycosylation(GO:0006493) |
| 0.0 | 0.3 | GO:0006614 | SRP-dependent cotranslational protein targeting to membrane(GO:0006614) |
| 0.0 | 0.2 | GO:0006654 | phosphatidic acid biosynthetic process(GO:0006654) phosphatidic acid metabolic process(GO:0046473) |
| 0.0 | 0.3 | GO:0034244 | negative regulation of transcription elongation from RNA polymerase II promoter(GO:0034244) |
| 0.0 | 0.5 | GO:0071470 | cellular response to osmotic stress(GO:0071470) |
| 0.0 | 0.7 | GO:0045879 | negative regulation of smoothened signaling pathway(GO:0045879) |
| 0.0 | 0.3 | GO:0015693 | magnesium ion transport(GO:0015693) |
| 0.0 | 0.2 | GO:0090527 | actin filament reorganization(GO:0090527) |
| 0.0 | 0.2 | GO:0000729 | DNA double-strand break processing(GO:0000729) |
| 0.0 | 0.1 | GO:0006273 | lagging strand elongation(GO:0006273) |
| 0.0 | 0.1 | GO:0045875 | negative regulation of sister chromatid cohesion(GO:0045875) |
| 0.0 | 0.1 | GO:0045541 | negative regulation of cholesterol biosynthetic process(GO:0045541) negative regulation of cholesterol metabolic process(GO:0090206) |
| 0.0 | 0.2 | GO:0035562 | negative regulation of chromatin binding(GO:0035562) |
| 0.0 | 0.3 | GO:0003094 | glomerular filtration(GO:0003094) |
| 0.0 | 0.1 | GO:0071243 | cellular response to arsenic-containing substance(GO:0071243) |
| 0.0 | 0.1 | GO:0035520 | monoubiquitinated protein deubiquitination(GO:0035520) |
| 0.0 | 0.2 | GO:0000054 | ribosomal subunit export from nucleus(GO:0000054) ribosome localization(GO:0033750) establishment of ribosome localization(GO:0033753) |
| 0.0 | 0.1 | GO:0042780 | tRNA 3'-end processing(GO:0042780) |
| 0.0 | 0.3 | GO:0048148 | behavioral response to cocaine(GO:0048148) |
| 0.0 | 0.6 | GO:0010501 | RNA secondary structure unwinding(GO:0010501) |
| 0.0 | 0.3 | GO:0051452 | intracellular pH reduction(GO:0051452) |
| 0.0 | 0.9 | GO:0007156 | homophilic cell adhesion via plasma membrane adhesion molecules(GO:0007156) |
| 0.0 | 0.0 | GO:0019085 | early viral transcription(GO:0019085) |
| 0.0 | 0.9 | GO:0006487 | protein N-linked glycosylation(GO:0006487) |
| 0.0 | 0.4 | GO:0003333 | amino acid transmembrane transport(GO:0003333) |
| 0.0 | 0.2 | GO:0006903 | vesicle targeting(GO:0006903) |
| 0.0 | 0.1 | GO:0051418 | interphase microtubule nucleation by interphase microtubule organizing center(GO:0051415) microtubule nucleation by microtubule organizing center(GO:0051418) |
| 0.0 | 0.1 | GO:0007296 | vitellogenesis(GO:0007296) |
| 0.0 | 0.1 | GO:0021960 | anterior commissure morphogenesis(GO:0021960) |
Gene overrepresentation in cellular_component category:
| Log-likelihood per target | Total log-likelihood | Term | Description |
|---|---|---|---|
| 0.3 | 0.8 | GO:1990415 | Pex17p-Pex14p docking complex(GO:1990415) peroxisomal importomer complex(GO:1990429) |
| 0.2 | 0.7 | GO:0005588 | collagen type V trimer(GO:0005588) |
| 0.2 | 1.2 | GO:0097452 | GAIT complex(GO:0097452) |
| 0.1 | 0.5 | GO:0031084 | BLOC-2 complex(GO:0031084) |
| 0.1 | 0.4 | GO:0000408 | EKC/KEOPS complex(GO:0000408) |
| 0.1 | 0.5 | GO:0035339 | SPOTS complex(GO:0035339) |
| 0.1 | 0.7 | GO:0005663 | DNA replication factor C complex(GO:0005663) |
| 0.1 | 0.3 | GO:0043527 | tRNA methyltransferase complex(GO:0043527) |
| 0.1 | 0.3 | GO:0005785 | signal recognition particle receptor complex(GO:0005785) |
| 0.1 | 0.4 | GO:0001533 | cornified envelope(GO:0001533) |
| 0.1 | 0.4 | GO:0032444 | activin responsive factor complex(GO:0032444) |
| 0.1 | 0.4 | GO:0016602 | CCAAT-binding factor complex(GO:0016602) |
| 0.1 | 3.7 | GO:0005801 | cis-Golgi network(GO:0005801) |
| 0.1 | 0.3 | GO:0043202 | lysosomal lumen(GO:0043202) |
| 0.1 | 0.2 | GO:0055087 | Ski complex(GO:0055087) |
| 0.1 | 0.3 | GO:0002193 | MAML1-RBP-Jkappa- ICN1 complex(GO:0002193) |
| 0.1 | 0.4 | GO:0005958 | DNA-dependent protein kinase-DNA ligase 4 complex(GO:0005958) |
| 0.1 | 0.7 | GO:0044232 | organelle membrane contact site(GO:0044232) |
| 0.1 | 0.3 | GO:0090543 | Flemming body(GO:0090543) |
| 0.0 | 0.1 | GO:0005658 | alpha DNA polymerase:primase complex(GO:0005658) |
| 0.0 | 0.4 | GO:0042382 | paraspeckles(GO:0042382) |
| 0.0 | 0.5 | GO:0051286 | cell tip(GO:0051286) |
| 0.0 | 0.2 | GO:0005745 | m-AAA complex(GO:0005745) |
| 0.0 | 0.4 | GO:0005642 | annulate lamellae(GO:0005642) |
| 0.0 | 0.5 | GO:0034098 | VCP-NPL4-UFD1 AAA ATPase complex(GO:0034098) |
| 0.0 | 0.0 | GO:0008024 | cyclin/CDK positive transcription elongation factor complex(GO:0008024) |
| 0.0 | 0.2 | GO:0097361 | CIA complex(GO:0097361) |
| 0.0 | 0.7 | GO:0005697 | telomerase holoenzyme complex(GO:0005697) |
| 0.0 | 0.3 | GO:0032580 | Golgi cisterna membrane(GO:0032580) |
| 0.0 | 0.3 | GO:0000813 | ESCRT I complex(GO:0000813) |
| 0.0 | 1.2 | GO:0035869 | ciliary transition zone(GO:0035869) |
| 0.0 | 0.1 | GO:0030689 | Noc complex(GO:0030689) |
| 0.0 | 0.1 | GO:0032311 | angiogenin-PRI complex(GO:0032311) |
| 0.0 | 0.5 | GO:0097228 | sperm principal piece(GO:0097228) |
| 0.0 | 0.5 | GO:0000242 | pericentriolar material(GO:0000242) |
| 0.0 | 0.1 | GO:0000931 | gamma-tubulin large complex(GO:0000931) gamma-tubulin ring complex(GO:0008274) |
| 0.0 | 0.3 | GO:0030056 | hemidesmosome(GO:0030056) |
| 0.0 | 0.2 | GO:0090576 | RNA polymerase III transcription factor complex(GO:0090576) |
| 0.0 | 0.6 | GO:0030140 | trans-Golgi network transport vesicle(GO:0030140) |
| 0.0 | 0.3 | GO:0005942 | phosphatidylinositol 3-kinase complex(GO:0005942) |
| 0.0 | 0.3 | GO:0035102 | PRC1 complex(GO:0035102) |
| 0.0 | 0.2 | GO:0005736 | DNA-directed RNA polymerase I complex(GO:0005736) |
| 0.0 | 0.1 | GO:0032021 | NELF complex(GO:0032021) |
| 0.0 | 1.8 | GO:0030139 | endocytic vesicle(GO:0030139) |
| 0.0 | 0.2 | GO:0016600 | flotillin complex(GO:0016600) |
| 0.0 | 0.2 | GO:0031083 | BLOC-1 complex(GO:0031083) |
| 0.0 | 0.2 | GO:0071203 | WASH complex(GO:0071203) |
| 0.0 | 0.1 | GO:0044292 | dendrite terminus(GO:0044292) |
| 0.0 | 0.1 | GO:0090571 | RNA polymerase II transcription repressor complex(GO:0090571) |
| 0.0 | 0.0 | GO:0031315 | extrinsic component of mitochondrial outer membrane(GO:0031315) |
| 0.0 | 0.2 | GO:0031616 | spindle pole centrosome(GO:0031616) |
| 0.0 | 0.7 | GO:0005720 | nuclear heterochromatin(GO:0005720) |
| 0.0 | 0.5 | GO:0031463 | Cul3-RING ubiquitin ligase complex(GO:0031463) |
Gene overrepresentation in molecular_function category:
| Log-likelihood per target | Total log-likelihood | Term | Description |
|---|---|---|---|
| 0.3 | 1.8 | GO:0035727 | lysophosphatidic acid binding(GO:0035727) lysophosphatidic acid receptor activity(GO:0070915) |
| 0.3 | 1.1 | GO:0004483 | mRNA (nucleoside-2'-O-)-methyltransferase activity(GO:0004483) |
| 0.2 | 0.9 | GO:0030144 | alpha-1,6-mannosylglycoprotein 6-beta-N-acetylglucosaminyltransferase activity(GO:0030144) |
| 0.2 | 0.5 | GO:0008176 | tRNA (guanine-N7-)-methyltransferase activity(GO:0008176) |
| 0.2 | 0.5 | GO:0033699 | DNA 5'-adenosine monophosphate hydrolase activity(GO:0033699) |
| 0.1 | 0.7 | GO:0097001 | sphingolipid transporter activity(GO:0046624) ceramide binding(GO:0097001) |
| 0.1 | 0.8 | GO:0004043 | L-aminoadipate-semialdehyde dehydrogenase activity(GO:0004043) |
| 0.1 | 0.5 | GO:0035473 | lipase binding(GO:0035473) |
| 0.1 | 0.4 | GO:0003963 | RNA-3'-phosphate cyclase activity(GO:0003963) |
| 0.1 | 0.4 | GO:0061711 | N(6)-L-threonylcarbamoyladenine synthase(GO:0061711) |
| 0.1 | 0.4 | GO:0019779 | Atg12 activating enzyme activity(GO:0019778) Atg8 activating enzyme activity(GO:0019779) |
| 0.1 | 3.4 | GO:0033130 | acetylcholine receptor binding(GO:0033130) |
| 0.1 | 0.6 | GO:0005030 | neurotrophin receptor activity(GO:0005030) |
| 0.1 | 0.9 | GO:0008429 | phosphatidylethanolamine binding(GO:0008429) |
| 0.1 | 0.3 | GO:0004758 | serine C-palmitoyltransferase activity(GO:0004758) |
| 0.1 | 0.3 | GO:0010484 | H3 histone acetyltransferase activity(GO:0010484) |
| 0.1 | 0.9 | GO:0045294 | alpha-catenin binding(GO:0045294) delta-catenin binding(GO:0070097) |
| 0.1 | 0.3 | GO:0004565 | beta-galactosidase activity(GO:0004565) |
| 0.1 | 0.4 | GO:0030618 | transforming growth factor beta receptor, pathway-specific cytoplasmic mediator activity(GO:0030618) |
| 0.1 | 0.7 | GO:0000182 | rDNA binding(GO:0000182) |
| 0.1 | 0.5 | GO:0030911 | TPR domain binding(GO:0030911) |
| 0.1 | 1.1 | GO:0050811 | GABA receptor binding(GO:0050811) |
| 0.1 | 1.2 | GO:0005003 | ephrin receptor activity(GO:0005003) |
| 0.1 | 1.2 | GO:0035613 | RNA stem-loop binding(GO:0035613) |
| 0.1 | 0.4 | GO:0034916 | 4-methyloctanoyl-CoA dehydrogenase activity(GO:0034580) naphthyl-2-methyl-succinyl-CoA dehydrogenase activity(GO:0034845) 2-methylhexanoyl-CoA dehydrogenase activity(GO:0034916) propionyl-CoA dehydrogenase activity(GO:0043820) thiol-driven fumarate reductase activity(GO:0043830) coenzyme F420-dependent 2,4,6-trinitrophenol reductase activity(GO:0052758) coenzyme F420-dependent 2,4,6-trinitrophenol hydride reductase activity(GO:0052759) coenzyme F420-dependent 2,4-dinitrophenol reductase activity(GO:0052760) |
| 0.1 | 0.7 | GO:0003689 | DNA clamp loader activity(GO:0003689) protein-DNA loading ATPase activity(GO:0033170) |
| 0.1 | 0.2 | GO:0031826 | type 2A serotonin receptor binding(GO:0031826) |
| 0.1 | 0.3 | GO:0005047 | signal recognition particle binding(GO:0005047) |
| 0.1 | 0.5 | GO:0030976 | thiamine pyrophosphate binding(GO:0030976) |
| 0.1 | 0.3 | GO:0038132 | neuregulin binding(GO:0038132) |
| 0.1 | 0.4 | GO:0008479 | queuine tRNA-ribosyltransferase activity(GO:0008479) |
| 0.1 | 0.2 | GO:0015232 | heme transporter activity(GO:0015232) |
| 0.1 | 0.2 | GO:0019166 | trans-2-enoyl-CoA reductase (NADPH) activity(GO:0019166) |
| 0.0 | 0.4 | GO:0043495 | protein anchor(GO:0043495) |
| 0.0 | 0.7 | GO:0048407 | platelet-derived growth factor binding(GO:0048407) |
| 0.0 | 0.6 | GO:0005149 | interleukin-1 receptor binding(GO:0005149) |
| 0.0 | 0.5 | GO:0005388 | calcium-transporting ATPase activity(GO:0005388) |
| 0.0 | 0.5 | GO:0022841 | potassium ion leak channel activity(GO:0022841) |
| 0.0 | 0.3 | GO:0045703 | pinocarveol dehydrogenase activity(GO:0018446) chloral hydrate dehydrogenase activity(GO:0018447) hydroxymethylmethylsilanediol oxidase activity(GO:0018448) 1-phenylethanol dehydrogenase activity(GO:0018449) myrtenol dehydrogenase activity(GO:0018450) cis-1,2-dihydroxy-1,2-dihydro-8-carboxynaphthalene dehydrogenase activity(GO:0034522) 3-hydroxy-4-methyloctanoyl-CoA dehydrogenase activity(GO:0034582) 2-hydroxy-4-isopropenylcyclohexane-1-carboxyl-CoA dehydrogenase activity(GO:0034778) cis-9,10-dihydroanthracene-9,10-diol dehydrogenase activity(GO:0034817) citronellol dehydrogenase activity(GO:0034821) naphthyl-2-hydroxymethyl-succinyl-CoA dehydrogenase activity(GO:0034847) 2,4,4-trimethyl-1-pentanol dehydrogenase activity(GO:0034863) 2,4,4-trimethyl-3-hydroxypentanoyl-CoA dehydrogenase activity(GO:0034868) 1-hydroxy-4,4-dimethylpentan-3-one dehydrogenase activity(GO:0034871) endosulfan diol dehydrogenase activity(GO:0034891) endosulfan hydroxyether dehydrogenase activity(GO:0034901) 3-hydroxy-2-methylhexanoyl-CoA dehydrogenase activity(GO:0034918) 3-hydroxy-2,6-dimethyl-5-methylene-heptanoyl-CoA dehydrogenase activity(GO:0034944) versicolorin reductase activity(GO:0042469) ketoreductase activity(GO:0045703) |
| 0.0 | 0.5 | GO:0016884 | carbon-nitrogen ligase activity, with glutamine as amido-N-donor(GO:0016884) |
| 0.0 | 0.5 | GO:0048273 | mitogen-activated protein kinase p38 binding(GO:0048273) |
| 0.0 | 0.3 | GO:0004013 | adenosylhomocysteinase activity(GO:0004013) trialkylsulfonium hydrolase activity(GO:0016802) |
| 0.0 | 0.2 | GO:0032564 | dATP binding(GO:0032564) |
| 0.0 | 0.1 | GO:0004962 | endothelin receptor activity(GO:0004962) |
| 0.0 | 0.8 | GO:0070530 | K63-linked polyubiquitin binding(GO:0070530) |
| 0.0 | 0.2 | GO:0005049 | nuclear export signal receptor activity(GO:0005049) |
| 0.0 | 0.3 | GO:0035005 | 1-phosphatidylinositol-4-phosphate 3-kinase activity(GO:0035005) |
| 0.0 | 0.1 | GO:0004609 | phosphatidylserine decarboxylase activity(GO:0004609) |
| 0.0 | 0.2 | GO:0035368 | selenocysteine insertion sequence binding(GO:0035368) |
| 0.0 | 1.2 | GO:0052771 | coenzyme F390-A hydrolase activity(GO:0052770) coenzyme F390-G hydrolase activity(GO:0052771) |
| 0.0 | 0.1 | GO:0070137 | ubiquitin-like protein-specific endopeptidase activity(GO:0070137) SUMO-specific endopeptidase activity(GO:0070139) |
| 0.0 | 0.3 | GO:0102338 | fatty acid elongase activity(GO:0009922) 3-oxo-arachidoyl-CoA synthase activity(GO:0102336) 3-oxo-cerotoyl-CoA synthase activity(GO:0102337) 3-oxo-lignoceronyl-CoA synthase activity(GO:0102338) |
| 0.0 | 0.3 | GO:0004176 | ATP-dependent peptidase activity(GO:0004176) |
| 0.0 | 0.2 | GO:0003997 | acyl-CoA oxidase activity(GO:0003997) |
| 0.0 | 0.5 | GO:0030169 | low-density lipoprotein particle binding(GO:0030169) |
| 0.0 | 1.0 | GO:0031624 | ubiquitin conjugating enzyme binding(GO:0031624) |
| 0.0 | 1.9 | GO:0008374 | O-acyltransferase activity(GO:0008374) |
| 0.0 | 0.1 | GO:0009378 | four-way junction helicase activity(GO:0009378) |
| 0.0 | 0.3 | GO:0010521 | telomerase inhibitor activity(GO:0010521) |
| 0.0 | 0.5 | GO:0004012 | phospholipid-translocating ATPase activity(GO:0004012) |
| 0.0 | 0.1 | GO:0035851 | histone deacetylase activity (H4-K16 specific)(GO:0034739) Krueppel-associated box domain binding(GO:0035851) |
| 0.0 | 0.1 | GO:0003896 | DNA primase activity(GO:0003896) |
| 0.0 | 0.1 | GO:0004826 | phenylalanine-tRNA ligase activity(GO:0004826) |
| 0.0 | 0.2 | GO:0004571 | mannosyl-oligosaccharide 1,2-alpha-mannosidase activity(GO:0004571) |
| 0.0 | 0.3 | GO:0015095 | magnesium ion transmembrane transporter activity(GO:0015095) |
| 0.0 | 0.3 | GO:0008308 | voltage-gated anion channel activity(GO:0008308) |
| 0.0 | 0.2 | GO:0034450 | ubiquitin-ubiquitin ligase activity(GO:0034450) |
| 0.0 | 0.2 | GO:0008301 | DNA binding, bending(GO:0008301) |
| 0.0 | 0.3 | GO:0032183 | SUMO binding(GO:0032183) |
| 0.0 | 0.2 | GO:0001054 | RNA polymerase I activity(GO:0001054) |
| 0.0 | 0.6 | GO:0061631 | ubiquitin conjugating enzyme activity(GO:0061631) |
| 0.0 | 0.6 | GO:0051539 | 4 iron, 4 sulfur cluster binding(GO:0051539) |
| 0.0 | 0.2 | GO:0004861 | cyclin-dependent protein serine/threonine kinase inhibitor activity(GO:0004861) |
| 0.0 | 0.2 | GO:0004198 | calcium-dependent cysteine-type endopeptidase activity(GO:0004198) |
| 0.0 | 0.2 | GO:0036312 | phosphatidylinositol 3-kinase regulatory subunit binding(GO:0036312) |
| 0.0 | 0.2 | GO:0043024 | ribosomal small subunit binding(GO:0043024) |
| 0.0 | 0.1 | GO:0008428 | ribonuclease inhibitor activity(GO:0008428) |
| 0.0 | 0.2 | GO:0051400 | BH domain binding(GO:0051400) |
| 0.0 | 0.5 | GO:0004867 | serine-type endopeptidase inhibitor activity(GO:0004867) |
| 0.0 | 0.8 | GO:0070491 | repressing transcription factor binding(GO:0070491) |
| 0.0 | 0.0 | GO:0097322 | 7SK snRNA binding(GO:0097322) |
| 0.0 | 0.3 | GO:0003785 | actin monomer binding(GO:0003785) |