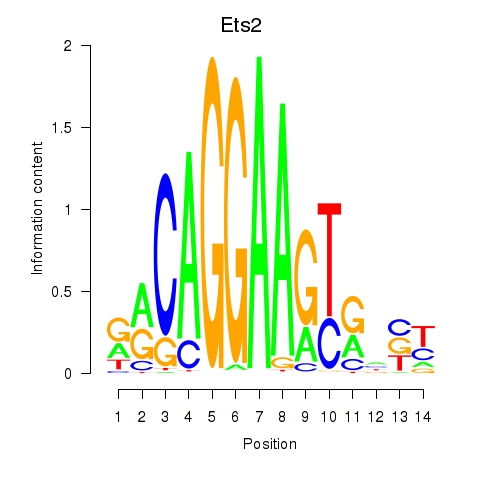
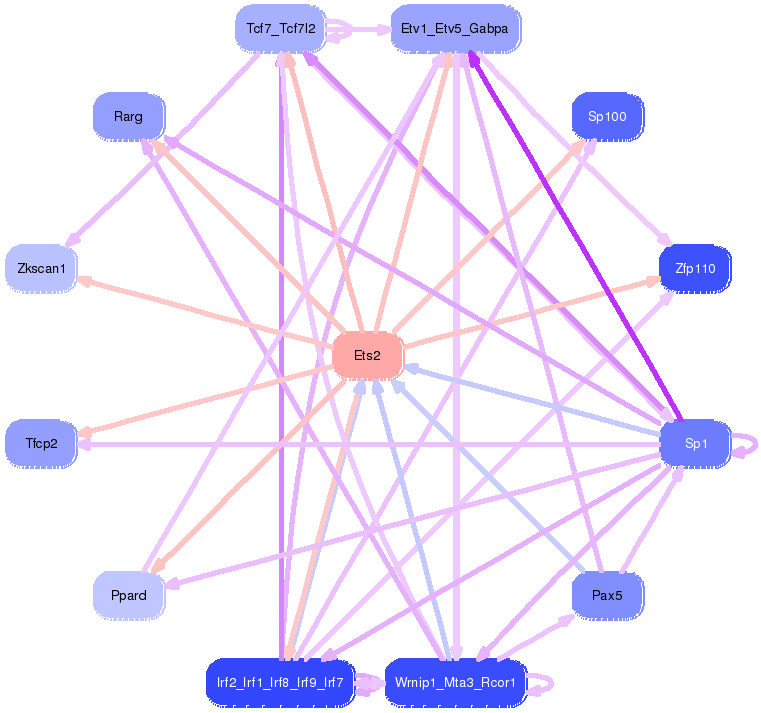
Motif ID: Ets2
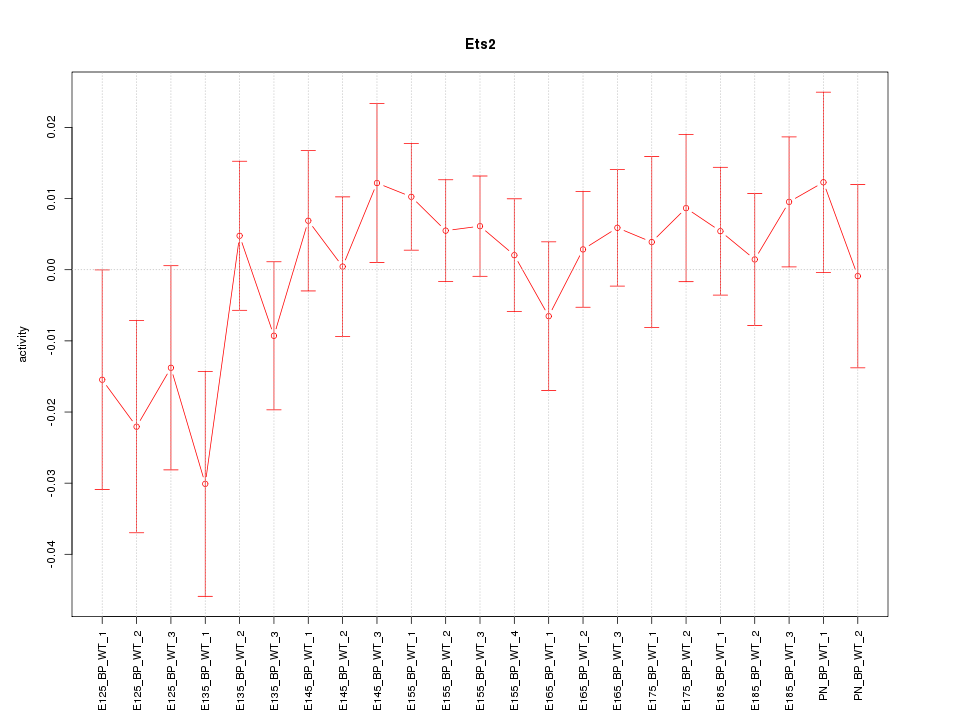
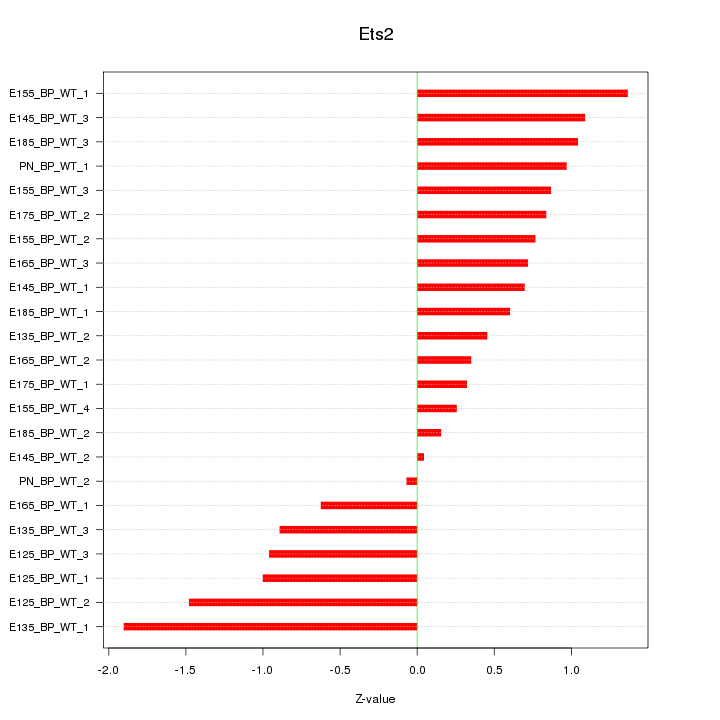
Z-value: 0.884
Transcription factors associated with Ets2:
| Gene Symbol | Entrez ID | Gene Name |
|---|---|---|
| Ets2 | ENSMUSG00000022895.8 | Ets2 |
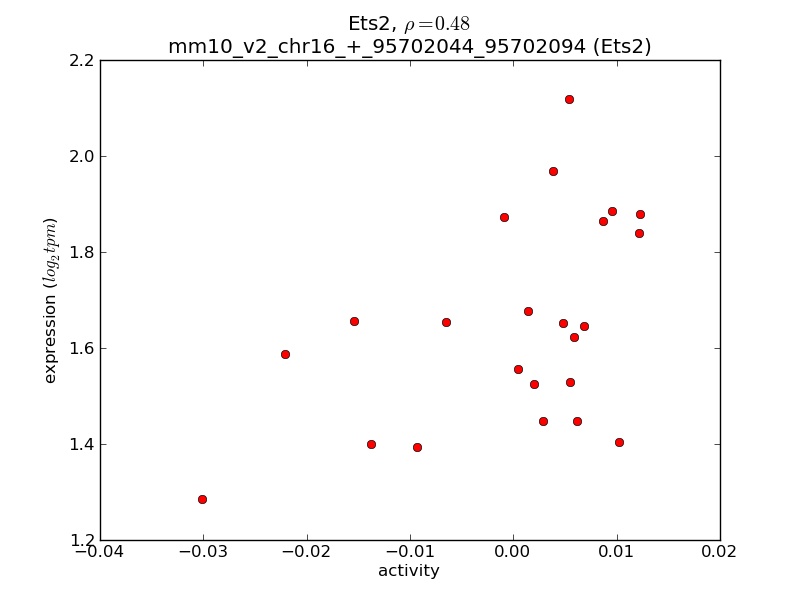
Activity-expression correlation:
| Gene Symbol | Promoter | Pearson corr. coef. | P-value | Plot |
|---|---|---|---|---|
| Ets2 | mm10_v2_chr16_+_95702044_95702094 | 0.48 | 2.0e-02 | Click! |

Top targets:
Gene overrepresentation in biological_process category:
| Log-likelihood per target | Total log-likelihood | Term | Description |
|---|---|---|---|
| 0.5 | 1.5 | GO:0003032 | detection of oxygen(GO:0003032) |
| 0.5 | 1.4 | GO:0019085 | early viral transcription(GO:0019085) |
| 0.5 | 1.8 | GO:0043654 | recognition of apoptotic cell(GO:0043654) |
| 0.4 | 1.7 | GO:0034135 | regulation of toll-like receptor 2 signaling pathway(GO:0034135) |
| 0.4 | 1.1 | GO:1901552 | positive regulation of endothelial cell development(GO:1901552) positive regulation of establishment of endothelial barrier(GO:1903142) |
| 0.4 | 0.7 | GO:1901668 | regulation of superoxide dismutase activity(GO:1901668) |
| 0.3 | 1.7 | GO:0032497 | detection of lipopolysaccharide(GO:0032497) |
| 0.3 | 5.2 | GO:0021902 | commitment of neuronal cell to specific neuron type in forebrain(GO:0021902) |
| 0.3 | 1.5 | GO:0015871 | choline transport(GO:0015871) regulation of resting membrane potential(GO:0060075) |
| 0.3 | 1.6 | GO:0070447 | positive regulation of oligodendrocyte progenitor proliferation(GO:0070447) |
| 0.3 | 1.3 | GO:0050861 | positive regulation of B cell receptor signaling pathway(GO:0050861) |
| 0.2 | 1.0 | GO:0007228 | positive regulation of hh target transcription factor activity(GO:0007228) |
| 0.2 | 0.7 | GO:0046122 | purine deoxyribonucleoside metabolic process(GO:0046122) |
| 0.2 | 1.3 | GO:1902847 | macrophage proliferation(GO:0061517) microglial cell proliferation(GO:0061518) regulation of neuronal signal transduction(GO:1902847) positive regulation of tau-protein kinase activity(GO:1902949) |
| 0.2 | 1.1 | GO:0045053 | protein retention in Golgi apparatus(GO:0045053) |
| 0.2 | 0.9 | GO:0042364 | water-soluble vitamin biosynthetic process(GO:0042364) positive regulation of ryanodine-sensitive calcium-release channel activity(GO:0060316) |
| 0.2 | 0.6 | GO:2000313 | fibroblast growth factor receptor signaling pathway involved in neural plate anterior/posterior pattern formation(GO:0060825) regulation of fibroblast growth factor receptor signaling pathway involved in neural plate anterior/posterior pattern formation(GO:2000313) negative regulation of fibroblast growth factor receptor signaling pathway involved in neural plate anterior/posterior pattern formation(GO:2000314) |
| 0.2 | 0.6 | GO:0043323 | positive regulation of natural killer cell degranulation(GO:0043323) |
| 0.2 | 0.6 | GO:0006776 | vitamin A metabolic process(GO:0006776) |
| 0.2 | 0.6 | GO:0018307 | enzyme active site formation(GO:0018307) |
| 0.1 | 1.9 | GO:0034497 | protein localization to pre-autophagosomal structure(GO:0034497) |
| 0.1 | 0.9 | GO:0002681 | somatic diversification of T cell receptor genes(GO:0002568) somatic recombination of T cell receptor gene segments(GO:0002681) T cell receptor V(D)J recombination(GO:0033153) |
| 0.1 | 2.2 | GO:0060363 | cranial suture morphogenesis(GO:0060363) |
| 0.1 | 0.7 | GO:2000574 | regulation of microtubule motor activity(GO:2000574) |
| 0.1 | 0.6 | GO:0086042 | cardiac muscle cell-cardiac muscle cell adhesion(GO:0086042) |
| 0.1 | 0.6 | GO:0072674 | multinuclear osteoclast differentiation(GO:0072674) |
| 0.1 | 0.4 | GO:0010637 | negative regulation of mitochondrial fusion(GO:0010637) |
| 0.1 | 0.5 | GO:0003430 | growth plate cartilage chondrocyte growth(GO:0003430) |
| 0.1 | 0.7 | GO:0048102 | autophagic cell death(GO:0048102) |
| 0.1 | 0.9 | GO:1901844 | regulation of cell communication by electrical coupling involved in cardiac conduction(GO:1901844) |
| 0.1 | 1.0 | GO:0061088 | sequestering of zinc ion(GO:0032119) regulation of sequestering of zinc ion(GO:0061088) |
| 0.1 | 1.8 | GO:2000096 | positive regulation of Wnt signaling pathway, planar cell polarity pathway(GO:2000096) |
| 0.1 | 0.4 | GO:0048304 | positive regulation of isotype switching to IgG isotypes(GO:0048304) |
| 0.1 | 1.1 | GO:0090232 | positive regulation of spindle checkpoint(GO:0090232) |
| 0.1 | 0.3 | GO:0090327 | negative regulation of locomotion involved in locomotory behavior(GO:0090327) |
| 0.1 | 0.5 | GO:0030259 | lipid glycosylation(GO:0030259) |
| 0.1 | 0.4 | GO:1902774 | late endosome to lysosome transport(GO:1902774) |
| 0.1 | 1.8 | GO:0035235 | ionotropic glutamate receptor signaling pathway(GO:0035235) |
| 0.1 | 0.3 | GO:0045041 | protein import into mitochondrial intermembrane space(GO:0045041) |
| 0.1 | 0.6 | GO:0016255 | attachment of GPI anchor to protein(GO:0016255) |
| 0.1 | 3.3 | GO:0001937 | negative regulation of endothelial cell proliferation(GO:0001937) |
| 0.1 | 0.8 | GO:0006488 | dolichol-linked oligosaccharide biosynthetic process(GO:0006488) |
| 0.1 | 0.3 | GO:2000564 | regulation of MyD88-dependent toll-like receptor signaling pathway(GO:0034124) CD8-positive, alpha-beta T cell proliferation(GO:0035740) negative regulation of regulatory T cell differentiation(GO:0045590) regulation of CD8-positive, alpha-beta T cell proliferation(GO:2000564) |
| 0.1 | 0.7 | GO:0023035 | CD40 signaling pathway(GO:0023035) protein linear polyubiquitination(GO:0097039) |
| 0.1 | 4.4 | GO:0047496 | vesicle transport along microtubule(GO:0047496) |
| 0.1 | 1.2 | GO:0035635 | entry of bacterium into host cell(GO:0035635) regulation of entry of bacterium into host cell(GO:2000535) |
| 0.1 | 0.7 | GO:0035871 | protein K11-linked deubiquitination(GO:0035871) |
| 0.1 | 1.1 | GO:0000185 | activation of MAPKKK activity(GO:0000185) |
| 0.1 | 1.4 | GO:2000505 | regulation of energy homeostasis(GO:2000505) |
| 0.1 | 0.4 | GO:0010032 | meiotic chromosome condensation(GO:0010032) |
| 0.1 | 0.7 | GO:0016081 | synaptic vesicle docking(GO:0016081) |
| 0.1 | 0.3 | GO:0090309 | positive regulation of methylation-dependent chromatin silencing(GO:0090309) |
| 0.1 | 0.3 | GO:1904569 | regulation of selenocysteine incorporation(GO:1904569) |
| 0.1 | 0.3 | GO:0010726 | positive regulation of hydrogen peroxide metabolic process(GO:0010726) |
| 0.1 | 0.5 | GO:0060267 | positive regulation of respiratory burst(GO:0060267) |
| 0.1 | 0.7 | GO:0002281 | macrophage activation involved in immune response(GO:0002281) |
| 0.1 | 0.4 | GO:0072015 | glomerular visceral epithelial cell development(GO:0072015) glomerular epithelial cell development(GO:0072310) |
| 0.1 | 0.3 | GO:0060709 | glycogen cell differentiation involved in embryonic placenta development(GO:0060709) |
| 0.1 | 0.2 | GO:0006624 | vacuolar protein processing(GO:0006624) |
| 0.1 | 2.7 | GO:0050873 | brown fat cell differentiation(GO:0050873) |
| 0.1 | 0.3 | GO:0034134 | toll-like receptor 2 signaling pathway(GO:0034134) |
| 0.1 | 0.2 | GO:2000832 | cortisol secretion(GO:0043400) regulation of cortisol secretion(GO:0051462) negative regulation of steroid hormone secretion(GO:2000832) negative regulation of corticosteroid hormone secretion(GO:2000847) negative regulation of glucocorticoid secretion(GO:2000850) |
| 0.1 | 0.4 | GO:0036438 | maintenance of lens transparency(GO:0036438) |
| 0.1 | 0.4 | GO:0034316 | negative regulation of Arp2/3 complex-mediated actin nucleation(GO:0034316) |
| 0.1 | 0.3 | GO:0017183 | peptidyl-diphthamide metabolic process(GO:0017182) peptidyl-diphthamide biosynthetic process from peptidyl-histidine(GO:0017183) |
| 0.1 | 0.3 | GO:1904425 | negative regulation of GTP binding(GO:1904425) |
| 0.1 | 0.5 | GO:0050882 | voluntary musculoskeletal movement(GO:0050882) |
| 0.1 | 0.5 | GO:0031642 | negative regulation of myelination(GO:0031642) negative regulation of excitatory postsynaptic potential(GO:0090394) |
| 0.1 | 0.4 | GO:0006621 | protein retention in ER lumen(GO:0006621) |
| 0.1 | 0.4 | GO:0017196 | N-terminal peptidyl-methionine acetylation(GO:0017196) |
| 0.1 | 0.2 | GO:1902255 | positive regulation of intrinsic apoptotic signaling pathway by p53 class mediator(GO:1902255) |
| 0.1 | 0.1 | GO:0035990 | tendon cell differentiation(GO:0035990) tendon formation(GO:0035992) |
| 0.1 | 0.6 | GO:0071578 | zinc II ion transmembrane import(GO:0071578) |
| 0.1 | 0.4 | GO:0036066 | fucose metabolic process(GO:0006004) protein O-linked fucosylation(GO:0036066) |
| 0.1 | 0.5 | GO:0018095 | protein polyglutamylation(GO:0018095) |
| 0.1 | 0.2 | GO:0021506 | anterior neuropore closure(GO:0021506) neuropore closure(GO:0021995) |
| 0.1 | 1.0 | GO:0006613 | cotranslational protein targeting to membrane(GO:0006613) |
| 0.1 | 0.1 | GO:0046368 | GDP-L-fucose metabolic process(GO:0046368) |
| 0.1 | 0.7 | GO:0045792 | negative regulation of cell size(GO:0045792) |
| 0.1 | 0.3 | GO:0032485 | regulation of Ral protein signal transduction(GO:0032485) |
| 0.1 | 0.2 | GO:0006438 | valyl-tRNA aminoacylation(GO:0006438) |
| 0.1 | 0.4 | GO:0051534 | negative regulation of NFAT protein import into nucleus(GO:0051534) |
| 0.1 | 0.7 | GO:0006829 | zinc II ion transport(GO:0006829) |
| 0.1 | 0.3 | GO:0035469 | determination of pancreatic left/right asymmetry(GO:0035469) epithelial cilium movement involved in determination of left/right asymmetry(GO:0060287) |
| 0.1 | 0.3 | GO:0044034 | negative stranded viral RNA replication(GO:0039689) multi-organism biosynthetic process(GO:0044034) |
| 0.1 | 0.2 | GO:0019276 | UDP-N-acetylgalactosamine metabolic process(GO:0019276) |
| 0.1 | 0.4 | GO:0036506 | maintenance of unfolded protein(GO:0036506) protein insertion into ER membrane(GO:0045048) tail-anchored membrane protein insertion into ER membrane(GO:0071816) maintenance of unfolded protein involved in ERAD pathway(GO:1904378) |
| 0.1 | 0.4 | GO:0007016 | cytoskeletal anchoring at plasma membrane(GO:0007016) |
| 0.0 | 1.0 | GO:0045725 | positive regulation of glycogen biosynthetic process(GO:0045725) |
| 0.0 | 0.3 | GO:0061042 | vascular wound healing(GO:0061042) |
| 0.0 | 0.1 | GO:0008612 | peptidyl-lysine modification to peptidyl-hypusine(GO:0008612) |
| 0.0 | 0.2 | GO:0032201 | telomere maintenance via semi-conservative replication(GO:0032201) |
| 0.0 | 0.6 | GO:0014067 | negative regulation of phosphatidylinositol 3-kinase signaling(GO:0014067) |
| 0.0 | 0.6 | GO:0061299 | retina vasculature morphogenesis in camera-type eye(GO:0061299) |
| 0.0 | 0.9 | GO:0045907 | positive regulation of vasoconstriction(GO:0045907) |
| 0.0 | 0.6 | GO:0006817 | phosphate ion transport(GO:0006817) |
| 0.0 | 1.8 | GO:0071300 | cellular response to retinoic acid(GO:0071300) |
| 0.0 | 0.3 | GO:0006013 | mannose metabolic process(GO:0006013) |
| 0.0 | 0.5 | GO:0009312 | oligosaccharide biosynthetic process(GO:0009312) |
| 0.0 | 0.6 | GO:0034315 | regulation of Arp2/3 complex-mediated actin nucleation(GO:0034315) |
| 0.0 | 0.8 | GO:0016558 | protein import into peroxisome matrix(GO:0016558) |
| 0.0 | 0.2 | GO:1901727 | positive regulation of histone deacetylase activity(GO:1901727) |
| 0.0 | 1.4 | GO:0000038 | very long-chain fatty acid metabolic process(GO:0000038) |
| 0.0 | 0.6 | GO:0090161 | Golgi ribbon formation(GO:0090161) |
| 0.0 | 0.1 | GO:0019043 | positive regulation of transcription from RNA polymerase II promoter involved in unfolded protein response(GO:0006990) establishment of viral latency(GO:0019043) |
| 0.0 | 0.3 | GO:0036371 | protein localization to M-band(GO:0036309) protein localization to T-tubule(GO:0036371) |
| 0.0 | 0.1 | GO:0015867 | ATP transport(GO:0015867) |
| 0.0 | 0.4 | GO:0006895 | Golgi to endosome transport(GO:0006895) |
| 0.0 | 0.2 | GO:0098789 | pre-mRNA cleavage required for polyadenylation(GO:0098789) |
| 0.0 | 0.3 | GO:0043247 | protection from non-homologous end joining at telomere(GO:0031848) telomere maintenance in response to DNA damage(GO:0043247) |
| 0.0 | 5.0 | GO:0035023 | regulation of Rho protein signal transduction(GO:0035023) |
| 0.0 | 0.3 | GO:0034498 | early endosome to Golgi transport(GO:0034498) |
| 0.0 | 0.6 | GO:0045026 | plasma membrane fusion(GO:0045026) |
| 0.0 | 0.3 | GO:0006362 | transcription elongation from RNA polymerase I promoter(GO:0006362) |
| 0.0 | 1.2 | GO:0006890 | retrograde vesicle-mediated transport, Golgi to ER(GO:0006890) |
| 0.0 | 0.1 | GO:0010936 | negative regulation of macrophage cytokine production(GO:0010936) |
| 0.0 | 0.3 | GO:0070234 | positive regulation of T cell apoptotic process(GO:0070234) |
| 0.0 | 0.3 | GO:0006977 | DNA damage response, signal transduction by p53 class mediator resulting in cell cycle arrest(GO:0006977) signal transduction involved in mitotic G1 DNA damage checkpoint(GO:0072431) intracellular signal transduction involved in G1 DNA damage checkpoint(GO:1902400) |
| 0.0 | 0.3 | GO:0044804 | nucleophagy(GO:0044804) |
| 0.0 | 0.1 | GO:0035624 | receptor transactivation(GO:0035624) epidermal growth factor-activated receptor transactivation by G-protein coupled receptor signaling pathway(GO:0035625) response to high density lipoprotein particle(GO:0055099) |
| 0.0 | 0.2 | GO:0006172 | ADP biosynthetic process(GO:0006172) |
| 0.0 | 0.3 | GO:0021942 | radial glia guided migration of Purkinje cell(GO:0021942) |
| 0.0 | 0.1 | GO:0030578 | PML body organization(GO:0030578) |
| 0.0 | 0.9 | GO:0006376 | mRNA splice site selection(GO:0006376) |
| 0.0 | 0.2 | GO:0048149 | behavioral response to ethanol(GO:0048149) |
| 0.0 | 0.8 | GO:0018279 | protein N-linked glycosylation via asparagine(GO:0018279) |
| 0.0 | 0.3 | GO:0048268 | clathrin coat assembly(GO:0048268) |
| 0.0 | 0.5 | GO:0001522 | pseudouridine synthesis(GO:0001522) |
| 0.0 | 0.2 | GO:0019511 | peptidyl-proline hydroxylation(GO:0019511) |
| 0.0 | 0.4 | GO:2000369 | regulation of clathrin-mediated endocytosis(GO:2000369) |
| 0.0 | 0.1 | GO:2000210 | positive regulation of anoikis(GO:2000210) |
| 0.0 | 0.3 | GO:0045653 | negative regulation of megakaryocyte differentiation(GO:0045653) |
| 0.0 | 0.3 | GO:0009072 | aromatic amino acid family metabolic process(GO:0009072) |
| 0.0 | 0.2 | GO:0046415 | urate metabolic process(GO:0046415) |
| 0.0 | 0.7 | GO:2001222 | regulation of neuron migration(GO:2001222) |
| 0.0 | 1.5 | GO:0001578 | microtubule bundle formation(GO:0001578) |
| 0.0 | 0.7 | GO:0045880 | positive regulation of smoothened signaling pathway(GO:0045880) |
| 0.0 | 0.1 | GO:0006102 | isocitrate metabolic process(GO:0006102) |
| 0.0 | 1.1 | GO:2001238 | positive regulation of extrinsic apoptotic signaling pathway(GO:2001238) |
| 0.0 | 0.1 | GO:0032079 | positive regulation of deoxyribonuclease activity(GO:0032077) positive regulation of endodeoxyribonuclease activity(GO:0032079) |
| 0.0 | 0.1 | GO:0045842 | positive regulation of mitotic metaphase/anaphase transition(GO:0045842) positive regulation of metaphase/anaphase transition of cell cycle(GO:1902101) |
| 0.0 | 0.8 | GO:0007266 | Rho protein signal transduction(GO:0007266) |
| 0.0 | 0.2 | GO:0000479 | endonucleolytic cleavage of tricistronic rRNA transcript (SSU-rRNA, 5.8S rRNA, LSU-rRNA)(GO:0000479) |
| 0.0 | 0.3 | GO:0032703 | negative regulation of interleukin-2 production(GO:0032703) |
| 0.0 | 0.3 | GO:0060213 | regulation of nuclear-transcribed mRNA poly(A) tail shortening(GO:0060211) positive regulation of nuclear-transcribed mRNA poly(A) tail shortening(GO:0060213) |
| 0.0 | 0.2 | GO:0071218 | cellular response to misfolded protein(GO:0071218) |
| 0.0 | 0.2 | GO:0042790 | transcription of nuclear large rRNA transcript from RNA polymerase I promoter(GO:0042790) |
| 0.0 | 0.3 | GO:0090330 | regulation of platelet aggregation(GO:0090330) |
| 0.0 | 0.5 | GO:0000266 | mitochondrial fission(GO:0000266) |
| 0.0 | 0.5 | GO:0003333 | amino acid transmembrane transport(GO:0003333) |
| 0.0 | 1.0 | GO:0003281 | ventricular septum development(GO:0003281) |
| 0.0 | 0.1 | GO:0032625 | interleukin-21 production(GO:0032625) interleukin-21 secretion(GO:0072619) |
| 0.0 | 0.2 | GO:0034643 | establishment of mitochondrion localization, microtubule-mediated(GO:0034643) mitochondrion transport along microtubule(GO:0047497) |
| 0.0 | 0.3 | GO:0034198 | cellular response to amino acid starvation(GO:0034198) |
| 0.0 | 0.3 | GO:0006491 | N-glycan processing(GO:0006491) |
| 0.0 | 0.3 | GO:0032981 | NADH dehydrogenase complex assembly(GO:0010257) mitochondrial respiratory chain complex I assembly(GO:0032981) mitochondrial respiratory chain complex I biogenesis(GO:0097031) |
| 0.0 | 0.2 | GO:0001921 | positive regulation of receptor recycling(GO:0001921) |
| 0.0 | 0.2 | GO:0019835 | cytolysis(GO:0019835) |
| 0.0 | 0.1 | GO:0030238 | male sex determination(GO:0030238) |
| 0.0 | 0.3 | GO:0007032 | endosome organization(GO:0007032) |
| 0.0 | 0.1 | GO:0016559 | peroxisome fission(GO:0016559) |
| 0.0 | 2.2 | GO:0043547 | positive regulation of GTPase activity(GO:0043547) |
| 0.0 | 0.5 | GO:2000649 | regulation of sodium ion transmembrane transporter activity(GO:2000649) |
| 0.0 | 0.2 | GO:0032469 | endoplasmic reticulum calcium ion homeostasis(GO:0032469) |
| 0.0 | 0.3 | GO:0015991 | energy coupled proton transmembrane transport, against electrochemical gradient(GO:0015988) ATP hydrolysis coupled proton transport(GO:0015991) ATP hydrolysis coupled transmembrane transport(GO:0090662) |
| 0.0 | 0.2 | GO:0038092 | nodal signaling pathway(GO:0038092) |
| 0.0 | 0.5 | GO:1901998 | toxin transport(GO:1901998) |
| 0.0 | 0.2 | GO:0000731 | DNA synthesis involved in DNA repair(GO:0000731) |
| 0.0 | 0.2 | GO:0061099 | negative regulation of protein tyrosine kinase activity(GO:0061099) |
| 0.0 | 0.1 | GO:0010835 | regulation of protein ADP-ribosylation(GO:0010835) telomere assembly(GO:0032202) negative regulation of protein glycosylation(GO:0060051) |
| 0.0 | 1.0 | GO:0098656 | anion transmembrane transport(GO:0098656) |
| 0.0 | 0.2 | GO:0051457 | maintenance of protein location in nucleus(GO:0051457) |
Gene overrepresentation in cellular_component category:
| Log-likelihood per target | Total log-likelihood | Term | Description |
|---|---|---|---|
| 0.8 | 3.3 | GO:0031092 | platelet alpha granule membrane(GO:0031092) |
| 0.5 | 1.5 | GO:0070765 | gamma-secretase complex(GO:0070765) |
| 0.3 | 1.0 | GO:0005899 | insulin receptor complex(GO:0005899) |
| 0.3 | 0.9 | GO:1990415 | Pex17p-Pex14p docking complex(GO:1990415) peroxisomal importomer complex(GO:1990429) |
| 0.3 | 1.2 | GO:0043020 | NADPH oxidase complex(GO:0043020) |
| 0.3 | 2.2 | GO:0032937 | SREBP-SCAP-Insig complex(GO:0032937) |
| 0.3 | 1.7 | GO:0046696 | lipopolysaccharide receptor complex(GO:0046696) |
| 0.2 | 1.6 | GO:0097433 | dense body(GO:0097433) |
| 0.2 | 1.3 | GO:0034366 | spherical high-density lipoprotein particle(GO:0034366) neurofibrillary tangle(GO:0097418) |
| 0.2 | 0.9 | GO:0033093 | Weibel-Palade body(GO:0033093) |
| 0.2 | 1.8 | GO:0001739 | sex chromatin(GO:0001739) |
| 0.2 | 0.5 | GO:0034666 | integrin alpha2-beta1 complex(GO:0034666) |
| 0.2 | 0.7 | GO:0071797 | LUBAC complex(GO:0071797) |
| 0.1 | 0.1 | GO:0070695 | FHF complex(GO:0070695) |
| 0.1 | 0.4 | GO:0042585 | germinal vesicle(GO:0042585) |
| 0.1 | 3.9 | GO:0005868 | cytoplasmic dynein complex(GO:0005868) |
| 0.1 | 1.4 | GO:0032584 | growth cone membrane(GO:0032584) |
| 0.1 | 1.6 | GO:0034045 | pre-autophagosomal structure membrane(GO:0034045) |
| 0.1 | 0.2 | GO:0098799 | outer mitochondrial membrane protein complex(GO:0098799) |
| 0.1 | 0.6 | GO:0042765 | GPI-anchor transamidase complex(GO:0042765) |
| 0.1 | 0.3 | GO:0030905 | retromer, tubulation complex(GO:0030905) |
| 0.1 | 1.8 | GO:0032279 | asymmetric synapse(GO:0032279) |
| 0.1 | 0.5 | GO:0030688 | preribosome, small subunit precursor(GO:0030688) |
| 0.1 | 2.1 | GO:0016581 | NuRD complex(GO:0016581) CHD-type complex(GO:0090545) |
| 0.1 | 0.3 | GO:0005745 | m-AAA complex(GO:0005745) |
| 0.1 | 0.4 | GO:0035032 | phosphatidylinositol 3-kinase complex, class III(GO:0035032) |
| 0.1 | 2.7 | GO:0030131 | clathrin adaptor complex(GO:0030131) |
| 0.1 | 0.2 | GO:0043625 | delta DNA polymerase complex(GO:0043625) |
| 0.1 | 0.5 | GO:0033588 | Elongator holoenzyme complex(GO:0033588) |
| 0.1 | 0.7 | GO:0031931 | TORC1 complex(GO:0031931) |
| 0.1 | 0.2 | GO:0005785 | signal recognition particle receptor complex(GO:0005785) |
| 0.1 | 4.8 | GO:0000118 | histone deacetylase complex(GO:0000118) |
| 0.1 | 1.5 | GO:0001891 | phagocytic cup(GO:0001891) |
| 0.1 | 0.6 | GO:0071439 | clathrin complex(GO:0071439) |
| 0.1 | 0.4 | GO:0071818 | BAT3 complex(GO:0071818) ER membrane insertion complex(GO:0072379) |
| 0.1 | 1.3 | GO:0005605 | basal lamina(GO:0005605) |
| 0.1 | 0.2 | GO:0019815 | B cell receptor complex(GO:0019815) |
| 0.1 | 0.9 | GO:0000421 | autophagosome membrane(GO:0000421) |
| 0.1 | 0.3 | GO:0032777 | Piccolo NuA4 histone acetyltransferase complex(GO:0032777) |
| 0.0 | 0.4 | GO:0000127 | transcription factor TFIIIC complex(GO:0000127) |
| 0.0 | 0.5 | GO:0012507 | ER to Golgi transport vesicle membrane(GO:0012507) |
| 0.0 | 0.4 | GO:0030897 | HOPS complex(GO:0030897) |
| 0.0 | 0.2 | GO:0048237 | rough endoplasmic reticulum lumen(GO:0048237) |
| 0.0 | 0.4 | GO:0045334 | clathrin-coated endocytic vesicle(GO:0045334) |
| 0.0 | 0.2 | GO:0044530 | supraspliceosomal complex(GO:0044530) |
| 0.0 | 0.3 | GO:0060053 | neurofilament cytoskeleton(GO:0060053) |
| 0.0 | 2.3 | GO:0031463 | Cul3-RING ubiquitin ligase complex(GO:0031463) |
| 0.0 | 0.3 | GO:0033180 | proton-transporting V-type ATPase, V1 domain(GO:0033180) |
| 0.0 | 1.1 | GO:0055038 | recycling endosome membrane(GO:0055038) |
| 0.0 | 0.2 | GO:0019907 | cyclin-dependent protein kinase activating kinase holoenzyme complex(GO:0019907) |
| 0.0 | 0.7 | GO:0044300 | cerebellar mossy fiber(GO:0044300) |
| 0.0 | 0.4 | GO:0031527 | filopodium membrane(GO:0031527) |
| 0.0 | 0.3 | GO:0031258 | lamellipodium membrane(GO:0031258) |
| 0.0 | 1.0 | GO:0030660 | Golgi-associated vesicle membrane(GO:0030660) |
| 0.0 | 0.3 | GO:0061700 | GATOR2 complex(GO:0061700) |
| 0.0 | 1.5 | GO:0031201 | SNARE complex(GO:0031201) |
| 0.0 | 0.4 | GO:0017119 | Golgi transport complex(GO:0017119) |
| 0.0 | 0.9 | GO:0005891 | voltage-gated calcium channel complex(GO:0005891) |
| 0.0 | 0.9 | GO:0005719 | nuclear euchromatin(GO:0005719) |
| 0.0 | 0.9 | GO:0005788 | endoplasmic reticulum lumen(GO:0005788) |
| 0.0 | 0.3 | GO:0070419 | nonhomologous end joining complex(GO:0070419) |
| 0.0 | 0.3 | GO:0000407 | pre-autophagosomal structure(GO:0000407) |
| 0.0 | 0.3 | GO:0035631 | CD40 receptor complex(GO:0035631) |
| 0.0 | 0.6 | GO:0000314 | organellar small ribosomal subunit(GO:0000314) mitochondrial small ribosomal subunit(GO:0005763) |
| 0.0 | 0.6 | GO:0032420 | stereocilium(GO:0032420) |
| 0.0 | 0.7 | GO:0005834 | heterotrimeric G-protein complex(GO:0005834) |
| 0.0 | 0.3 | GO:0031430 | M band(GO:0031430) |
| 0.0 | 0.4 | GO:0030904 | retromer complex(GO:0030904) |
| 0.0 | 0.3 | GO:0030673 | axolemma(GO:0030673) |
| 0.0 | 0.2 | GO:0071203 | WASH complex(GO:0071203) |
| 0.0 | 0.5 | GO:0030687 | preribosome, large subunit precursor(GO:0030687) |
| 0.0 | 0.3 | GO:0005721 | pericentric heterochromatin(GO:0005721) |
| 0.0 | 0.1 | GO:0089701 | U2AF(GO:0089701) |
| 0.0 | 0.1 | GO:0060293 | P granule(GO:0043186) pole plasm(GO:0045495) germ plasm(GO:0060293) |
| 0.0 | 0.2 | GO:0005847 | mRNA cleavage and polyadenylation specificity factor complex(GO:0005847) |
| 0.0 | 0.9 | GO:0005758 | mitochondrial intermembrane space(GO:0005758) |
| 0.0 | 2.1 | GO:0005777 | peroxisome(GO:0005777) microbody(GO:0042579) |
| 0.0 | 0.9 | GO:0005604 | basement membrane(GO:0005604) |
| 0.0 | 0.2 | GO:0031307 | integral component of mitochondrial outer membrane(GO:0031307) |
| 0.0 | 0.6 | GO:0005791 | rough endoplasmic reticulum(GO:0005791) |
Gene overrepresentation in molecular_function category:
| Log-likelihood per target | Total log-likelihood | Term | Description |
|---|---|---|---|
| 0.9 | 4.3 | GO:0045503 | dynein light chain binding(GO:0045503) |
| 0.6 | 1.7 | GO:0001875 | lipopolysaccharide receptor activity(GO:0001875) |
| 0.5 | 1.5 | GO:0005534 | galactose binding(GO:0005534) |
| 0.3 | 1.8 | GO:0015277 | kainate selective glutamate receptor activity(GO:0015277) |
| 0.3 | 1.2 | GO:0016175 | superoxide-generating NADPH oxidase activity(GO:0016175) |
| 0.3 | 0.9 | GO:0015038 | glutathione disulfide oxidoreductase activity(GO:0015038) |
| 0.3 | 1.6 | GO:0004887 | thyroid hormone receptor activity(GO:0004887) |
| 0.2 | 1.2 | GO:0001849 | complement component C1q binding(GO:0001849) |
| 0.2 | 0.7 | GO:0001888 | glucuronyl-galactosyl-proteoglycan 4-alpha-N-acetylglucosaminyltransferase activity(GO:0001888) |
| 0.2 | 1.6 | GO:0015091 | ferric iron transmembrane transporter activity(GO:0015091) trivalent inorganic cation transmembrane transporter activity(GO:0072510) |
| 0.2 | 0.9 | GO:0048408 | epidermal growth factor binding(GO:0048408) |
| 0.2 | 0.6 | GO:0005436 | sodium:phosphate symporter activity(GO:0005436) sodium:inorganic phosphate symporter activity(GO:0015319) |
| 0.2 | 2.7 | GO:0008430 | selenium binding(GO:0008430) |
| 0.2 | 0.5 | GO:0005128 | erythropoietin receptor binding(GO:0005128) |
| 0.2 | 0.7 | GO:0019136 | deoxynucleoside kinase activity(GO:0019136) |
| 0.2 | 0.6 | GO:0004954 | icosanoid receptor activity(GO:0004953) prostanoid receptor activity(GO:0004954) prostaglandin receptor activity(GO:0004955) |
| 0.2 | 1.5 | GO:0042500 | aspartic endopeptidase activity, intramembrane cleaving(GO:0042500) |
| 0.1 | 0.6 | GO:0004792 | thiosulfate sulfurtransferase activity(GO:0004792) |
| 0.1 | 0.4 | GO:0008109 | N-acetyllactosaminide beta-1,6-N-acetylglucosaminyltransferase activity(GO:0008109) |
| 0.1 | 1.3 | GO:0031957 | very long-chain fatty acid-CoA ligase activity(GO:0031957) |
| 0.1 | 0.6 | GO:0050265 | RNA uridylyltransferase activity(GO:0050265) |
| 0.1 | 0.4 | GO:0046923 | ER retention sequence binding(GO:0046923) |
| 0.1 | 0.6 | GO:0086080 | connexin binding(GO:0071253) protein binding involved in heterotypic cell-cell adhesion(GO:0086080) |
| 0.1 | 0.5 | GO:0034511 | U3 snoRNA binding(GO:0034511) |
| 0.1 | 0.9 | GO:0019865 | immunoglobulin binding(GO:0019865) |
| 0.1 | 0.3 | GO:0001716 | L-amino-acid oxidase activity(GO:0001716) |
| 0.1 | 0.5 | GO:0004430 | 1-phosphatidylinositol 4-kinase activity(GO:0004430) |
| 0.1 | 0.3 | GO:0097003 | adipokinetic hormone receptor activity(GO:0097003) |
| 0.1 | 2.3 | GO:0005385 | zinc ion transmembrane transporter activity(GO:0005385) |
| 0.1 | 0.4 | GO:0019961 | interferon binding(GO:0019961) |
| 0.1 | 1.0 | GO:0005225 | volume-sensitive anion channel activity(GO:0005225) |
| 0.1 | 1.7 | GO:0051787 | misfolded protein binding(GO:0051787) |
| 0.1 | 0.3 | GO:0070012 | oligopeptidase activity(GO:0070012) |
| 0.1 | 0.3 | GO:0004046 | aminoacylase activity(GO:0004046) |
| 0.1 | 0.4 | GO:0005166 | neurotrophin p75 receptor binding(GO:0005166) |
| 0.1 | 0.3 | GO:1990460 | leptin receptor binding(GO:1990460) |
| 0.1 | 0.5 | GO:0001665 | alpha-N-acetylgalactosaminide alpha-2,6-sialyltransferase activity(GO:0001665) |
| 0.1 | 1.6 | GO:0080025 | phosphatidylinositol-3,5-bisphosphate binding(GO:0080025) |
| 0.1 | 0.6 | GO:0004579 | dolichyl-diphosphooligosaccharide-protein glycotransferase activity(GO:0004579) |
| 0.1 | 3.1 | GO:0050840 | extracellular matrix binding(GO:0050840) |
| 0.1 | 0.2 | GO:0015143 | urate transmembrane transporter activity(GO:0015143) salt transmembrane transporter activity(GO:1901702) |
| 0.1 | 0.2 | GO:0004832 | valine-tRNA ligase activity(GO:0004832) |
| 0.1 | 0.2 | GO:0030274 | LIM domain binding(GO:0030274) |
| 0.1 | 0.4 | GO:0003958 | NADPH-hemoprotein reductase activity(GO:0003958) |
| 0.1 | 0.2 | GO:0046899 | nucleoside triphosphate adenylate kinase activity(GO:0046899) |
| 0.1 | 0.3 | GO:0016936 | galactoside binding(GO:0016936) |
| 0.0 | 0.1 | GO:0015217 | ADP transmembrane transporter activity(GO:0015217) coenzyme A transmembrane transporter activity(GO:0015228) adenosine 3',5'-bisphosphate transmembrane transporter activity(GO:0071077) AMP transmembrane transporter activity(GO:0080122) |
| 0.0 | 0.1 | GO:0004449 | isocitrate dehydrogenase (NAD+) activity(GO:0004449) |
| 0.0 | 1.1 | GO:0070273 | phosphatidylinositol-4-phosphate binding(GO:0070273) |
| 0.0 | 0.7 | GO:0035612 | AP-2 adaptor complex binding(GO:0035612) |
| 0.0 | 1.2 | GO:0005164 | tumor necrosis factor receptor binding(GO:0005164) |
| 0.0 | 0.4 | GO:0071933 | Arp2/3 complex binding(GO:0071933) |
| 0.0 | 0.4 | GO:0003993 | acid phosphatase activity(GO:0003993) |
| 0.0 | 0.6 | GO:0034450 | ubiquitin-ubiquitin ligase activity(GO:0034450) |
| 0.0 | 0.9 | GO:0050750 | low-density lipoprotein particle receptor binding(GO:0050750) |
| 0.0 | 0.3 | GO:0051718 | DNA (cytosine-5-)-methyltransferase activity(GO:0003886) DNA (cytosine-5-)-methyltransferase activity, acting on CpG substrates(GO:0051718) |
| 0.0 | 0.3 | GO:0035368 | selenocysteine insertion sequence binding(GO:0035368) |
| 0.0 | 0.5 | GO:0034951 | pivalyl-CoA mutase activity(GO:0034784) o-hydroxylaminobenzoate mutase activity(GO:0034951) lupeol synthase activity(GO:0042299) beta-amyrin synthase activity(GO:0042300) baruol synthase activity(GO:0080011) |
| 0.0 | 5.0 | GO:0005089 | Rho guanyl-nucleotide exchange factor activity(GO:0005089) |
| 0.0 | 0.7 | GO:0017166 | vinculin binding(GO:0017166) |
| 0.0 | 1.8 | GO:0005484 | SNAP receptor activity(GO:0005484) |
| 0.0 | 0.1 | GO:0008297 | single-stranded DNA exodeoxyribonuclease activity(GO:0008297) |
| 0.0 | 0.2 | GO:0005047 | signal recognition particle binding(GO:0005047) |
| 0.0 | 0.2 | GO:0004726 | non-membrane spanning protein tyrosine phosphatase activity(GO:0004726) |
| 0.0 | 2.1 | GO:0030276 | clathrin binding(GO:0030276) |
| 0.0 | 1.6 | GO:0045296 | cadherin binding(GO:0045296) |
| 0.0 | 0.4 | GO:0004596 | peptide alpha-N-acetyltransferase activity(GO:0004596) |
| 0.0 | 0.5 | GO:0004438 | phosphatidylinositol-3-phosphatase activity(GO:0004438) |
| 0.0 | 0.3 | GO:0052872 | 3-(3-hydroxyphenyl)propionate hydroxylase activity(GO:0008688) 4-chlorobenzaldehyde oxidase activity(GO:0018471) 3,5-xylenol methylhydroxylase activity(GO:0018630) phenylacetate hydroxylase activity(GO:0018631) 4-nitrophenol 4-monooxygenase activity(GO:0018632) dimethyl sulfide monooxygenase activity(GO:0018633) alpha-pinene monooxygenase [NADH] activity(GO:0018634) phenanthrene 9,10-monooxygenase activity(GO:0018636) 1-hydroxy-2-naphthoate hydroxylase activity(GO:0018637) toluene 4-monooxygenase activity(GO:0018638) xylene monooxygenase activity(GO:0018639) dibenzothiophene monooxygenase activity(GO:0018640) 6-hydroxy-3-methyl-2-oxo-1,2-dihydroquinoline 6-monooxygenase activity(GO:0018641) chlorophenol 4-monooxygenase activity(GO:0018642) carbon disulfide oxygenase activity(GO:0018643) toluene 2-monooxygenase activity(GO:0018644) 1-hydroxy-2-oxolimonene 1,2-monooxygenase activity(GO:0018646) phenanthrene 1,2-monooxygenase activity(GO:0018647) tetrahydrofuran hydroxylase activity(GO:0018649) styrene monooxygenase activity(GO:0018650) toluene-4-sulfonate monooxygenase activity(GO:0018651) toluene-sulfonate methyl-monooxygenase activity(GO:0018652) 3-methyl-2-oxo-1,2-dihydroquinoline 6-monooxygenase activity(GO:0018653) 2-hydroxy-phenylacetate hydroxylase activity(GO:0018654) 2-oxo-delta3-4,5,5-trimethylcyclopentenylacetyl-CoA 1,2-monooxygenase activity(GO:0018655) phenanthrene 3,4-monooxygenase activity(GO:0018656) toluene 3-monooxygenase activity(GO:0018657) 4-hydroxyphenylacetate,NADH:oxygen oxidoreductase (3-hydroxylating) activity(GO:0018660) limonene monooxygenase activity(GO:0019113) 2-methylnaphthalene hydroxylase activity(GO:0034526) 1-methylnaphthalene hydroxylase activity(GO:0034534) bisphenol A hydroxylase A activity(GO:0034560) salicylate 5-hydroxylase activity(GO:0034785) isobutylamine N-hydroxylase activity(GO:0034791) branched-chain dodecylbenzene sulfonate monooxygenase activity(GO:0034802) 3-HSA hydroxylase activity(GO:0034819) 4-hydroxypyridine-3-hydroxylase activity(GO:0034894) 2-octaprenyl-3-methyl-6-methoxy-1,4-benzoquinol hydroxylase activity(GO:0043719) 6-hydroxynicotinate 3-monooxygenase activity(GO:0043731) tocotrienol omega-hydroxylase activity(GO:0052872) thalianol hydroxylase activity(GO:0080014) |
| 0.0 | 0.3 | GO:0035312 | 5'-3' exodeoxyribonuclease activity(GO:0035312) |
| 0.0 | 0.2 | GO:0051959 | dynein light intermediate chain binding(GO:0051959) |
| 0.0 | 3.2 | GO:0008013 | beta-catenin binding(GO:0008013) |
| 0.0 | 0.1 | GO:0045131 | pre-mRNA branch point binding(GO:0045131) |
| 0.0 | 0.1 | GO:0001165 | RNA polymerase I upstream control element sequence-specific DNA binding(GO:0001165) |
| 0.0 | 0.3 | GO:0004176 | ATP-dependent peptidase activity(GO:0004176) |
| 0.0 | 0.4 | GO:0005035 | tumor necrosis factor-activated receptor activity(GO:0005031) death receptor activity(GO:0005035) |
| 0.0 | 1.0 | GO:0005158 | insulin receptor binding(GO:0005158) |
| 0.0 | 0.5 | GO:0003708 | retinoic acid receptor activity(GO:0003708) |
| 0.0 | 0.3 | GO:0005078 | MAP-kinase scaffold activity(GO:0005078) |
| 0.0 | 0.3 | GO:0043325 | phosphatidylinositol-3,4-bisphosphate binding(GO:0043325) |
| 0.0 | 0.1 | GO:0003835 | beta-galactoside alpha-2,6-sialyltransferase activity(GO:0003835) |
| 0.0 | 0.7 | GO:0045502 | dynein binding(GO:0045502) |
| 0.0 | 0.2 | GO:0005149 | interleukin-1 receptor binding(GO:0005149) |
| 0.0 | 1.3 | GO:0005125 | cytokine activity(GO:0005125) |
| 0.0 | 2.8 | GO:0017137 | Rab GTPase binding(GO:0017137) |
| 0.0 | 0.1 | GO:0097100 | oxidized purine nucleobase lesion DNA N-glycosylase activity(GO:0008534) supercoiled DNA binding(GO:0097100) |
| 0.0 | 0.2 | GO:0043274 | phospholipase binding(GO:0043274) |
| 0.0 | 0.3 | GO:0008093 | cytoskeletal adaptor activity(GO:0008093) |
| 0.0 | 0.4 | GO:0003841 | 1-acylglycerol-3-phosphate O-acyltransferase activity(GO:0003841) |
| 0.0 | 0.4 | GO:0004012 | phospholipid-translocating ATPase activity(GO:0004012) |
| 0.0 | 0.3 | GO:0032266 | phosphatidylinositol-3-phosphate binding(GO:0032266) |
| 0.0 | 0.1 | GO:0005138 | interleukin-6 receptor binding(GO:0005138) |
| 0.0 | 1.4 | GO:0008083 | growth factor activity(GO:0008083) |
| 0.0 | 0.3 | GO:0031702 | angiotensin receptor binding(GO:0031701) type 1 angiotensin receptor binding(GO:0031702) |
| 0.0 | 0.3 | GO:0044653 | trehalase activity(GO:0015927) dextrin alpha-glucosidase activity(GO:0044653) starch alpha-glucosidase activity(GO:0044654) beta-glucanase activity(GO:0052736) beta-6-sulfate-N-acetylglucosaminidase activity(GO:0052769) glucan endo-1,4-beta-glucosidase activity(GO:0052859) |
| 0.0 | 0.6 | GO:0004683 | calmodulin-dependent protein kinase activity(GO:0004683) |
| 0.0 | 0.3 | GO:0000993 | RNA polymerase II core binding(GO:0000993) |
| 0.0 | 0.6 | GO:0003923 | GPI-anchor transamidase activity(GO:0003923) |
| 0.0 | 0.2 | GO:0031418 | L-ascorbic acid binding(GO:0031418) |
| 0.0 | 0.1 | GO:0090599 | alpha-glucosidase activity(GO:0090599) |
| 0.0 | 0.1 | GO:0030296 | protein tyrosine kinase activator activity(GO:0030296) |
| 0.0 | 0.3 | GO:0031690 | adrenergic receptor binding(GO:0031690) |
| 0.0 | 0.3 | GO:0046961 | proton-transporting ATPase activity, rotational mechanism(GO:0046961) |
| 0.0 | 0.2 | GO:0070628 | proteasome binding(GO:0070628) |
| 0.0 | 0.1 | GO:0008140 | cAMP response element binding protein binding(GO:0008140) CCR chemokine receptor binding(GO:0048020) |
| 0.0 | 0.0 | GO:0035252 | UDP-xylosyltransferase activity(GO:0035252) |
| 0.0 | 1.4 | GO:0017124 | SH3 domain binding(GO:0017124) |
| 0.0 | 0.2 | GO:0008376 | acetylgalactosaminyltransferase activity(GO:0008376) |