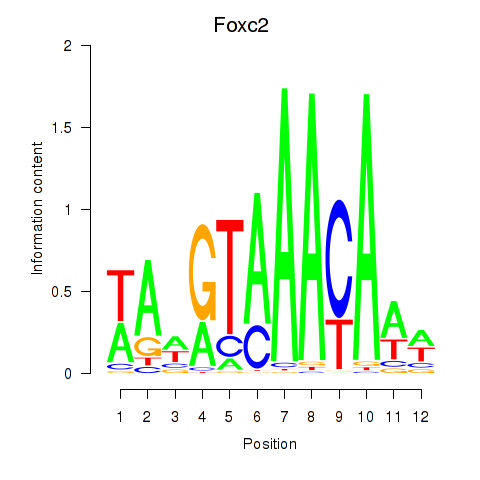
| 1.1 |
3.3 |
GO:0038095 |
positive regulation of mast cell cytokine production(GO:0032765) Fc-epsilon receptor signaling pathway(GO:0038095) |
| 1.0 |
3.9 |
GO:1901894 |
regulation of calcium-transporting ATPase activity(GO:1901894) |
| 0.3 |
4.9 |
GO:0021684 |
cerebellar granular layer formation(GO:0021684) cerebellar granule cell differentiation(GO:0021707) |
| 0.3 |
1.7 |
GO:0048133 |
germ-line stem cell division(GO:0042078) male germ-line stem cell asymmetric division(GO:0048133) germline stem cell asymmetric division(GO:0098728) |
| 0.3 |
3.4 |
GO:0007379 |
segment specification(GO:0007379) |
| 0.3 |
0.9 |
GO:1902524 |
negative regulation of interferon-alpha production(GO:0032687) interferon-alpha biosynthetic process(GO:0045349) regulation of interferon-alpha biosynthetic process(GO:0045354) negative regulation of interferon-beta biosynthetic process(GO:0045358) positive regulation of protein K48-linked ubiquitination(GO:1902524) |
| 0.3 |
0.9 |
GO:0050925 |
negative regulation of negative chemotaxis(GO:0050925) |
| 0.3 |
0.9 |
GO:0010986 |
positive regulation of lipoprotein particle clearance(GO:0010986) |
| 0.2 |
0.7 |
GO:0042998 |
positive regulation of Golgi to plasma membrane protein transport(GO:0042998) |
| 0.2 |
1.0 |
GO:0036438 |
maintenance of lens transparency(GO:0036438) |
| 0.2 |
1.4 |
GO:0035948 |
positive regulation of gluconeogenesis by positive regulation of transcription from RNA polymerase II promoter(GO:0035948) regulation of cellular ketone metabolic process by positive regulation of transcription from RNA polymerase II promoter(GO:0072366) |
| 0.2 |
2.0 |
GO:0071763 |
nuclear membrane organization(GO:0071763) |
| 0.2 |
1.6 |
GO:0009404 |
toxin metabolic process(GO:0009404) |
| 0.2 |
0.5 |
GO:0071492 |
cellular response to UV-A(GO:0071492) |
| 0.2 |
0.8 |
GO:0072015 |
glomerular visceral epithelial cell development(GO:0072015) glomerular epithelial cell development(GO:0072310) |
| 0.1 |
1.3 |
GO:0014807 |
regulation of somitogenesis(GO:0014807) |
| 0.1 |
0.8 |
GO:0097368 |
establishment of Sertoli cell barrier(GO:0097368) |
| 0.1 |
1.1 |
GO:0060665 |
regulation of branching involved in salivary gland morphogenesis by mesenchymal-epithelial signaling(GO:0060665) |
| 0.1 |
0.6 |
GO:0021993 |
initiation of neural tube closure(GO:0021993) |
| 0.1 |
0.7 |
GO:1903056 |
regulation of lens fiber cell differentiation(GO:1902746) positive regulation of lens fiber cell differentiation(GO:1902748) regulation of melanosome organization(GO:1903056) |
| 0.1 |
3.3 |
GO:0032728 |
positive regulation of interferon-beta production(GO:0032728) |
| 0.1 |
0.4 |
GO:1901668 |
regulation of superoxide dismutase activity(GO:1901668) |
| 0.1 |
0.7 |
GO:0061368 |
behavioral response to chemical pain(GO:0061366) behavioral response to formalin induced pain(GO:0061368) |
| 0.1 |
0.4 |
GO:0046684 |
response to pyrethroid(GO:0046684) |
| 0.1 |
0.8 |
GO:0010748 |
negative regulation of plasma membrane long-chain fatty acid transport(GO:0010748) positive regulation of fatty acid beta-oxidation(GO:0032000) |
| 0.1 |
0.4 |
GO:0002317 |
plasma cell differentiation(GO:0002317) |
| 0.1 |
1.1 |
GO:0006883 |
cellular sodium ion homeostasis(GO:0006883) |
| 0.1 |
0.5 |
GO:0006390 |
transcription from mitochondrial promoter(GO:0006390) |
| 0.0 |
3.2 |
GO:0043268 |
positive regulation of potassium ion transport(GO:0043268) |
| 0.0 |
0.2 |
GO:0008295 |
spermidine biosynthetic process(GO:0008295) |
| 0.0 |
0.5 |
GO:0070574 |
cadmium ion transport(GO:0015691) cadmium ion transmembrane transport(GO:0070574) |
| 0.0 |
0.5 |
GO:1901621 |
negative regulation of smoothened signaling pathway involved in dorsal/ventral neural tube patterning(GO:1901621) |
| 0.0 |
1.0 |
GO:0048268 |
clathrin coat assembly(GO:0048268) |
| 0.0 |
0.6 |
GO:0051382 |
kinetochore assembly(GO:0051382) |
| 0.0 |
0.4 |
GO:0060613 |
fat pad development(GO:0060613) |
| 0.0 |
0.2 |
GO:1903599 |
positive regulation of mitophagy(GO:1903599) |
| 0.0 |
0.5 |
GO:0070842 |
aggresome assembly(GO:0070842) |
| 0.0 |
0.2 |
GO:0038018 |
Wnt receptor catabolic process(GO:0038018) |
| 0.0 |
0.3 |
GO:0035520 |
monoubiquitinated protein deubiquitination(GO:0035520) |
| 0.0 |
0.2 |
GO:0018243 |
protein O-linked glycosylation via threonine(GO:0018243) |
| 0.0 |
0.2 |
GO:0007221 |
positive regulation of transcription of Notch receptor target(GO:0007221) |
| 0.0 |
0.1 |
GO:0015886 |
heme transport(GO:0015886) |
| 0.0 |
0.3 |
GO:0045792 |
negative regulation of cell size(GO:0045792) |
| 0.0 |
0.2 |
GO:0006488 |
dolichol-linked oligosaccharide biosynthetic process(GO:0006488) |
| 0.0 |
0.2 |
GO:0031642 |
negative regulation of myelination(GO:0031642) |
| 0.0 |
0.4 |
GO:0030213 |
hyaluronan biosynthetic process(GO:0030213) |
| 0.0 |
1.6 |
GO:0021766 |
hippocampus development(GO:0021766) |
| 0.0 |
0.1 |
GO:0032488 |
Cdc42 protein signal transduction(GO:0032488) |
| 0.0 |
0.2 |
GO:0006268 |
DNA unwinding involved in DNA replication(GO:0006268) |
| 0.0 |
0.2 |
GO:0002495 |
antigen processing and presentation of peptide antigen via MHC class II(GO:0002495) antigen processing and presentation of peptide or polysaccharide antigen via MHC class II(GO:0002504) |
| 0.0 |
0.5 |
GO:0006376 |
mRNA splice site selection(GO:0006376) |
| 0.0 |
0.1 |
GO:0001927 |
exocyst assembly(GO:0001927) |
| 0.0 |
0.1 |
GO:0019800 |
peptide cross-linking via chondroitin 4-sulfate glycosaminoglycan(GO:0019800) |
| 0.0 |
0.1 |
GO:0042117 |
monocyte activation(GO:0042117) |
| 0.0 |
0.3 |
GO:0007205 |
protein kinase C-activating G-protein coupled receptor signaling pathway(GO:0007205) |
| 0.0 |
0.2 |
GO:0001553 |
luteinization(GO:0001553) |


