| 1.4 |
15.3 |
GO:0042572 |
retinol metabolic process(GO:0042572) |
| 1.0 |
3.9 |
GO:0070327 |
thyroid hormone transport(GO:0070327) |
| 0.9 |
2.8 |
GO:0090425 |
hepatocyte cell migration(GO:0002194) branching involved in pancreas morphogenesis(GO:0061114) acinar cell differentiation(GO:0090425) positive regulation of forebrain neuron differentiation(GO:2000979) |
| 0.9 |
2.7 |
GO:1900039 |
positive regulation of cellular response to hypoxia(GO:1900039) |
| 0.9 |
3.5 |
GO:0071449 |
cellular response to lipid hydroperoxide(GO:0071449) |
| 0.9 |
2.6 |
GO:0045404 |
positive regulation of interleukin-4 biosynthetic process(GO:0045404) |
| 0.8 |
3.3 |
GO:0043490 |
malate-aspartate shuttle(GO:0043490) |
| 0.8 |
3.2 |
GO:1901204 |
regulation of adrenergic receptor signaling pathway involved in heart process(GO:1901204) |
| 0.8 |
2.4 |
GO:0046110 |
xanthine metabolic process(GO:0046110) |
| 0.7 |
3.5 |
GO:0021856 |
cerebral cortex tangential migration using cell-axon interactions(GO:0021824) gonadotrophin-releasing hormone neuronal migration to the hypothalamus(GO:0021828) hypothalamic tangential migration using cell-axon interactions(GO:0021856) facioacoustic ganglion development(GO:1903375) |
| 0.7 |
2.7 |
GO:2000795 |
negative regulation of epithelial cell proliferation involved in lung morphogenesis(GO:2000795) |
| 0.6 |
3.1 |
GO:0051611 |
negative regulation of neurotransmitter uptake(GO:0051581) serotonin uptake(GO:0051610) regulation of serotonin uptake(GO:0051611) negative regulation of serotonin uptake(GO:0051612) |
| 0.6 |
1.7 |
GO:0001580 |
detection of chemical stimulus involved in sensory perception of bitter taste(GO:0001580) |
| 0.6 |
5.8 |
GO:0015721 |
bile acid and bile salt transport(GO:0015721) |
| 0.6 |
2.8 |
GO:0045578 |
negative regulation of B cell differentiation(GO:0045578) |
| 0.5 |
1.6 |
GO:1902083 |
negative regulation of peptidyl-cysteine S-nitrosylation(GO:1902083) |
| 0.5 |
1.6 |
GO:0006553 |
lysine metabolic process(GO:0006553) |
| 0.5 |
1.6 |
GO:0070671 |
response to interleukin-12(GO:0070671) |
| 0.5 |
4.1 |
GO:0048625 |
myoblast fate commitment(GO:0048625) |
| 0.5 |
2.0 |
GO:1901894 |
regulation of calcium-transporting ATPase activity(GO:1901894) |
| 0.5 |
1.4 |
GO:0048686 |
regulation of sprouting of injured axon(GO:0048686) regulation of axon extension involved in regeneration(GO:0048690) |
| 0.5 |
2.8 |
GO:0010528 |
regulation of transposition(GO:0010528) negative regulation of transposition(GO:0010529) |
| 0.5 |
1.4 |
GO:0032650 |
regulation of interleukin-1 alpha production(GO:0032650) positive regulation of interleukin-1 alpha production(GO:0032730) interleukin-1 alpha secretion(GO:0050703) |
| 0.5 |
5.1 |
GO:0021684 |
cerebellar granular layer formation(GO:0021684) cerebellar granule cell differentiation(GO:0021707) |
| 0.4 |
1.3 |
GO:0036500 |
ATF6-mediated unfolded protein response(GO:0036500) |
| 0.4 |
2.6 |
GO:1903887 |
motile primary cilium assembly(GO:1903887) |
| 0.4 |
0.9 |
GO:0072553 |
terminal button organization(GO:0072553) |
| 0.4 |
0.4 |
GO:0003134 |
BMP signaling pathway involved in heart induction(GO:0003130) endodermal-mesodermal cell signaling(GO:0003133) endodermal-mesodermal cell signaling involved in heart induction(GO:0003134) |
| 0.4 |
1.2 |
GO:0048850 |
hypophysis morphogenesis(GO:0048850) |
| 0.4 |
1.2 |
GO:1900149 |
positive regulation of Schwann cell migration(GO:1900149) |
| 0.4 |
2.3 |
GO:1903056 |
regulation of lens fiber cell differentiation(GO:1902746) positive regulation of lens fiber cell differentiation(GO:1902748) regulation of melanosome organization(GO:1903056) |
| 0.4 |
0.4 |
GO:1900275 |
negative regulation of phospholipase C activity(GO:1900275) |
| 0.4 |
0.7 |
GO:0072103 |
renal system vasculature morphogenesis(GO:0061438) kidney vasculature morphogenesis(GO:0061439) glomerulus vasculature morphogenesis(GO:0072103) glomerular capillary formation(GO:0072104) |
| 0.4 |
1.4 |
GO:1990743 |
protein sialylation(GO:1990743) |
| 0.4 |
1.4 |
GO:0010693 |
negative regulation of alkaline phosphatase activity(GO:0010693) |
| 0.4 |
1.4 |
GO:0071475 |
cellular hyperosmotic salinity response(GO:0071475) |
| 0.4 |
1.1 |
GO:0038095 |
Fc-epsilon receptor signaling pathway(GO:0038095) |
| 0.3 |
3.1 |
GO:0060665 |
regulation of branching involved in salivary gland morphogenesis by mesenchymal-epithelial signaling(GO:0060665) |
| 0.3 |
0.6 |
GO:0098735 |
positive regulation of the force of heart contraction(GO:0098735) |
| 0.3 |
0.3 |
GO:0035457 |
cellular response to interferon-alpha(GO:0035457) |
| 0.3 |
1.0 |
GO:0030421 |
defecation(GO:0030421) |
| 0.3 |
0.6 |
GO:0031915 |
positive regulation of synaptic plasticity(GO:0031915) |
| 0.3 |
1.2 |
GO:1903288 |
regulation of potassium ion import(GO:1903286) positive regulation of potassium ion import(GO:1903288) |
| 0.3 |
0.9 |
GO:0046881 |
positive regulation of follicle-stimulating hormone secretion(GO:0046881) |
| 0.3 |
0.9 |
GO:2001187 |
positive regulation of CD8-positive, alpha-beta T cell activation(GO:2001187) |
| 0.3 |
1.5 |
GO:0075136 |
response to defenses of other organism involved in symbiotic interaction(GO:0052173) response to host defenses(GO:0052200) response to host(GO:0075136) |
| 0.3 |
0.9 |
GO:1903225 |
negative regulation of endodermal cell differentiation(GO:1903225) |
| 0.3 |
0.9 |
GO:0060708 |
spongiotrophoblast differentiation(GO:0060708) |
| 0.3 |
0.6 |
GO:1902837 |
amino acid import into cell(GO:1902837) |
| 0.3 |
0.9 |
GO:0014877 |
response to inactivity(GO:0014854) response to muscle inactivity(GO:0014870) response to muscle inactivity involved in regulation of muscle adaptation(GO:0014877) response to denervation involved in regulation of muscle adaptation(GO:0014894) |
| 0.3 |
0.9 |
GO:0006556 |
S-adenosylmethionine biosynthetic process(GO:0006556) |
| 0.3 |
1.2 |
GO:0060282 |
positive regulation of oocyte development(GO:0060282) |
| 0.3 |
0.9 |
GO:0021852 |
pyramidal neuron migration(GO:0021852) |
| 0.3 |
2.5 |
GO:0042118 |
endothelial cell activation(GO:0042118) |
| 0.3 |
1.4 |
GO:0034441 |
plasma lipoprotein particle oxidation(GO:0034441) |
| 0.3 |
0.3 |
GO:0060662 |
tube lumen cavitation(GO:0060605) salivary gland cavitation(GO:0060662) |
| 0.3 |
0.8 |
GO:1902460 |
regulation of mesenchymal stem cell proliferation(GO:1902460) positive regulation of mesenchymal stem cell proliferation(GO:1902462) |
| 0.3 |
0.6 |
GO:0061343 |
cell adhesion involved in heart morphogenesis(GO:0061343) |
| 0.3 |
0.6 |
GO:1904395 |
positive regulation of postsynaptic membrane organization(GO:1901628) positive regulation of receptor clustering(GO:1903911) regulation of skeletal muscle acetylcholine-gated channel clustering(GO:1904393) positive regulation of skeletal muscle acetylcholine-gated channel clustering(GO:1904395) |
| 0.3 |
1.1 |
GO:0032489 |
regulation of Cdc42 protein signal transduction(GO:0032489) |
| 0.3 |
3.6 |
GO:1901629 |
regulation of presynaptic membrane organization(GO:1901629) |
| 0.3 |
0.8 |
GO:0043553 |
negative regulation of phosphatidylinositol 3-kinase activity(GO:0043553) |
| 0.3 |
0.8 |
GO:0006041 |
glucosamine metabolic process(GO:0006041) |
| 0.3 |
1.1 |
GO:0097114 |
NMDA glutamate receptor clustering(GO:0097114) |
| 0.3 |
1.6 |
GO:0007021 |
tubulin complex assembly(GO:0007021) |
| 0.3 |
0.8 |
GO:0051933 |
amino acid neurotransmitter reuptake(GO:0051933) glutamate reuptake(GO:0051935) |
| 0.3 |
0.8 |
GO:0033860 |
regulation of NAD(P)H oxidase activity(GO:0033860) |
| 0.3 |
0.5 |
GO:0021508 |
floor plate formation(GO:0021508) floor plate morphogenesis(GO:0033505) |
| 0.3 |
0.8 |
GO:0008228 |
opsonization(GO:0008228) |
| 0.3 |
0.8 |
GO:0019482 |
beta-alanine metabolic process(GO:0019482) |
| 0.3 |
4.1 |
GO:2000096 |
positive regulation of Wnt signaling pathway, planar cell polarity pathway(GO:2000096) |
| 0.3 |
1.0 |
GO:2000525 |
regulation of T cell costimulation(GO:2000523) positive regulation of T cell costimulation(GO:2000525) |
| 0.3 |
0.8 |
GO:0006404 |
RNA import into nucleus(GO:0006404) |
| 0.2 |
1.2 |
GO:0045918 |
negative regulation of cytolysis(GO:0045918) |
| 0.2 |
1.7 |
GO:0001887 |
selenium compound metabolic process(GO:0001887) |
| 0.2 |
0.2 |
GO:1901252 |
regulation of intracellular transport of viral material(GO:1901252) |
| 0.2 |
0.5 |
GO:0097264 |
self proteolysis(GO:0097264) |
| 0.2 |
2.0 |
GO:0071732 |
cellular response to nitric oxide(GO:0071732) |
| 0.2 |
0.2 |
GO:0071280 |
cellular response to copper ion(GO:0071280) |
| 0.2 |
1.2 |
GO:0034421 |
post-translational protein acetylation(GO:0034421) |
| 0.2 |
2.2 |
GO:0006390 |
transcription from mitochondrial promoter(GO:0006390) |
| 0.2 |
1.0 |
GO:0042938 |
dipeptide transport(GO:0042938) |
| 0.2 |
1.7 |
GO:0001867 |
complement activation, lectin pathway(GO:0001867) |
| 0.2 |
0.9 |
GO:0090024 |
negative regulation of granulocyte chemotaxis(GO:0071623) negative regulation of neutrophil chemotaxis(GO:0090024) negative regulation of neutrophil migration(GO:1902623) |
| 0.2 |
0.7 |
GO:0045113 |
integrin biosynthetic process(GO:0045112) regulation of integrin biosynthetic process(GO:0045113) |
| 0.2 |
1.6 |
GO:0017196 |
N-terminal peptidyl-methionine acetylation(GO:0017196) |
| 0.2 |
1.2 |
GO:0036438 |
maintenance of lens transparency(GO:0036438) |
| 0.2 |
0.5 |
GO:0060638 |
mesenchymal-epithelial cell signaling(GO:0060638) |
| 0.2 |
3.6 |
GO:2001275 |
positive regulation of glucose import in response to insulin stimulus(GO:2001275) |
| 0.2 |
0.9 |
GO:0060762 |
regulation of branching involved in mammary gland duct morphogenesis(GO:0060762) |
| 0.2 |
0.5 |
GO:0086046 |
membrane depolarization during SA node cell action potential(GO:0086046) |
| 0.2 |
0.5 |
GO:0030240 |
skeletal muscle thin filament assembly(GO:0030240) |
| 0.2 |
1.6 |
GO:0015862 |
uridine transport(GO:0015862) |
| 0.2 |
1.1 |
GO:0070278 |
extracellular matrix constituent secretion(GO:0070278) |
| 0.2 |
1.1 |
GO:1900170 |
negative regulation of glucocorticoid mediated signaling pathway(GO:1900170) |
| 0.2 |
0.9 |
GO:0006883 |
cellular sodium ion homeostasis(GO:0006883) |
| 0.2 |
0.7 |
GO:0044028 |
DNA hypomethylation(GO:0044028) hypomethylation of CpG island(GO:0044029) |
| 0.2 |
8.0 |
GO:0032728 |
positive regulation of interferon-beta production(GO:0032728) |
| 0.2 |
2.2 |
GO:1903608 |
protein localization to cytoplasmic stress granule(GO:1903608) |
| 0.2 |
0.4 |
GO:0036518 |
chemorepulsion of dopaminergic neuron axon(GO:0036518) |
| 0.2 |
0.4 |
GO:0030321 |
transepithelial chloride transport(GO:0030321) |
| 0.2 |
0.7 |
GO:0030210 |
heparin biosynthetic process(GO:0030210) |
| 0.2 |
0.4 |
GO:1900377 |
negative regulation of melanin biosynthetic process(GO:0048022) negative regulation of secondary metabolite biosynthetic process(GO:1900377) |
| 0.2 |
0.2 |
GO:1905050 |
positive regulation of metallopeptidase activity(GO:1905050) |
| 0.2 |
0.6 |
GO:0035864 |
response to potassium ion(GO:0035864) cellular response to potassium ion(GO:0035865) |
| 0.2 |
0.2 |
GO:0045590 |
negative regulation of regulatory T cell differentiation(GO:0045590) |
| 0.2 |
0.4 |
GO:1905065 |
positive regulation of vascular smooth muscle cell differentiation(GO:1905065) |
| 0.2 |
0.2 |
GO:2000504 |
positive regulation of blood vessel remodeling(GO:2000504) |
| 0.2 |
0.2 |
GO:0002566 |
somatic diversification of immune receptors via somatic mutation(GO:0002566) somatic hypermutation of immunoglobulin genes(GO:0016446) |
| 0.2 |
0.6 |
GO:0042505 |
tyrosine phosphorylation of Stat6 protein(GO:0042505) regulation of tyrosine phosphorylation of Stat6 protein(GO:0042525) |
| 0.2 |
1.0 |
GO:0031293 |
membrane protein intracellular domain proteolysis(GO:0031293) |
| 0.2 |
0.6 |
GO:0034287 |
detection of carbohydrate stimulus(GO:0009730) detection of hexose stimulus(GO:0009732) detection of monosaccharide stimulus(GO:0034287) detection of glucose(GO:0051594) |
| 0.2 |
1.8 |
GO:0035887 |
aortic smooth muscle cell differentiation(GO:0035887) |
| 0.2 |
1.2 |
GO:0006046 |
N-acetylglucosamine catabolic process(GO:0006046) |
| 0.2 |
1.0 |
GO:0032911 |
nerve growth factor production(GO:0032902) negative regulation of transforming growth factor beta1 production(GO:0032911) |
| 0.2 |
0.6 |
GO:2000314 |
negative regulation of fibroblast growth factor receptor signaling pathway involved in neural plate anterior/posterior pattern formation(GO:2000314) |
| 0.2 |
0.4 |
GO:0010519 |
negative regulation of phospholipase activity(GO:0010519) |
| 0.2 |
0.6 |
GO:0042138 |
meiotic DNA double-strand break formation(GO:0042138) |
| 0.2 |
1.6 |
GO:0097460 |
ferrous iron import into cell(GO:0097460) |
| 0.2 |
0.6 |
GO:1902528 |
regulation of protein linear polyubiquitination(GO:1902528) positive regulation of protein linear polyubiquitination(GO:1902530) |
| 0.2 |
0.9 |
GO:0042538 |
hyperosmotic salinity response(GO:0042538) |
| 0.2 |
0.8 |
GO:0046013 |
regulation of T cell homeostatic proliferation(GO:0046013) |
| 0.2 |
0.6 |
GO:0050904 |
diapedesis(GO:0050904) |
| 0.2 |
0.4 |
GO:0048861 |
leukemia inhibitory factor signaling pathway(GO:0048861) |
| 0.2 |
0.6 |
GO:1902524 |
positive regulation of protein K48-linked ubiquitination(GO:1902524) |
| 0.2 |
0.7 |
GO:0060032 |
notochord regression(GO:0060032) |
| 0.2 |
0.5 |
GO:0043379 |
memory T cell differentiation(GO:0043379) |
| 0.2 |
0.5 |
GO:0032701 |
negative regulation of interleukin-18 production(GO:0032701) |
| 0.2 |
0.2 |
GO:0090271 |
positive regulation of fibroblast growth factor production(GO:0090271) |
| 0.2 |
0.4 |
GO:0060648 |
mammary gland bud morphogenesis(GO:0060648) |
| 0.2 |
1.2 |
GO:0030382 |
sperm mitochondrion organization(GO:0030382) |
| 0.2 |
0.7 |
GO:0007171 |
activation of transmembrane receptor protein tyrosine kinase activity(GO:0007171) |
| 0.2 |
0.7 |
GO:0042977 |
activation of JAK2 kinase activity(GO:0042977) |
| 0.2 |
0.9 |
GO:0051045 |
negative regulation of membrane protein ectodomain proteolysis(GO:0051045) |
| 0.2 |
0.2 |
GO:1901420 |
negative regulation of response to alcohol(GO:1901420) |
| 0.2 |
0.8 |
GO:0006369 |
termination of RNA polymerase II transcription(GO:0006369) |
| 0.2 |
0.7 |
GO:0090324 |
negative regulation of oxidative phosphorylation(GO:0090324) |
| 0.2 |
0.5 |
GO:0000454 |
snoRNA guided rRNA pseudouridine synthesis(GO:0000454) |
| 0.2 |
1.3 |
GO:0060164 |
regulation of timing of neuron differentiation(GO:0060164) |
| 0.2 |
2.3 |
GO:0038063 |
collagen-activated tyrosine kinase receptor signaling pathway(GO:0038063) |
| 0.2 |
0.8 |
GO:0047484 |
regulation of response to osmotic stress(GO:0047484) |
| 0.2 |
0.5 |
GO:0001866 |
NK T cell proliferation(GO:0001866) |
| 0.2 |
0.2 |
GO:0010748 |
negative regulation of plasma membrane long-chain fatty acid transport(GO:0010748) |
| 0.2 |
0.5 |
GO:1901725 |
regulation of histone deacetylase activity(GO:1901725) |
| 0.2 |
0.3 |
GO:0045059 |
positive thymic T cell selection(GO:0045059) |
| 0.2 |
0.5 |
GO:0046880 |
regulation of follicle-stimulating hormone secretion(GO:0046880) follicle-stimulating hormone secretion(GO:0046884) |
| 0.2 |
0.2 |
GO:0032196 |
transposition(GO:0032196) |
| 0.2 |
1.1 |
GO:0035948 |
positive regulation of gluconeogenesis by positive regulation of transcription from RNA polymerase II promoter(GO:0035948) regulation of cellular ketone metabolic process by positive regulation of transcription from RNA polymerase II promoter(GO:0072366) |
| 0.2 |
0.8 |
GO:0036337 |
Fas signaling pathway(GO:0036337) |
| 0.2 |
0.5 |
GO:0050975 |
sensory perception of touch(GO:0050975) |
| 0.2 |
0.3 |
GO:0035933 |
glucocorticoid secretion(GO:0035933) |
| 0.2 |
1.0 |
GO:0031657 |
regulation of cyclin-dependent protein serine/threonine kinase activity involved in G1/S transition of mitotic cell cycle(GO:0031657) positive regulation of cyclin-dependent protein serine/threonine kinase activity involved in G1/S transition of mitotic cell cycle(GO:0031659) |
| 0.2 |
1.6 |
GO:0031999 |
negative regulation of fatty acid beta-oxidation(GO:0031999) |
| 0.2 |
0.9 |
GO:0038028 |
insulin receptor signaling pathway via phosphatidylinositol 3-kinase(GO:0038028) |
| 0.2 |
0.6 |
GO:0021847 |
ventricular zone neuroblast division(GO:0021847) |
| 0.2 |
0.6 |
GO:0002949 |
tRNA threonylcarbamoyladenosine modification(GO:0002949) |
| 0.2 |
0.2 |
GO:0072338 |
creatinine metabolic process(GO:0046449) cellular lactam metabolic process(GO:0072338) |
| 0.2 |
0.5 |
GO:0097155 |
fasciculation of sensory neuron axon(GO:0097155) |
| 0.2 |
0.5 |
GO:0045759 |
negative regulation of action potential(GO:0045759) |
| 0.2 |
0.5 |
GO:2000620 |
positive regulation of histone H4-K16 acetylation(GO:2000620) |
| 0.2 |
0.6 |
GO:0032382 |
positive regulation of intracellular lipid transport(GO:0032379) positive regulation of intracellular sterol transport(GO:0032382) positive regulation of intracellular cholesterol transport(GO:0032385) lipid hydroperoxide transport(GO:1901373) positive regulation of cholesterol import(GO:1904109) positive regulation of sterol import(GO:2000911) |
| 0.2 |
1.1 |
GO:1901162 |
serotonin biosynthetic process(GO:0042427) primary amino compound biosynthetic process(GO:1901162) |
| 0.2 |
0.9 |
GO:1900747 |
negative regulation of vascular endothelial growth factor signaling pathway(GO:1900747) |
| 0.2 |
0.3 |
GO:1903275 |
positive regulation of sodium ion export(GO:1903275) positive regulation of sodium ion export from cell(GO:1903278) |
| 0.2 |
0.2 |
GO:0034384 |
high-density lipoprotein particle clearance(GO:0034384) |
| 0.2 |
0.6 |
GO:0032000 |
positive regulation of fatty acid beta-oxidation(GO:0032000) |
| 0.1 |
0.3 |
GO:0006538 |
glutamate catabolic process(GO:0006538) |
| 0.1 |
0.7 |
GO:0015788 |
UDP-N-acetylglucosamine transport(GO:0015788) |
| 0.1 |
1.5 |
GO:0036159 |
inner dynein arm assembly(GO:0036159) |
| 0.1 |
0.4 |
GO:0060088 |
auditory receptor cell stereocilium organization(GO:0060088) |
| 0.1 |
0.4 |
GO:0046900 |
tetrahydrofolylpolyglutamate metabolic process(GO:0046900) |
| 0.1 |
0.1 |
GO:0071921 |
establishment of sister chromatid cohesion(GO:0034085) cohesin loading(GO:0071921) regulation of cohesin loading(GO:0071922) |
| 0.1 |
0.1 |
GO:0042270 |
protection from natural killer cell mediated cytotoxicity(GO:0042270) |
| 0.1 |
0.1 |
GO:0042160 |
lipoprotein modification(GO:0042160) lipoprotein oxidation(GO:0042161) |
| 0.1 |
1.5 |
GO:0032876 |
negative regulation of DNA endoreduplication(GO:0032876) |
| 0.1 |
0.4 |
GO:0042560 |
10-formyltetrahydrofolate catabolic process(GO:0009258) folic acid-containing compound catabolic process(GO:0009397) pteridine-containing compound catabolic process(GO:0042560) |
| 0.1 |
0.7 |
GO:0010820 |
positive regulation of T cell chemotaxis(GO:0010820) |
| 0.1 |
2.1 |
GO:0032967 |
positive regulation of collagen biosynthetic process(GO:0032967) |
| 0.1 |
0.9 |
GO:0050861 |
positive regulation of B cell receptor signaling pathway(GO:0050861) |
| 0.1 |
0.1 |
GO:0043586 |
tongue development(GO:0043586) |
| 0.1 |
0.4 |
GO:0035989 |
tendon development(GO:0035989) |
| 0.1 |
0.8 |
GO:0072602 |
interleukin-4 secretion(GO:0072602) |
| 0.1 |
0.7 |
GO:0021993 |
initiation of neural tube closure(GO:0021993) |
| 0.1 |
0.3 |
GO:0003273 |
cell migration involved in endocardial cushion formation(GO:0003273) |
| 0.1 |
1.0 |
GO:0006685 |
sphingomyelin catabolic process(GO:0006685) |
| 0.1 |
0.1 |
GO:0070070 |
proton-transporting V-type ATPase complex assembly(GO:0070070) proton-transporting two-sector ATPase complex assembly(GO:0070071) vacuolar proton-transporting V-type ATPase complex assembly(GO:0070072) |
| 0.1 |
0.4 |
GO:0070124 |
mitochondrial translational initiation(GO:0070124) |
| 0.1 |
0.3 |
GO:1902071 |
regulation of hypoxia-inducible factor-1alpha signaling pathway(GO:1902071) |
| 0.1 |
0.4 |
GO:0060075 |
regulation of resting membrane potential(GO:0060075) |
| 0.1 |
0.4 |
GO:0000350 |
generation of catalytic spliceosome for second transesterification step(GO:0000350) |
| 0.1 |
2.2 |
GO:0060134 |
prepulse inhibition(GO:0060134) |
| 0.1 |
0.5 |
GO:0032788 |
saturated monocarboxylic acid metabolic process(GO:0032788) unsaturated monocarboxylic acid metabolic process(GO:0032789) |
| 0.1 |
1.2 |
GO:0035881 |
amacrine cell differentiation(GO:0035881) |
| 0.1 |
0.4 |
GO:0051964 |
negative regulation of synapse assembly(GO:0051964) |
| 0.1 |
0.4 |
GO:0030827 |
negative regulation of cGMP metabolic process(GO:0030824) negative regulation of cGMP biosynthetic process(GO:0030827) negative regulation of guanylate cyclase activity(GO:0031283) |
| 0.1 |
0.1 |
GO:0035672 |
oligopeptide transmembrane transport(GO:0035672) |
| 0.1 |
0.7 |
GO:0007256 |
activation of JNKK activity(GO:0007256) |
| 0.1 |
1.3 |
GO:1990440 |
positive regulation of transcription from RNA polymerase II promoter in response to endoplasmic reticulum stress(GO:1990440) |
| 0.1 |
0.4 |
GO:0090310 |
negative regulation of methylation-dependent chromatin silencing(GO:0090310) |
| 0.1 |
0.4 |
GO:0036015 |
response to interleukin-3(GO:0036015) cellular response to interleukin-3(GO:0036016) |
| 0.1 |
0.8 |
GO:0021869 |
forebrain ventricular zone progenitor cell division(GO:0021869) |
| 0.1 |
0.3 |
GO:0021814 |
cell motility involved in cerebral cortex radial glia guided migration(GO:0021814) |
| 0.1 |
0.1 |
GO:1904995 |
negative regulation of leukocyte adhesion to vascular endothelial cell(GO:1904995) |
| 0.1 |
0.1 |
GO:0031627 |
telomeric loop formation(GO:0031627) |
| 0.1 |
0.1 |
GO:0006767 |
water-soluble vitamin metabolic process(GO:0006767) |
| 0.1 |
0.4 |
GO:0048698 |
negative regulation of collateral sprouting in absence of injury(GO:0048698) |
| 0.1 |
0.5 |
GO:0035878 |
nail development(GO:0035878) |
| 0.1 |
0.1 |
GO:1904017 |
response to Thyroglobulin triiodothyronine(GO:1904016) cellular response to Thyroglobulin triiodothyronine(GO:1904017) |
| 0.1 |
0.3 |
GO:0031860 |
telomeric 3' overhang formation(GO:0031860) |
| 0.1 |
0.3 |
GO:0032328 |
alanine transport(GO:0032328) |
| 0.1 |
0.5 |
GO:0051562 |
negative regulation of mitochondrial calcium ion concentration(GO:0051562) |
| 0.1 |
0.4 |
GO:0032808 |
lacrimal gland development(GO:0032808) |
| 0.1 |
1.3 |
GO:0019227 |
neuronal action potential propagation(GO:0019227) action potential propagation(GO:0098870) |
| 0.1 |
0.6 |
GO:0030913 |
paranodal junction assembly(GO:0030913) |
| 0.1 |
0.4 |
GO:0045794 |
negative regulation of cell volume(GO:0045794) |
| 0.1 |
0.8 |
GO:0045654 |
positive regulation of megakaryocyte differentiation(GO:0045654) |
| 0.1 |
1.0 |
GO:2000301 |
negative regulation of synaptic vesicle exocytosis(GO:2000301) |
| 0.1 |
0.4 |
GO:0042196 |
dichloromethane metabolic process(GO:0018900) chlorinated hydrocarbon metabolic process(GO:0042196) halogenated hydrocarbon metabolic process(GO:0042197) |
| 0.1 |
0.2 |
GO:0070318 |
positive regulation of G0 to G1 transition(GO:0070318) |
| 0.1 |
1.0 |
GO:0031848 |
protection from non-homologous end joining at telomere(GO:0031848) |
| 0.1 |
0.4 |
GO:0003349 |
epicardium-derived cardiac endothelial cell differentiation(GO:0003349) |
| 0.1 |
0.5 |
GO:1904565 |
response to 1-oleoyl-sn-glycerol 3-phosphate(GO:1904565) cellular response to 1-oleoyl-sn-glycerol 3-phosphate(GO:1904566) |
| 0.1 |
0.7 |
GO:0006627 |
protein processing involved in protein targeting to mitochondrion(GO:0006627) |
| 0.1 |
2.6 |
GO:0015701 |
bicarbonate transport(GO:0015701) |
| 0.1 |
2.2 |
GO:0051043 |
regulation of membrane protein ectodomain proteolysis(GO:0051043) |
| 0.1 |
0.7 |
GO:0033147 |
negative regulation of intracellular estrogen receptor signaling pathway(GO:0033147) |
| 0.1 |
0.4 |
GO:0097343 |
ripoptosome assembly(GO:0097343) ripoptosome assembly involved in necroptotic process(GO:1901026) |
| 0.1 |
0.5 |
GO:0006624 |
vacuolar protein processing(GO:0006624) |
| 0.1 |
1.2 |
GO:0035520 |
monoubiquitinated protein deubiquitination(GO:0035520) |
| 0.1 |
0.4 |
GO:0070973 |
protein localization to endoplasmic reticulum exit site(GO:0070973) |
| 0.1 |
0.7 |
GO:0072513 |
positive regulation of secondary heart field cardioblast proliferation(GO:0072513) |
| 0.1 |
0.6 |
GO:0070460 |
thyroid-stimulating hormone secretion(GO:0070460) |
| 0.1 |
2.0 |
GO:0007214 |
gamma-aminobutyric acid signaling pathway(GO:0007214) |
| 0.1 |
4.8 |
GO:0001919 |
regulation of receptor recycling(GO:0001919) |
| 0.1 |
0.6 |
GO:0030242 |
pexophagy(GO:0030242) |
| 0.1 |
0.4 |
GO:0035106 |
operant conditioning(GO:0035106) |
| 0.1 |
0.4 |
GO:0008355 |
olfactory learning(GO:0008355) |
| 0.1 |
0.1 |
GO:0002925 |
positive regulation of humoral immune response mediated by circulating immunoglobulin(GO:0002925) |
| 0.1 |
1.5 |
GO:0050901 |
leukocyte tethering or rolling(GO:0050901) |
| 0.1 |
0.2 |
GO:0009597 |
detection of virus(GO:0009597) |
| 0.1 |
0.6 |
GO:0014834 |
skeletal muscle satellite cell maintenance involved in skeletal muscle regeneration(GO:0014834) |
| 0.1 |
0.2 |
GO:0061054 |
dermatome development(GO:0061054) regulation of dermatome development(GO:0061183) |
| 0.1 |
0.5 |
GO:0072257 |
metanephric nephron tubule epithelial cell differentiation(GO:0072257) regulation of metanephric nephron tubule epithelial cell differentiation(GO:0072307) |
| 0.1 |
0.5 |
GO:0034975 |
protein folding in endoplasmic reticulum(GO:0034975) |
| 0.1 |
0.1 |
GO:1902358 |
sulfate transmembrane transport(GO:1902358) |
| 0.1 |
0.6 |
GO:0021957 |
corticospinal tract morphogenesis(GO:0021957) |
| 0.1 |
0.8 |
GO:0030432 |
peristalsis(GO:0030432) |
| 0.1 |
0.3 |
GO:0035621 |
ER to Golgi ceramide transport(GO:0035621) ceramide transport(GO:0035627) |
| 0.1 |
0.3 |
GO:0032474 |
otolith morphogenesis(GO:0032474) |
| 0.1 |
0.8 |
GO:0016127 |
cholesterol catabolic process(GO:0006707) sterol catabolic process(GO:0016127) |
| 0.1 |
1.0 |
GO:0033603 |
positive regulation of dopamine secretion(GO:0033603) |
| 0.1 |
0.7 |
GO:0010606 |
positive regulation of cytoplasmic mRNA processing body assembly(GO:0010606) |
| 0.1 |
0.8 |
GO:0002347 |
response to tumor cell(GO:0002347) |
| 0.1 |
0.2 |
GO:2000668 |
dendritic cell apoptotic process(GO:0097048) regulation of dendritic cell apoptotic process(GO:2000668) |
| 0.1 |
0.1 |
GO:1901386 |
negative regulation of voltage-gated calcium channel activity(GO:1901386) |
| 0.1 |
0.1 |
GO:0019805 |
quinolinate biosynthetic process(GO:0019805) |
| 0.1 |
0.5 |
GO:1900095 |
regulation of dosage compensation by inactivation of X chromosome(GO:1900095) |
| 0.1 |
0.7 |
GO:0051541 |
elastin metabolic process(GO:0051541) |
| 0.1 |
0.4 |
GO:0002326 |
B cell lineage commitment(GO:0002326) |
| 0.1 |
0.3 |
GO:0034184 |
positive regulation of maintenance of sister chromatid cohesion(GO:0034093) positive regulation of maintenance of mitotic sister chromatid cohesion(GO:0034184) |
| 0.1 |
0.2 |
GO:0060083 |
smooth muscle contraction involved in micturition(GO:0060083) |
| 0.1 |
0.5 |
GO:0050651 |
dermatan sulfate proteoglycan biosynthetic process(GO:0050651) |
| 0.1 |
0.5 |
GO:0002317 |
plasma cell differentiation(GO:0002317) |
| 0.1 |
0.4 |
GO:0046469 |
platelet activating factor biosynthetic process(GO:0006663) platelet activating factor metabolic process(GO:0046469) |
| 0.1 |
0.5 |
GO:0046477 |
glycosylceramide catabolic process(GO:0046477) |
| 0.1 |
1.3 |
GO:0034497 |
protein localization to pre-autophagosomal structure(GO:0034497) |
| 0.1 |
0.3 |
GO:0070305 |
response to cGMP(GO:0070305) cellular response to cGMP(GO:0071321) |
| 0.1 |
0.1 |
GO:0014054 |
positive regulation of gamma-aminobutyric acid secretion(GO:0014054) |
| 0.1 |
0.2 |
GO:0010273 |
detoxification of copper ion(GO:0010273) detoxification of inorganic compound(GO:0061687) stress response to copper ion(GO:1990169) |
| 0.1 |
1.2 |
GO:0097084 |
vascular smooth muscle cell development(GO:0097084) |
| 0.1 |
0.9 |
GO:0009651 |
response to salt stress(GO:0009651) |
| 0.1 |
0.9 |
GO:0009404 |
toxin metabolic process(GO:0009404) |
| 0.1 |
1.5 |
GO:0009312 |
oligosaccharide biosynthetic process(GO:0009312) |
| 0.1 |
0.2 |
GO:0034587 |
piRNA metabolic process(GO:0034587) |
| 0.1 |
1.0 |
GO:0042541 |
hemoglobin biosynthetic process(GO:0042541) |
| 0.1 |
0.6 |
GO:1902261 |
positive regulation of delayed rectifier potassium channel activity(GO:1902261) positive regulation of voltage-gated potassium channel activity(GO:1903818) |
| 0.1 |
0.2 |
GO:0010730 |
negative regulation of hydrogen peroxide metabolic process(GO:0010727) negative regulation of hydrogen peroxide biosynthetic process(GO:0010730) |
| 0.1 |
0.2 |
GO:1901223 |
negative regulation of NIK/NF-kappaB signaling(GO:1901223) |
| 0.1 |
0.2 |
GO:1902995 |
regulation of phospholipid efflux(GO:1902994) positive regulation of phospholipid efflux(GO:1902995) |
| 0.1 |
0.6 |
GO:0006290 |
pyrimidine dimer repair(GO:0006290) |
| 0.1 |
1.8 |
GO:0071378 |
growth hormone receptor signaling pathway(GO:0060396) cellular response to growth hormone stimulus(GO:0071378) |
| 0.1 |
0.4 |
GO:0045409 |
negative regulation of interleukin-6 biosynthetic process(GO:0045409) |
| 0.1 |
0.3 |
GO:0002606 |
dendritic cell antigen processing and presentation(GO:0002468) regulation of dendritic cell antigen processing and presentation(GO:0002604) positive regulation of dendritic cell antigen processing and presentation(GO:0002606) |
| 0.1 |
0.6 |
GO:0048254 |
snoRNA localization(GO:0048254) |
| 0.1 |
0.4 |
GO:0019276 |
UDP-N-acetylgalactosamine metabolic process(GO:0019276) |
| 0.1 |
0.2 |
GO:2000425 |
regulation of apoptotic cell clearance(GO:2000425) |
| 0.1 |
0.3 |
GO:0001788 |
antibody-dependent cellular cytotoxicity(GO:0001788) |
| 0.1 |
0.3 |
GO:2000774 |
positive regulation of cellular senescence(GO:2000774) |
| 0.1 |
0.1 |
GO:0034241 |
positive regulation of macrophage fusion(GO:0034241) |
| 0.1 |
0.1 |
GO:1904429 |
regulation of t-circle formation(GO:1904429) positive regulation of t-circle formation(GO:1904431) |
| 0.1 |
0.3 |
GO:0048352 |
neural plate mediolateral regionalization(GO:0021998) mesoderm structural organization(GO:0048338) paraxial mesoderm structural organization(GO:0048352) |
| 0.1 |
0.7 |
GO:0032287 |
peripheral nervous system myelin maintenance(GO:0032287) |
| 0.1 |
0.5 |
GO:0006167 |
AMP biosynthetic process(GO:0006167) |
| 0.1 |
0.1 |
GO:0002756 |
MyD88-independent toll-like receptor signaling pathway(GO:0002756) |
| 0.1 |
0.2 |
GO:0006295 |
nucleotide-excision repair, DNA incision, 3'-to lesion(GO:0006295) |
| 0.1 |
0.2 |
GO:0015712 |
hexose phosphate transport(GO:0015712) glucose-6-phosphate transport(GO:0015760) |
| 0.1 |
0.1 |
GO:1903463 |
regulation of mitotic cell cycle DNA replication(GO:1903463) |
| 0.1 |
0.1 |
GO:0042640 |
anagen(GO:0042640) |
| 0.1 |
0.1 |
GO:0032026 |
response to magnesium ion(GO:0032026) |
| 0.1 |
0.3 |
GO:0071947 |
protein deubiquitination involved in ubiquitin-dependent protein catabolic process(GO:0071947) |
| 0.1 |
0.3 |
GO:0035455 |
response to interferon-alpha(GO:0035455) |
| 0.1 |
0.2 |
GO:2001170 |
negative regulation of ATP biosynthetic process(GO:2001170) |
| 0.1 |
0.2 |
GO:0048478 |
replication fork protection(GO:0048478) |
| 0.1 |
0.2 |
GO:0097527 |
necroptotic signaling pathway(GO:0097527) |
| 0.1 |
0.9 |
GO:2000353 |
positive regulation of endothelial cell apoptotic process(GO:2000353) |
| 0.1 |
1.3 |
GO:0006388 |
tRNA splicing, via endonucleolytic cleavage and ligation(GO:0006388) |
| 0.1 |
0.5 |
GO:1901341 |
activation of store-operated calcium channel activity(GO:0032237) positive regulation of store-operated calcium channel activity(GO:1901341) |
| 0.1 |
0.3 |
GO:1902965 |
regulation of protein localization to early endosome(GO:1902965) positive regulation of protein localization to early endosome(GO:1902966) |
| 0.1 |
0.5 |
GO:0071680 |
response to indole-3-methanol(GO:0071680) cellular response to indole-3-methanol(GO:0071681) |
| 0.1 |
1.5 |
GO:0001886 |
endothelial cell morphogenesis(GO:0001886) |
| 0.1 |
0.5 |
GO:0046208 |
spermine catabolic process(GO:0046208) |
| 0.1 |
0.7 |
GO:1903301 |
positive regulation of glucokinase activity(GO:0033133) positive regulation of hexokinase activity(GO:1903301) |
| 0.1 |
0.4 |
GO:0090365 |
regulation of mRNA modification(GO:0090365) |
| 0.1 |
0.6 |
GO:0070886 |
positive regulation of calcineurin-NFAT signaling cascade(GO:0070886) |
| 0.1 |
0.3 |
GO:0033128 |
negative regulation of histone phosphorylation(GO:0033128) |
| 0.1 |
0.2 |
GO:0007354 |
zygotic determination of anterior/posterior axis, embryo(GO:0007354) |
| 0.1 |
0.1 |
GO:2000049 |
positive regulation of cell-cell adhesion mediated by cadherin(GO:2000049) |
| 0.1 |
0.5 |
GO:0003406 |
retinal pigment epithelium development(GO:0003406) |
| 0.1 |
0.2 |
GO:0051712 |
positive regulation of killing of cells of other organism(GO:0051712) |
| 0.1 |
0.1 |
GO:0072425 |
signal transduction involved in G2 DNA damage checkpoint(GO:0072425) signal transduction involved in mitotic G2 DNA damage checkpoint(GO:0072434) |
| 0.1 |
0.8 |
GO:0034776 |
response to histamine(GO:0034776) cellular response to histamine(GO:0071420) |
| 0.1 |
0.1 |
GO:0072173 |
metanephric tubule morphogenesis(GO:0072173) |
| 0.1 |
0.7 |
GO:0048742 |
regulation of skeletal muscle fiber development(GO:0048742) |
| 0.1 |
0.7 |
GO:0051533 |
positive regulation of NFAT protein import into nucleus(GO:0051533) |
| 0.1 |
0.1 |
GO:0030576 |
Cajal body organization(GO:0030576) |
| 0.1 |
0.3 |
GO:0045162 |
clustering of voltage-gated sodium channels(GO:0045162) |
| 0.1 |
0.4 |
GO:0042167 |
heme catabolic process(GO:0042167) pigment catabolic process(GO:0046149) |
| 0.1 |
0.4 |
GO:0070837 |
dehydroascorbic acid transport(GO:0070837) |
| 0.1 |
1.4 |
GO:0044550 |
secondary metabolite biosynthetic process(GO:0044550) |
| 0.1 |
0.1 |
GO:1901856 |
negative regulation of cellular respiration(GO:1901856) |
| 0.1 |
0.3 |
GO:1902170 |
cellular response to reactive nitrogen species(GO:1902170) |
| 0.1 |
0.4 |
GO:2001032 |
regulation of double-strand break repair via nonhomologous end joining(GO:2001032) |
| 0.1 |
0.5 |
GO:0097368 |
establishment of Sertoli cell barrier(GO:0097368) |
| 0.1 |
0.3 |
GO:0042998 |
positive regulation of Golgi to plasma membrane protein transport(GO:0042998) |
| 0.1 |
0.5 |
GO:0050747 |
positive regulation of lipoprotein metabolic process(GO:0050747) |
| 0.1 |
0.4 |
GO:0045039 |
protein import into mitochondrial inner membrane(GO:0045039) |
| 0.1 |
0.4 |
GO:0090292 |
nuclear matrix organization(GO:0043578) nuclear matrix anchoring at nuclear membrane(GO:0090292) |
| 0.1 |
0.3 |
GO:0044838 |
cell quiescence(GO:0044838) |
| 0.1 |
0.4 |
GO:0033004 |
negative regulation of mast cell activation(GO:0033004) |
| 0.1 |
0.2 |
GO:0033088 |
negative regulation of immature T cell proliferation in thymus(GO:0033088) |
| 0.1 |
0.5 |
GO:0030322 |
stabilization of membrane potential(GO:0030322) |
| 0.1 |
0.1 |
GO:0061502 |
early endosome to recycling endosome transport(GO:0061502) |
| 0.1 |
0.2 |
GO:0046689 |
response to mercury ion(GO:0046689) |
| 0.1 |
1.3 |
GO:0042759 |
long-chain fatty acid biosynthetic process(GO:0042759) |
| 0.1 |
0.2 |
GO:0014719 |
skeletal muscle satellite cell activation(GO:0014719) |
| 0.1 |
0.1 |
GO:0044253 |
positive regulation of collagen metabolic process(GO:0010714) positive regulation of multicellular organismal metabolic process(GO:0044253) |
| 0.1 |
0.7 |
GO:0071549 |
response to dexamethasone(GO:0071548) cellular response to dexamethasone stimulus(GO:0071549) |
| 0.1 |
0.9 |
GO:0071578 |
zinc II ion transmembrane import(GO:0071578) |
| 0.1 |
0.3 |
GO:0090027 |
negative regulation of monocyte chemotaxis(GO:0090027) |
| 0.1 |
0.4 |
GO:2000973 |
regulation of pro-B cell differentiation(GO:2000973) |
| 0.1 |
0.1 |
GO:2000017 |
positive regulation of determination of dorsal identity(GO:2000017) |
| 0.1 |
0.3 |
GO:0032497 |
detection of lipopolysaccharide(GO:0032497) |
| 0.1 |
0.5 |
GO:1990564 |
protein polyufmylation(GO:1990564) protein K69-linked ufmylation(GO:1990592) |
| 0.1 |
1.2 |
GO:0019369 |
arachidonic acid metabolic process(GO:0019369) |
| 0.1 |
0.1 |
GO:0010813 |
neuropeptide catabolic process(GO:0010813) |
| 0.1 |
0.3 |
GO:0060753 |
regulation of mast cell chemotaxis(GO:0060753) |
| 0.1 |
0.1 |
GO:0046886 |
positive regulation of hormone metabolic process(GO:0032352) positive regulation of hormone biosynthetic process(GO:0046886) |
| 0.1 |
0.1 |
GO:0072204 |
cell-cell signaling involved in kidney development(GO:0060995) Wnt signaling pathway involved in kidney development(GO:0061289) canonical Wnt signaling pathway involved in metanephric kidney development(GO:0061290) cell-cell signaling involved in metanephros development(GO:0072204) |
| 0.1 |
0.5 |
GO:0038033 |
positive regulation of endothelial cell chemotaxis by VEGF-activated vascular endothelial growth factor receptor signaling pathway(GO:0038033) |
| 0.1 |
0.3 |
GO:0034145 |
positive regulation of toll-like receptor 4 signaling pathway(GO:0034145) |
| 0.1 |
1.5 |
GO:0010866 |
regulation of triglyceride biosynthetic process(GO:0010866) |
| 0.1 |
0.2 |
GO:0000289 |
nuclear-transcribed mRNA poly(A) tail shortening(GO:0000289) |
| 0.1 |
0.3 |
GO:0050812 |
regulation of acetyl-CoA biosynthetic process from pyruvate(GO:0010510) regulation of acyl-CoA biosynthetic process(GO:0050812) |
| 0.1 |
0.3 |
GO:0051031 |
tRNA transport(GO:0051031) |
| 0.1 |
1.2 |
GO:0021902 |
commitment of neuronal cell to specific neuron type in forebrain(GO:0021902) |
| 0.1 |
0.2 |
GO:0031590 |
wybutosine metabolic process(GO:0031590) wybutosine biosynthetic process(GO:0031591) |
| 0.1 |
0.4 |
GO:0051365 |
cellular response to potassium ion starvation(GO:0051365) |
| 0.1 |
0.2 |
GO:1901072 |
glucosamine-containing compound catabolic process(GO:1901072) |
| 0.1 |
0.1 |
GO:0036388 |
pre-replicative complex assembly involved in nuclear cell cycle DNA replication(GO:0006267) pre-replicative complex assembly(GO:0036388) pre-replicative complex assembly involved in cell cycle DNA replication(GO:1902299) |
| 0.1 |
0.4 |
GO:0006620 |
posttranslational protein targeting to membrane(GO:0006620) |
| 0.1 |
0.1 |
GO:1904707 |
regulation of vascular smooth muscle cell proliferation(GO:1904705) positive regulation of vascular smooth muscle cell proliferation(GO:1904707) vascular smooth muscle cell proliferation(GO:1990874) |
| 0.1 |
0.4 |
GO:2001204 |
regulation of osteoclast development(GO:2001204) |
| 0.1 |
0.2 |
GO:0045627 |
positive regulation of T-helper 1 cell differentiation(GO:0045627) |
| 0.1 |
0.3 |
GO:0035063 |
nuclear speck organization(GO:0035063) |
| 0.1 |
0.4 |
GO:0002677 |
negative regulation of chronic inflammatory response(GO:0002677) |
| 0.1 |
0.2 |
GO:0006435 |
threonyl-tRNA aminoacylation(GO:0006435) |
| 0.1 |
0.3 |
GO:0045903 |
positive regulation of translational fidelity(GO:0045903) |
| 0.1 |
0.2 |
GO:1900041 |
negative regulation of interleukin-2 secretion(GO:1900041) |
| 0.1 |
0.2 |
GO:0046836 |
glycolipid transport(GO:0046836) |
| 0.1 |
0.2 |
GO:2000501 |
natural killer cell chemotaxis(GO:0035747) regulation of natural killer cell chemotaxis(GO:2000501) |
| 0.1 |
1.0 |
GO:0006614 |
SRP-dependent cotranslational protein targeting to membrane(GO:0006614) |
| 0.1 |
0.6 |
GO:0018344 |
protein geranylgeranylation(GO:0018344) |
| 0.1 |
0.2 |
GO:2000343 |
positive regulation of chemokine (C-X-C motif) ligand 2 production(GO:2000343) |
| 0.1 |
0.4 |
GO:1901678 |
iron coordination entity transport(GO:1901678) |
| 0.1 |
0.1 |
GO:0032687 |
regulation of interferon-alpha production(GO:0032647) negative regulation of interferon-alpha production(GO:0032687) |
| 0.1 |
0.1 |
GO:2001015 |
negative regulation of skeletal muscle cell differentiation(GO:2001015) |
| 0.1 |
0.2 |
GO:0006359 |
regulation of transcription from RNA polymerase III promoter(GO:0006359) |
| 0.1 |
0.2 |
GO:0030862 |
regulation of polarized epithelial cell differentiation(GO:0030860) positive regulation of polarized epithelial cell differentiation(GO:0030862) |
| 0.1 |
0.2 |
GO:0071877 |
regulation of adrenergic receptor signaling pathway(GO:0071877) |
| 0.1 |
0.1 |
GO:0018125 |
peptidyl-cysteine methylation(GO:0018125) |
| 0.1 |
0.2 |
GO:0043201 |
response to leucine(GO:0043201) cellular response to leucine(GO:0071233) |
| 0.1 |
0.1 |
GO:0002643 |
regulation of tolerance induction(GO:0002643) |
| 0.1 |
0.2 |
GO:0006285 |
base-excision repair, AP site formation(GO:0006285) |
| 0.1 |
0.5 |
GO:0048714 |
positive regulation of oligodendrocyte differentiation(GO:0048714) |
| 0.1 |
0.2 |
GO:0010830 |
regulation of myotube differentiation(GO:0010830) |
| 0.1 |
0.2 |
GO:2000616 |
negative regulation of histone H3-K9 acetylation(GO:2000616) |
| 0.1 |
0.7 |
GO:0032793 |
positive regulation of CREB transcription factor activity(GO:0032793) |
| 0.1 |
2.1 |
GO:0000027 |
ribosomal large subunit assembly(GO:0000027) |
| 0.1 |
0.1 |
GO:1990705 |
cholangiocyte proliferation(GO:1990705) |
| 0.1 |
0.3 |
GO:0021564 |
glossopharyngeal nerve development(GO:0021563) vagus nerve development(GO:0021564) |
| 0.1 |
0.2 |
GO:0036228 |
protein targeting to nuclear inner membrane(GO:0036228) |
| 0.1 |
0.2 |
GO:0010991 |
negative regulation of SMAD protein complex assembly(GO:0010991) |
| 0.1 |
0.2 |
GO:0035166 |
post-embryonic hemopoiesis(GO:0035166) |
| 0.1 |
0.2 |
GO:0006116 |
NADH oxidation(GO:0006116) |
| 0.1 |
0.4 |
GO:0009052 |
pentose-phosphate shunt, non-oxidative branch(GO:0009052) |
| 0.1 |
0.1 |
GO:0035790 |
platelet-derived growth factor receptor-alpha signaling pathway(GO:0035790) |
| 0.1 |
0.4 |
GO:0070493 |
thrombin receptor signaling pathway(GO:0070493) |
| 0.1 |
0.3 |
GO:0097393 |
post-embryonic appendage morphogenesis(GO:0035120) post-embryonic limb morphogenesis(GO:0035127) post-embryonic forelimb morphogenesis(GO:0035128) telomeric repeat-containing RNA transcription(GO:0097393) telomeric repeat-containing RNA transcription from RNA pol II promoter(GO:0097394) regulation of telomeric RNA transcription from RNA pol II promoter(GO:1901580) negative regulation of telomeric RNA transcription from RNA pol II promoter(GO:1901581) positive regulation of telomeric RNA transcription from RNA pol II promoter(GO:1901582) |
| 0.1 |
0.4 |
GO:0019377 |
glycolipid catabolic process(GO:0019377) |
| 0.1 |
0.7 |
GO:0032060 |
bleb assembly(GO:0032060) |
| 0.1 |
0.1 |
GO:2000834 |
androgen secretion(GO:0035935) testosterone secretion(GO:0035936) regulation of androgen secretion(GO:2000834) positive regulation of androgen secretion(GO:2000836) regulation of testosterone secretion(GO:2000843) positive regulation of testosterone secretion(GO:2000845) |
| 0.1 |
0.2 |
GO:0045006 |
DNA deamination(GO:0045006) |
| 0.1 |
2.5 |
GO:0002474 |
antigen processing and presentation of peptide antigen via MHC class I(GO:0002474) |
| 0.1 |
0.2 |
GO:1903347 |
negative regulation of bicellular tight junction assembly(GO:1903347) |
| 0.1 |
0.4 |
GO:0032790 |
ribosome disassembly(GO:0032790) |
| 0.1 |
1.3 |
GO:0032968 |
positive regulation of transcription elongation from RNA polymerase II promoter(GO:0032968) |
| 0.1 |
0.2 |
GO:0018149 |
peptide cross-linking(GO:0018149) |
| 0.1 |
0.1 |
GO:0071336 |
regulation of hair follicle cell proliferation(GO:0071336) positive regulation of hair follicle cell proliferation(GO:0071338) |
| 0.1 |
2.1 |
GO:0090162 |
establishment of epithelial cell polarity(GO:0090162) |
| 0.1 |
0.2 |
GO:1990046 |
positive regulation of mitochondrial DNA replication(GO:0090297) regulation of cardiolipin metabolic process(GO:1900208) positive regulation of cardiolipin metabolic process(GO:1900210) stress-induced mitochondrial fusion(GO:1990046) |
| 0.1 |
0.2 |
GO:0000966 |
RNA 5'-end processing(GO:0000966) |
| 0.1 |
0.2 |
GO:0030327 |
prenylated protein catabolic process(GO:0030327) |
| 0.1 |
0.1 |
GO:0046122 |
purine deoxyribonucleoside metabolic process(GO:0046122) |
| 0.1 |
0.1 |
GO:0006578 |
amino-acid betaine biosynthetic process(GO:0006578) |
| 0.1 |
0.4 |
GO:0072383 |
plus-end-directed vesicle transport along microtubule(GO:0072383) plus-end-directed organelle transport along microtubule(GO:0072386) |
| 0.1 |
0.1 |
GO:0006384 |
transcription initiation from RNA polymerase III promoter(GO:0006384) |
| 0.1 |
1.0 |
GO:0006958 |
complement activation, classical pathway(GO:0006958) |
| 0.1 |
0.5 |
GO:0006363 |
termination of RNA polymerase I transcription(GO:0006363) |
| 0.1 |
0.3 |
GO:2001274 |
negative regulation of glucose import in response to insulin stimulus(GO:2001274) |
| 0.1 |
0.2 |
GO:0006931 |
substrate-dependent cell migration, cell attachment to substrate(GO:0006931) |
| 0.1 |
0.5 |
GO:0090051 |
negative regulation of cell migration involved in sprouting angiogenesis(GO:0090051) |
| 0.1 |
0.1 |
GO:0014826 |
vein smooth muscle contraction(GO:0014826) |
| 0.1 |
0.8 |
GO:0090161 |
Golgi ribbon formation(GO:0090161) |
| 0.1 |
1.0 |
GO:0002495 |
antigen processing and presentation of peptide antigen via MHC class II(GO:0002495) antigen processing and presentation of peptide or polysaccharide antigen via MHC class II(GO:0002504) |
| 0.1 |
0.5 |
GO:2000051 |
negative regulation of non-canonical Wnt signaling pathway(GO:2000051) |
| 0.1 |
0.3 |
GO:0035814 |
negative regulation of renal sodium excretion(GO:0035814) |
| 0.1 |
0.3 |
GO:0033227 |
dsRNA transport(GO:0033227) |
| 0.1 |
0.2 |
GO:0019695 |
choline metabolic process(GO:0019695) |
| 0.1 |
0.2 |
GO:0031022 |
nuclear migration along microfilament(GO:0031022) |
| 0.1 |
0.3 |
GO:1902036 |
regulation of hematopoietic stem cell differentiation(GO:1902036) |
| 0.1 |
0.1 |
GO:0060416 |
response to growth hormone(GO:0060416) |
| 0.1 |
0.3 |
GO:0016266 |
O-glycan processing(GO:0016266) |
| 0.1 |
0.1 |
GO:0021943 |
formation of radial glial scaffolds(GO:0021943) |
| 0.1 |
0.5 |
GO:0014883 |
transition between fast and slow fiber(GO:0014883) |
| 0.1 |
0.2 |
GO:0072092 |
ureteric bud invasion(GO:0072092) |
| 0.1 |
0.4 |
GO:0061484 |
hematopoietic stem cell homeostasis(GO:0061484) |
| 0.1 |
0.9 |
GO:0006120 |
mitochondrial electron transport, NADH to ubiquinone(GO:0006120) |
| 0.1 |
0.3 |
GO:0055090 |
acylglycerol homeostasis(GO:0055090) triglyceride homeostasis(GO:0070328) |
| 0.1 |
0.8 |
GO:0031272 |
regulation of pseudopodium assembly(GO:0031272) |
| 0.1 |
0.4 |
GO:0051096 |
regulation of helicase activity(GO:0051095) positive regulation of helicase activity(GO:0051096) |
| 0.1 |
0.1 |
GO:0043619 |
regulation of transcription from RNA polymerase II promoter in response to oxidative stress(GO:0043619) |
| 0.1 |
0.3 |
GO:0036451 |
cap mRNA methylation(GO:0036451) |
| 0.1 |
0.5 |
GO:0071447 |
cellular response to hydroperoxide(GO:0071447) |
| 0.1 |
1.7 |
GO:0032011 |
ARF protein signal transduction(GO:0032011) regulation of ARF protein signal transduction(GO:0032012) |
| 0.1 |
0.2 |
GO:1901299 |
negative regulation of hydrogen peroxide-mediated programmed cell death(GO:1901299) |
| 0.1 |
0.3 |
GO:0010961 |
cellular magnesium ion homeostasis(GO:0010961) |
| 0.1 |
0.5 |
GO:0045187 |
regulation of circadian sleep/wake cycle(GO:0042749) regulation of circadian sleep/wake cycle, sleep(GO:0045187) |
| 0.1 |
0.3 |
GO:0042256 |
mature ribosome assembly(GO:0042256) |
| 0.1 |
0.6 |
GO:0032484 |
Ral protein signal transduction(GO:0032484) |
| 0.1 |
0.1 |
GO:0014866 |
skeletal myofibril assembly(GO:0014866) |
| 0.1 |
0.4 |
GO:0032516 |
positive regulation of phosphoprotein phosphatase activity(GO:0032516) |
| 0.1 |
1.8 |
GO:0010842 |
retina layer formation(GO:0010842) |
| 0.1 |
0.3 |
GO:0032929 |
negative regulation of superoxide anion generation(GO:0032929) |
| 0.1 |
0.1 |
GO:0045343 |
MHC class I biosynthetic process(GO:0045341) regulation of MHC class I biosynthetic process(GO:0045343) positive regulation of MHC class I biosynthetic process(GO:0045345) |
| 0.1 |
0.1 |
GO:0060447 |
bud outgrowth involved in lung branching(GO:0060447) |
| 0.1 |
0.5 |
GO:0035988 |
chondrocyte proliferation(GO:0035988) |
| 0.1 |
0.1 |
GO:2000121 |
regulation of removal of superoxide radicals(GO:2000121) |
| 0.1 |
0.2 |
GO:0046959 |
habituation(GO:0046959) |
| 0.1 |
0.1 |
GO:0070425 |
negative regulation of nucleotide-binding oligomerization domain containing signaling pathway(GO:0070425) negative regulation of nucleotide-binding oligomerization domain containing 2 signaling pathway(GO:0070433) |
| 0.1 |
0.1 |
GO:0060050 |
positive regulation of protein glycosylation(GO:0060050) |
| 0.1 |
0.3 |
GO:0030091 |
protein repair(GO:0030091) |
| 0.1 |
0.3 |
GO:0061098 |
positive regulation of protein tyrosine kinase activity(GO:0061098) |
| 0.1 |
0.3 |
GO:0070126 |
mitochondrial translational termination(GO:0070126) |
| 0.1 |
0.8 |
GO:1904262 |
negative regulation of TORC1 signaling(GO:1904262) |
| 0.1 |
0.3 |
GO:0060770 |
negative regulation of epithelial cell proliferation involved in prostate gland development(GO:0060770) |
| 0.1 |
0.1 |
GO:0070601 |
centromeric sister chromatid cohesion(GO:0070601) |
| 0.1 |
0.1 |
GO:0001881 |
receptor recycling(GO:0001881) |
| 0.1 |
0.4 |
GO:0090336 |
positive regulation of brown fat cell differentiation(GO:0090336) |
| 0.1 |
0.4 |
GO:0008616 |
queuosine biosynthetic process(GO:0008616) queuosine metabolic process(GO:0046116) |
| 0.1 |
0.3 |
GO:0050996 |
positive regulation of lipid catabolic process(GO:0050996) |
| 0.1 |
0.4 |
GO:0014842 |
regulation of skeletal muscle satellite cell proliferation(GO:0014842) |
| 0.1 |
0.1 |
GO:0031268 |
pseudopodium organization(GO:0031268) |
| 0.1 |
0.9 |
GO:0035269 |
protein O-linked mannosylation(GO:0035269) |
| 0.1 |
0.2 |
GO:0035752 |
lysosomal lumen pH elevation(GO:0035752) |
| 0.1 |
0.1 |
GO:0030214 |
hyaluronan catabolic process(GO:0030214) |
| 0.1 |
1.2 |
GO:0031297 |
replication fork processing(GO:0031297) |
| 0.1 |
0.4 |
GO:0044332 |
Wnt signaling pathway involved in dorsal/ventral axis specification(GO:0044332) |
| 0.1 |
0.1 |
GO:0019858 |
cytosine metabolic process(GO:0019858) |
| 0.1 |
0.2 |
GO:0034035 |
purine ribonucleoside bisphosphate metabolic process(GO:0034035) |
| 0.1 |
0.4 |
GO:0042510 |
regulation of tyrosine phosphorylation of Stat1 protein(GO:0042510) positive regulation of tyrosine phosphorylation of Stat1 protein(GO:0042511) |
| 0.1 |
0.1 |
GO:0006703 |
estrogen biosynthetic process(GO:0006703) |
| 0.1 |
0.1 |
GO:0019343 |
cysteine biosynthetic process via cystathionine(GO:0019343) cysteine biosynthetic process(GO:0019344) |
| 0.1 |
0.4 |
GO:0034047 |
regulation of protein phosphatase type 2A activity(GO:0034047) |
| 0.1 |
0.4 |
GO:0060219 |
camera-type eye photoreceptor cell differentiation(GO:0060219) |
| 0.1 |
0.2 |
GO:0010793 |
regulation of mRNA export from nucleus(GO:0010793) regulation of ribonucleoprotein complex localization(GO:2000197) |
| 0.1 |
0.1 |
GO:0046909 |
intermembrane transport(GO:0046909) |
| 0.1 |
0.5 |
GO:0071763 |
nuclear membrane organization(GO:0071763) |
| 0.1 |
0.2 |
GO:0019433 |
triglyceride catabolic process(GO:0019433) |
| 0.1 |
0.1 |
GO:1990481 |
mRNA pseudouridine synthesis(GO:1990481) |
| 0.1 |
0.1 |
GO:0010831 |
positive regulation of myotube differentiation(GO:0010831) |
| 0.1 |
0.3 |
GO:0007089 |
traversing start control point of mitotic cell cycle(GO:0007089) |
| 0.1 |
0.3 |
GO:0051684 |
maintenance of Golgi location(GO:0051684) |
| 0.1 |
0.1 |
GO:2000780 |
negative regulation of DNA repair(GO:0045738) negative regulation of double-strand break repair(GO:2000780) |
| 0.1 |
0.4 |
GO:0007221 |
positive regulation of transcription of Notch receptor target(GO:0007221) |
| 0.1 |
1.4 |
GO:0045026 |
plasma membrane fusion(GO:0045026) |
| 0.1 |
0.1 |
GO:1902774 |
late endosome to lysosome transport(GO:1902774) |
| 0.1 |
0.4 |
GO:0032355 |
response to estradiol(GO:0032355) |
| 0.1 |
0.2 |
GO:0046339 |
diacylglycerol metabolic process(GO:0046339) |
| 0.1 |
0.3 |
GO:0042780 |
tRNA 3'-end processing(GO:0042780) |
| 0.1 |
0.1 |
GO:1901509 |
regulation of endothelial tube morphogenesis(GO:1901509) |
| 0.1 |
0.1 |
GO:0007041 |
lysosomal transport(GO:0007041) |
| 0.1 |
0.5 |
GO:1990403 |
embryonic brain development(GO:1990403) |
| 0.1 |
0.9 |
GO:0009083 |
branched-chain amino acid catabolic process(GO:0009083) |
| 0.1 |
0.9 |
GO:1902043 |
positive regulation of extrinsic apoptotic signaling pathway via death domain receptors(GO:1902043) |
| 0.1 |
1.1 |
GO:0032981 |
NADH dehydrogenase complex assembly(GO:0010257) mitochondrial respiratory chain complex I assembly(GO:0032981) mitochondrial respiratory chain complex I biogenesis(GO:0097031) |
| 0.1 |
0.2 |
GO:0042517 |
positive regulation of tyrosine phosphorylation of Stat3 protein(GO:0042517) |
| 0.1 |
0.2 |
GO:0006842 |
tricarboxylic acid transport(GO:0006842) succinate transport(GO:0015744) citrate transport(GO:0015746) |
| 0.1 |
0.3 |
GO:0006741 |
NADP biosynthetic process(GO:0006741) |
| 0.1 |
0.2 |
GO:0071787 |
endoplasmic reticulum tubular network assembly(GO:0071787) |
| 0.1 |
0.2 |
GO:0002408 |
myeloid dendritic cell chemotaxis(GO:0002408) |
| 0.1 |
0.1 |
GO:0014738 |
regulation of muscle hyperplasia(GO:0014738) muscle hyperplasia(GO:0014900) |
| 0.1 |
0.3 |
GO:0051409 |
response to nitrosative stress(GO:0051409) |
| 0.1 |
0.1 |
GO:0032713 |
negative regulation of interleukin-4 production(GO:0032713) |
| 0.1 |
0.3 |
GO:0034316 |
negative regulation of Arp2/3 complex-mediated actin nucleation(GO:0034316) |
| 0.1 |
0.4 |
GO:0071044 |
histone mRNA catabolic process(GO:0071044) |
| 0.1 |
0.4 |
GO:0018026 |
peptidyl-lysine monomethylation(GO:0018026) |
| 0.1 |
0.3 |
GO:0034308 |
primary alcohol metabolic process(GO:0034308) |
| 0.1 |
0.6 |
GO:1901409 |
regulation of phosphorylation of RNA polymerase II C-terminal domain(GO:1901407) positive regulation of phosphorylation of RNA polymerase II C-terminal domain(GO:1901409) |
| 0.1 |
2.1 |
GO:0006376 |
mRNA splice site selection(GO:0006376) |
| 0.1 |
0.3 |
GO:0070102 |
interleukin-6-mediated signaling pathway(GO:0070102) |
| 0.1 |
0.2 |
GO:0060912 |
cardiac cell fate specification(GO:0060912) |
| 0.1 |
0.1 |
GO:1905153 |
regulation of membrane invagination(GO:1905153) |
| 0.1 |
0.3 |
GO:0045075 |
interleukin-12 biosynthetic process(GO:0042090) regulation of interleukin-12 biosynthetic process(GO:0045075) |
| 0.1 |
0.2 |
GO:0034134 |
toll-like receptor 2 signaling pathway(GO:0034134) |
| 0.1 |
0.1 |
GO:0002891 |
positive regulation of B cell mediated immunity(GO:0002714) positive regulation of immunoglobulin mediated immune response(GO:0002891) |
| 0.1 |
0.2 |
GO:0006049 |
UDP-N-acetylglucosamine catabolic process(GO:0006049) |
| 0.1 |
0.2 |
GO:0060809 |
mesodermal to mesenchymal transition involved in gastrulation(GO:0060809) |
| 0.1 |
0.1 |
GO:0043654 |
recognition of apoptotic cell(GO:0043654) |
| 0.1 |
0.7 |
GO:0009950 |
dorsal/ventral axis specification(GO:0009950) |
| 0.1 |
0.3 |
GO:0060712 |
spongiotrophoblast layer development(GO:0060712) |
| 0.1 |
0.2 |
GO:2000346 |
negative regulation of hepatocyte proliferation(GO:2000346) |
| 0.1 |
0.1 |
GO:2000468 |
regulation of peroxidase activity(GO:2000468) |
| 0.1 |
1.0 |
GO:0008053 |
mitochondrial fusion(GO:0008053) |
| 0.1 |
0.1 |
GO:0070995 |
NADPH oxidation(GO:0070995) |
| 0.1 |
0.2 |
GO:0071670 |
smooth muscle cell chemotaxis(GO:0071670) |
| 0.1 |
0.2 |
GO:0046077 |
dUDP biosynthetic process(GO:0006227) pyrimidine nucleoside diphosphate biosynthetic process(GO:0009139) pyrimidine deoxyribonucleoside diphosphate metabolic process(GO:0009196) pyrimidine deoxyribonucleoside diphosphate biosynthetic process(GO:0009197) dUDP metabolic process(GO:0046077) |
| 0.1 |
1.1 |
GO:0009268 |
response to pH(GO:0009268) |
| 0.1 |
0.3 |
GO:0035871 |
protein K11-linked deubiquitination(GO:0035871) |
| 0.1 |
0.2 |
GO:0046325 |
negative regulation of glucose import(GO:0046325) |
| 0.1 |
0.2 |
GO:0061101 |
neuroendocrine cell differentiation(GO:0061101) |
| 0.1 |
0.3 |
GO:0051697 |
protein delipidation(GO:0051697) |
| 0.1 |
0.2 |
GO:1904059 |
regulation of locomotor rhythm(GO:1904059) |
| 0.1 |
0.4 |
GO:0051561 |
positive regulation of mitochondrial calcium ion concentration(GO:0051561) |
| 0.1 |
0.3 |
GO:0044375 |
regulation of peroxisome size(GO:0044375) |
| 0.1 |
0.3 |
GO:0015791 |
polyol transport(GO:0015791) |
| 0.1 |
0.1 |
GO:0050912 |
detection of chemical stimulus involved in sensory perception(GO:0050907) detection of chemical stimulus involved in sensory perception of taste(GO:0050912) |
| 0.1 |
0.1 |
GO:0032077 |
positive regulation of deoxyribonuclease activity(GO:0032077) |
| 0.1 |
1.9 |
GO:0000462 |
maturation of SSU-rRNA from tricistronic rRNA transcript (SSU-rRNA, 5.8S rRNA, LSU-rRNA)(GO:0000462) |
| 0.1 |
1.6 |
GO:0048536 |
spleen development(GO:0048536) |
| 0.0 |
0.1 |
GO:0033194 |
response to hydroperoxide(GO:0033194) |
| 0.0 |
0.2 |
GO:0051189 |
Mo-molybdopterin cofactor biosynthetic process(GO:0006777) Mo-molybdopterin cofactor metabolic process(GO:0019720) molybdopterin cofactor biosynthetic process(GO:0032324) molybdopterin cofactor metabolic process(GO:0043545) prosthetic group metabolic process(GO:0051189) |
| 0.0 |
0.4 |
GO:0034773 |
histone H4-K20 trimethylation(GO:0034773) |
| 0.0 |
0.0 |
GO:0060068 |
vagina development(GO:0060068) |
| 0.0 |
0.1 |
GO:0070782 |
phosphatidylserine exposure on apoptotic cell surface(GO:0070782) |
| 0.0 |
0.4 |
GO:0035735 |
intraciliary transport involved in cilium morphogenesis(GO:0035735) |
| 0.0 |
0.1 |
GO:0043383 |
negative T cell selection(GO:0043383) negative thymic T cell selection(GO:0045060) |
| 0.0 |
0.0 |
GO:0046544 |
development of secondary male sexual characteristics(GO:0046544) |
| 0.0 |
0.0 |
GO:0060267 |
positive regulation of respiratory burst(GO:0060267) |
| 0.0 |
0.7 |
GO:1900454 |
positive regulation of long term synaptic depression(GO:1900454) |
| 0.0 |
1.0 |
GO:0043153 |
entrainment of circadian clock by photoperiod(GO:0043153) |
| 0.0 |
0.1 |
GO:0050716 |
positive regulation of interleukin-1 secretion(GO:0050716) positive regulation of interleukin-1 beta secretion(GO:0050718) |
| 0.0 |
0.7 |
GO:0006515 |
misfolded or incompletely synthesized protein catabolic process(GO:0006515) |
| 0.0 |
0.4 |
GO:0035337 |
fatty-acyl-CoA metabolic process(GO:0035337) |
| 0.0 |
0.0 |
GO:0051835 |
positive regulation of synapse structural plasticity(GO:0051835) |
| 0.0 |
0.1 |
GO:0097500 |
receptor localization to nonmotile primary cilium(GO:0097500) |
| 0.0 |
1.7 |
GO:0043124 |
negative regulation of I-kappaB kinase/NF-kappaB signaling(GO:0043124) |
| 0.0 |
0.9 |
GO:1900153 |
regulation of nuclear-transcribed mRNA catabolic process, deadenylation-dependent decay(GO:1900151) positive regulation of nuclear-transcribed mRNA catabolic process, deadenylation-dependent decay(GO:1900153) |
| 0.0 |
0.0 |
GO:1903546 |
protein localization to photoreceptor outer segment(GO:1903546) |
| 0.0 |
0.2 |
GO:0030643 |
cellular phosphate ion homeostasis(GO:0030643) cellular trivalent inorganic anion homeostasis(GO:0072502) |
| 0.0 |
0.2 |
GO:0008611 |
ether lipid biosynthetic process(GO:0008611) glycerol ether biosynthetic process(GO:0046504) cellular lipid biosynthetic process(GO:0097384) ether biosynthetic process(GO:1901503) |
| 0.0 |
0.1 |
GO:0051792 |
medium-chain fatty acid biosynthetic process(GO:0051792) |
| 0.0 |
0.8 |
GO:0046033 |
AMP metabolic process(GO:0046033) |
| 0.0 |
0.3 |
GO:0090435 |
protein localization to nuclear envelope(GO:0090435) |
| 0.0 |
0.2 |
GO:0006370 |
7-methylguanosine mRNA capping(GO:0006370) |
| 0.0 |
0.2 |
GO:0034123 |
positive regulation of toll-like receptor signaling pathway(GO:0034123) |
| 0.0 |
0.2 |
GO:0014819 |
regulation of skeletal muscle contraction(GO:0014819) |
| 0.0 |
0.0 |
GO:0032055 |
negative regulation of translation in response to stress(GO:0032055) |
| 0.0 |
0.1 |
GO:0002158 |
osteoclast proliferation(GO:0002158) |
| 0.0 |
0.0 |
GO:0070309 |
lens fiber cell morphogenesis(GO:0070309) |
| 0.0 |
0.2 |
GO:0090074 |
negative regulation of protein homodimerization activity(GO:0090074) |
| 0.0 |
0.1 |
GO:0006903 |
vesicle targeting(GO:0006903) |
| 0.0 |
0.1 |
GO:0035434 |
copper ion transmembrane transport(GO:0035434) |
| 0.0 |
0.2 |
GO:0030644 |
cellular chloride ion homeostasis(GO:0030644) |
| 0.0 |
0.7 |
GO:0034453 |
microtubule anchoring(GO:0034453) |
| 0.0 |
0.4 |
GO:0051923 |
sulfation(GO:0051923) |
| 0.0 |
0.5 |
GO:1900383 |
regulation of synaptic plasticity by receptor localization to synapse(GO:1900383) |
| 0.0 |
0.1 |
GO:0045191 |
regulation of isotype switching(GO:0045191) |
| 0.0 |
0.1 |
GO:0070092 |
glucagon secretion(GO:0070091) regulation of glucagon secretion(GO:0070092) |
| 0.0 |
0.1 |
GO:1903774 |
positive regulation of viral budding via host ESCRT complex(GO:1903774) |
| 0.0 |
0.8 |
GO:0014047 |
glutamate secretion(GO:0014047) |
| 0.0 |
0.0 |
GO:0043652 |
engulfment of apoptotic cell(GO:0043652) |
| 0.0 |
0.6 |
GO:0030033 |
microvillus assembly(GO:0030033) |
| 0.0 |
0.1 |
GO:0015840 |
urea transport(GO:0015840) urea transmembrane transport(GO:0071918) |
| 0.0 |
0.4 |
GO:0018126 |
protein hydroxylation(GO:0018126) |
| 0.0 |
0.2 |
GO:0006303 |
double-strand break repair via nonhomologous end joining(GO:0006303) |
| 0.0 |
0.1 |
GO:1902902 |
negative regulation of autophagosome assembly(GO:1902902) |
| 0.0 |
0.9 |
GO:0003009 |
skeletal muscle contraction(GO:0003009) |
| 0.0 |
0.4 |
GO:0098743 |
cartilage condensation(GO:0001502) cell aggregation(GO:0098743) |
| 0.0 |
0.1 |
GO:0030656 |
regulation of vitamin metabolic process(GO:0030656) |
| 0.0 |
0.1 |
GO:0010739 |
positive regulation of protein kinase A signaling(GO:0010739) |
| 0.0 |
0.1 |
GO:0070682 |
proteasome regulatory particle assembly(GO:0070682) |
| 0.0 |
0.6 |
GO:0061462 |
protein localization to lysosome(GO:0061462) |
| 0.0 |
0.2 |
GO:0051967 |
negative regulation of synaptic transmission, glutamatergic(GO:0051967) |
| 0.0 |
0.0 |
GO:0033313 |
meiotic cell cycle checkpoint(GO:0033313) |
| 0.0 |
0.5 |
GO:0000463 |
maturation of LSU-rRNA from tricistronic rRNA transcript (SSU-rRNA, 5.8S rRNA, LSU-rRNA)(GO:0000463) |
| 0.0 |
0.1 |
GO:0042701 |
progesterone secretion(GO:0042701) |
| 0.0 |
0.1 |
GO:0002741 |
positive regulation of cytokine secretion involved in immune response(GO:0002741) |
| 0.0 |
0.1 |
GO:1902369 |
negative regulation of RNA catabolic process(GO:1902369) |
| 0.0 |
0.3 |
GO:0043374 |
CD8-positive, alpha-beta T cell differentiation(GO:0043374) |
| 0.0 |
0.2 |
GO:0045671 |
negative regulation of osteoclast differentiation(GO:0045671) |
| 0.0 |
1.1 |
GO:0035456 |
response to interferon-beta(GO:0035456) |
| 0.0 |
0.2 |
GO:2000483 |
negative regulation of interleukin-8 secretion(GO:2000483) |
| 0.0 |
0.7 |
GO:0009409 |
response to cold(GO:0009409) |
| 0.0 |
0.3 |
GO:0035970 |
peptidyl-threonine dephosphorylation(GO:0035970) |
| 0.0 |
0.0 |
GO:2000253 |
positive regulation of feeding behavior(GO:2000253) |
| 0.0 |
0.2 |
GO:0006983 |
ER overload response(GO:0006983) |
| 0.0 |
0.0 |
GO:0002507 |
tolerance induction(GO:0002507) |
| 0.0 |
0.2 |
GO:0071361 |
cellular response to ethanol(GO:0071361) |
| 0.0 |
0.1 |
GO:0071476 |
hypotonic response(GO:0006971) cellular hypotonic response(GO:0071476) |
| 0.0 |
0.2 |
GO:0031937 |
positive regulation of chromatin silencing(GO:0031937) |
| 0.0 |
0.1 |
GO:0032423 |
regulation of mismatch repair(GO:0032423) |
| 0.0 |
0.6 |
GO:0016339 |
calcium-dependent cell-cell adhesion via plasma membrane cell adhesion molecules(GO:0016339) |
| 0.0 |
0.5 |
GO:0060628 |
regulation of ER to Golgi vesicle-mediated transport(GO:0060628) |
| 0.0 |
0.1 |
GO:0003195 |
tricuspid valve development(GO:0003175) tricuspid valve morphogenesis(GO:0003186) tricuspid valve formation(GO:0003195) |
| 0.0 |
0.1 |
GO:0030854 |
positive regulation of granulocyte differentiation(GO:0030854) |
| 0.0 |
0.1 |
GO:0070525 |
tRNA threonylcarbamoyladenosine metabolic process(GO:0070525) |
| 0.0 |
0.5 |
GO:0001845 |
phagolysosome assembly(GO:0001845) |
| 0.0 |
0.2 |
GO:2000574 |
regulation of microtubule motor activity(GO:2000574) |
| 0.0 |
0.1 |
GO:0036093 |
male germ cell proliferation(GO:0002176) germ cell proliferation(GO:0036093) |
| 0.0 |
0.4 |
GO:0035721 |
intraciliary retrograde transport(GO:0035721) |
| 0.0 |
0.1 |
GO:0071455 |
lysosomal microautophagy(GO:0016237) piecemeal microautophagy of nucleus(GO:0034727) cellular response to increased oxygen levels(GO:0036295) modulation by virus of host autophagy(GO:0039519) suppression by virus of host autophagy(GO:0039521) late nucleophagy(GO:0044805) cellular response to hyperoxia(GO:0071455) negative regulation of sphingolipid biosynthesis involved in cellular sphingolipid homeostasis(GO:0090157) negative regulation of histone H4-K16 acetylation(GO:2000619) |
| 0.0 |
0.1 |
GO:0000491 |
small nucleolar ribonucleoprotein complex assembly(GO:0000491) box C/D snoRNP assembly(GO:0000492) |
| 0.0 |
0.1 |
GO:0038145 |
macrophage colony-stimulating factor signaling pathway(GO:0038145) |
| 0.0 |
0.2 |
GO:1990928 |
response to amino acid starvation(GO:1990928) |
| 0.0 |
0.0 |
GO:0060126 |
somatotropin secreting cell differentiation(GO:0060126) |
| 0.0 |
0.2 |
GO:0006517 |
protein deglycosylation(GO:0006517) |
| 0.0 |
0.2 |
GO:0006953 |
acute-phase response(GO:0006953) |
| 0.0 |
0.0 |
GO:0007621 |
negative regulation of female receptivity(GO:0007621) |
| 0.0 |
0.4 |
GO:0016322 |
neuron remodeling(GO:0016322) |
| 0.0 |
0.2 |
GO:0009068 |
aspartate family amino acid catabolic process(GO:0009068) |
| 0.0 |
0.0 |
GO:0060431 |
primary lung bud formation(GO:0060431) |
| 0.0 |
0.3 |
GO:0031339 |
negative regulation of vesicle fusion(GO:0031339) |
| 0.0 |
0.2 |
GO:0051531 |
NFAT protein import into nucleus(GO:0051531) regulation of NFAT protein import into nucleus(GO:0051532) |
| 0.0 |
0.3 |
GO:0006561 |
proline biosynthetic process(GO:0006561) |
| 0.0 |
0.0 |
GO:0000478 |
endonucleolytic cleavage involved in rRNA processing(GO:0000478) |
| 0.0 |
0.1 |
GO:0032380 |
regulation of intracellular lipid transport(GO:0032377) regulation of intracellular sterol transport(GO:0032380) regulation of intracellular cholesterol transport(GO:0032383) |
| 0.0 |
0.1 |
GO:0008594 |
photoreceptor cell morphogenesis(GO:0008594) |
| 0.0 |
0.2 |
GO:0018206 |
peptidyl-methionine modification(GO:0018206) |
| 0.0 |
0.1 |
GO:0061738 |
late endosomal microautophagy(GO:0061738) |
| 0.0 |
0.0 |
GO:0051595 |
response to methylglyoxal(GO:0051595) |
| 0.0 |
0.1 |
GO:0042104 |
positive regulation of activated T cell proliferation(GO:0042104) |
| 0.0 |
0.1 |
GO:0071569 |
protein ufmylation(GO:0071569) |
| 0.0 |
0.3 |
GO:0071398 |
cellular response to fatty acid(GO:0071398) |
| 0.0 |
0.2 |
GO:0045909 |
positive regulation of vasodilation(GO:0045909) |
| 0.0 |
0.3 |
GO:0009437 |
amino-acid betaine metabolic process(GO:0006577) carnitine metabolic process(GO:0009437) |
| 0.0 |
0.1 |
GO:1903031 |
regulation of microtubule plus-end binding(GO:1903031) positive regulation of microtubule plus-end binding(GO:1903033) |
| 0.0 |
0.3 |
GO:0034121 |
regulation of toll-like receptor signaling pathway(GO:0034121) |
| 0.0 |
0.3 |
GO:0006102 |
isocitrate metabolic process(GO:0006102) |
| 0.0 |
0.1 |
GO:0017121 |
phospholipid scrambling(GO:0017121) |
| 0.0 |
0.1 |
GO:1902231 |
positive regulation of intrinsic apoptotic signaling pathway in response to DNA damage(GO:1902231) |
| 0.0 |
0.4 |
GO:0019835 |
cytolysis(GO:0019835) |
| 0.0 |
1.4 |
GO:0006821 |
chloride transport(GO:0006821) |
| 0.0 |
0.1 |
GO:0019346 |
homoserine metabolic process(GO:0009092) transsulfuration(GO:0019346) |
| 0.0 |
0.5 |
GO:0070842 |
aggresome assembly(GO:0070842) |
| 0.0 |
0.1 |
GO:0035405 |
histone-threonine phosphorylation(GO:0035405) |
| 0.0 |
0.1 |
GO:0007000 |
nucleolus organization(GO:0007000) |
| 0.0 |
0.1 |
GO:0050882 |
voluntary musculoskeletal movement(GO:0050882) |
| 0.0 |
0.4 |
GO:0048662 |
negative regulation of smooth muscle cell proliferation(GO:0048662) |
| 0.0 |
0.1 |
GO:0009650 |
UV protection(GO:0009650) |
| 0.0 |
0.1 |
GO:0032695 |
negative regulation of interleukin-12 production(GO:0032695) |
| 0.0 |
0.2 |
GO:0098789 |
pre-mRNA cleavage required for polyadenylation(GO:0098789) |
| 0.0 |
1.7 |
GO:0045454 |
cell redox homeostasis(GO:0045454) |
| 0.0 |
0.3 |
GO:0032096 |
negative regulation of response to food(GO:0032096) negative regulation of appetite(GO:0032099) |
| 0.0 |
0.1 |
GO:0042796 |
snRNA transcription from RNA polymerase III promoter(GO:0042796) |
| 0.0 |
0.2 |
GO:1904153 |
negative regulation of protein exit from endoplasmic reticulum(GO:0070862) negative regulation of retrograde protein transport, ER to cytosol(GO:1904153) |
| 0.0 |
0.0 |
GO:0002331 |
pre-B cell allelic exclusion(GO:0002331) |
| 0.0 |
0.2 |
GO:0051182 |
coenzyme transport(GO:0051182) |
| 0.0 |
0.2 |
GO:0034080 |
CENP-A containing nucleosome assembly(GO:0034080) CENP-A containing chromatin organization(GO:0061641) |
| 0.0 |
1.0 |
GO:0072528 |
pyrimidine-containing compound biosynthetic process(GO:0072528) |
| 0.0 |
0.3 |
GO:0010882 |
regulation of cardiac muscle contraction by regulation of the release of sequestered calcium ion(GO:0010881) regulation of cardiac muscle contraction by calcium ion signaling(GO:0010882) |
| 0.0 |
0.2 |
GO:0050667 |
homocysteine metabolic process(GO:0050667) |
| 0.0 |
0.5 |
GO:0006298 |
mismatch repair(GO:0006298) |
| 0.0 |
0.3 |
GO:0031167 |
rRNA methylation(GO:0031167) |
| 0.0 |
0.5 |
GO:0007608 |
sensory perception of smell(GO:0007608) |
| 0.0 |
0.0 |
GO:0030521 |
androgen receptor signaling pathway(GO:0030521) |
| 0.0 |
0.1 |
GO:0090141 |
positive regulation of mitochondrial fission(GO:0090141) |
| 0.0 |
0.1 |
GO:0061436 |
establishment of skin barrier(GO:0061436) |
| 0.0 |
0.2 |
GO:0045002 |
double-strand break repair via single-strand annealing(GO:0045002) |
| 0.0 |
0.6 |
GO:0060765 |
regulation of androgen receptor signaling pathway(GO:0060765) |
| 0.0 |
0.5 |
GO:0036065 |
fucosylation(GO:0036065) |
| 0.0 |
0.1 |
GO:0003097 |
renal water transport(GO:0003097) |
| 0.0 |
1.1 |
GO:0000380 |
alternative mRNA splicing, via spliceosome(GO:0000380) |
| 0.0 |
0.2 |
GO:0070932 |
histone H3 deacetylation(GO:0070932) |
| 0.0 |
0.1 |
GO:0018242 |
protein O-linked glycosylation via serine(GO:0018242) |
| 0.0 |
0.2 |
GO:2000210 |
positive regulation of anoikis(GO:2000210) |
| 0.0 |
0.0 |
GO:0045910 |
negative regulation of DNA recombination(GO:0045910) |
| 0.0 |
0.8 |
GO:0030488 |
tRNA methylation(GO:0030488) |
| 0.0 |
0.1 |
GO:0002002 |
regulation of angiotensin levels in blood(GO:0002002) |
| 0.0 |
0.4 |
GO:0006152 |
purine nucleoside catabolic process(GO:0006152) purine ribonucleoside catabolic process(GO:0046130) |
| 0.0 |
0.1 |
GO:0042730 |
fibrinolysis(GO:0042730) |
| 0.0 |
0.1 |
GO:0042985 |
negative regulation of amyloid precursor protein biosynthetic process(GO:0042985) |
| 0.0 |
0.2 |
GO:0098532 |
histone H3-K27 trimethylation(GO:0098532) |
| 0.0 |
0.1 |
GO:0045620 |
negative regulation of lymphocyte differentiation(GO:0045620) |
| 0.0 |
0.1 |
GO:0070861 |
regulation of protein exit from endoplasmic reticulum(GO:0070861) |
| 0.0 |
0.2 |
GO:0006895 |
Golgi to endosome transport(GO:0006895) |
| 0.0 |
0.0 |
GO:0002093 |
auditory receptor cell morphogenesis(GO:0002093) |
| 0.0 |
0.1 |
GO:0015910 |
peroxisomal long-chain fatty acid import(GO:0015910) |
| 0.0 |
0.1 |
GO:0006145 |
purine nucleobase catabolic process(GO:0006145) |
| 0.0 |
1.8 |
GO:0007156 |
homophilic cell adhesion via plasma membrane adhesion molecules(GO:0007156) |
| 0.0 |
0.2 |
GO:0001913 |
T cell mediated cytotoxicity(GO:0001913) |
| 0.0 |
0.1 |
GO:0032608 |
interferon-beta production(GO:0032608) |
| 0.0 |
0.1 |
GO:0061635 |
regulation of protein complex stability(GO:0061635) |
| 0.0 |
0.4 |
GO:0051457 |
maintenance of protein location in nucleus(GO:0051457) |
| 0.0 |
0.5 |
GO:0001522 |
pseudouridine synthesis(GO:0001522) |
| 0.0 |
0.7 |
GO:0045670 |
regulation of osteoclast differentiation(GO:0045670) |
| 0.0 |
0.3 |
GO:0030490 |
maturation of SSU-rRNA(GO:0030490) |
| 0.0 |
0.6 |
GO:0095500 |
acetylcholine receptor signaling pathway(GO:0095500) postsynaptic signal transduction(GO:0098926) signal transduction involved in cellular response to ammonium ion(GO:1903831) response to acetylcholine(GO:1905144) cellular response to acetylcholine(GO:1905145) |
| 0.0 |
0.1 |
GO:0071907 |
determination of pancreatic left/right asymmetry(GO:0035469) determination of digestive tract left/right asymmetry(GO:0071907) |
| 0.0 |
0.4 |
GO:0031365 |
N-terminal protein amino acid modification(GO:0031365) |
| 0.0 |
0.1 |
GO:0035994 |
response to muscle stretch(GO:0035994) |
| 0.0 |
0.1 |
GO:0042754 |
negative regulation of circadian rhythm(GO:0042754) |
| 0.0 |
0.1 |
GO:0035964 |
COPI-coated vesicle budding(GO:0035964) |
| 0.0 |
0.1 |
GO:0003417 |
growth plate cartilage development(GO:0003417) |
| 0.0 |
0.2 |
GO:0090207 |
regulation of triglyceride metabolic process(GO:0090207) |
| 0.0 |
0.0 |
GO:2000298 |
regulation of Rho-dependent protein serine/threonine kinase activity(GO:2000298) |
| 0.0 |
0.7 |
GO:0000413 |
protein peptidyl-prolyl isomerization(GO:0000413) |
| 0.0 |
0.1 |
GO:0016480 |
negative regulation of transcription from RNA polymerase III promoter(GO:0016480) |
| 0.0 |
0.1 |
GO:0032877 |
positive regulation of DNA endoreduplication(GO:0032877) |
| 0.0 |
0.5 |
GO:0030225 |
macrophage differentiation(GO:0030225) |
| 0.0 |
0.2 |
GO:0006555 |
methionine metabolic process(GO:0006555) |
| 0.0 |
0.1 |
GO:1902916 |
positive regulation of protein polyubiquitination(GO:1902916) |
| 0.0 |
0.1 |
GO:2000271 |
positive regulation of fibroblast apoptotic process(GO:2000271) |
| 0.0 |
0.1 |
GO:0046501 |
protoporphyrinogen IX metabolic process(GO:0046501) |
| 0.0 |
0.1 |
GO:0048340 |
paraxial mesoderm morphogenesis(GO:0048340) |
| 0.0 |
0.1 |
GO:0010756 |
positive regulation of plasminogen activation(GO:0010756) |
| 0.0 |
1.3 |
GO:0007601 |
visual perception(GO:0007601) |
| 0.0 |
0.1 |
GO:1903963 |
arachidonic acid secretion(GO:0050482) arachidonate transport(GO:1903963) |
| 0.0 |
0.1 |
GO:0050982 |
detection of mechanical stimulus(GO:0050982) |
| 0.0 |
0.2 |
GO:0019800 |
peptide cross-linking via chondroitin 4-sulfate glycosaminoglycan(GO:0019800) |
| 0.0 |
0.3 |
GO:0042274 |
ribosomal small subunit biogenesis(GO:0042274) |
| 0.0 |
0.1 |
GO:0003376 |
sphingosine-1-phosphate signaling pathway(GO:0003376) sphingolipid mediated signaling pathway(GO:0090520) |
| 0.0 |
0.1 |
GO:1990414 |
replication-born double-strand break repair via sister chromatid exchange(GO:1990414) |
| 0.0 |
2.3 |
GO:0006364 |
rRNA processing(GO:0006364) |
| 0.0 |
0.2 |
GO:1900121 |
negative regulation of receptor binding(GO:1900121) |
| 0.0 |
0.1 |
GO:0007195 |
adenylate cyclase-inhibiting dopamine receptor signaling pathway(GO:0007195) |
| 0.0 |
0.1 |
GO:0043144 |
snoRNA processing(GO:0043144) |
| 0.0 |
0.1 |
GO:0060346 |
bone trabecula formation(GO:0060346) |
| 0.0 |
0.3 |
GO:0006744 |
ubiquinone biosynthetic process(GO:0006744) |
| 0.0 |
0.1 |
GO:0038018 |
Wnt receptor catabolic process(GO:0038018) |
| 0.0 |
0.2 |
GO:0006122 |
mitochondrial electron transport, ubiquinol to cytochrome c(GO:0006122) |
| 0.0 |
0.1 |
GO:0036444 |
calcium ion transmembrane import into mitochondrion(GO:0036444) |
| 0.0 |
0.1 |
GO:0021756 |
striatum development(GO:0021756) |
| 0.0 |
0.2 |
GO:0021542 |
dentate gyrus development(GO:0021542) |
| 0.0 |
0.1 |
GO:0019884 |
antigen processing and presentation of exogenous antigen(GO:0019884) |
| 0.0 |
0.0 |
GO:1904139 |
microglial cell migration(GO:1904124) regulation of microglial cell migration(GO:1904139) |
| 0.0 |
0.0 |
GO:0046391 |
5-phosphoribose 1-diphosphate biosynthetic process(GO:0006015) 5-phosphoribose 1-diphosphate metabolic process(GO:0046391) |
| 0.0 |
0.2 |
GO:0006020 |
inositol metabolic process(GO:0006020) |
| 0.0 |
0.4 |
GO:0000301 |
retrograde transport, vesicle recycling within Golgi(GO:0000301) |
| 0.0 |
0.2 |
GO:1902624 |
positive regulation of neutrophil migration(GO:1902624) |
| 0.0 |
0.1 |
GO:0038203 |
TORC2 signaling(GO:0038203) |
| 0.0 |
0.1 |
GO:0045947 |
negative regulation of translational initiation(GO:0045947) |
| 0.0 |
0.1 |
GO:0045065 |
cytotoxic T cell differentiation(GO:0045065) |
| 0.0 |
0.0 |
GO:0033364 |
mast cell secretory granule organization(GO:0033364) |
| 0.0 |
0.1 |
GO:0048733 |
sebaceous gland development(GO:0048733) |
| 0.0 |
0.2 |
GO:0019243 |
methylglyoxal catabolic process to D-lactate via S-lactoyl-glutathione(GO:0019243) methylglyoxal catabolic process(GO:0051596) methylglyoxal catabolic process to lactate(GO:0061727) |
| 0.0 |
0.0 |
GO:0061525 |
hindgut development(GO:0061525) |
| 0.0 |
0.1 |
GO:0006420 |
arginyl-tRNA aminoacylation(GO:0006420) |
| 0.0 |
0.0 |
GO:2000194 |
regulation of female gonad development(GO:2000194) |
| 0.0 |
0.2 |
GO:0001963 |
synaptic transmission, dopaminergic(GO:0001963) |
| 0.0 |
0.0 |
GO:0010452 |
histone H3-K36 methylation(GO:0010452) |
| 0.0 |
0.2 |
GO:0034219 |
carbohydrate transmembrane transport(GO:0034219) |
| 0.0 |
0.3 |
GO:0014912 |
negative regulation of smooth muscle cell migration(GO:0014912) |
| 0.0 |
0.1 |
GO:0045799 |
positive regulation of chromatin assembly or disassembly(GO:0045799) |
| 0.0 |
0.1 |
GO:0071544 |
diphosphoinositol polyphosphate metabolic process(GO:0071543) diphosphoinositol polyphosphate catabolic process(GO:0071544) |
| 0.0 |
0.2 |
GO:0090557 |
establishment of endothelial intestinal barrier(GO:0090557) |
| 0.0 |
0.4 |
GO:0035518 |
histone H2A monoubiquitination(GO:0035518) |
| 0.0 |
0.0 |
GO:0045629 |
negative regulation of T-helper 2 cell differentiation(GO:0045629) |
| 0.0 |
0.2 |
GO:0021799 |
cerebral cortex radially oriented cell migration(GO:0021799) |
| 0.0 |
0.1 |
GO:0014012 |
peripheral nervous system axon regeneration(GO:0014012) |
| 0.0 |
0.1 |
GO:0090394 |
negative regulation of excitatory postsynaptic potential(GO:0090394) |
| 0.0 |
0.3 |
GO:0007218 |
neuropeptide signaling pathway(GO:0007218) |
| 0.0 |
0.0 |
GO:0090286 |
cytoskeletal anchoring at nuclear membrane(GO:0090286) |
| 0.0 |
0.2 |
GO:0043982 |
histone H4-K5 acetylation(GO:0043981) histone H4-K8 acetylation(GO:0043982) |
| 0.0 |
0.0 |
GO:0090220 |
meiotic telomere clustering(GO:0045141) chromosome localization to nuclear envelope involved in homologous chromosome segregation(GO:0090220) |
| 0.0 |
0.0 |
GO:0000715 |
nucleotide-excision repair, DNA damage recognition(GO:0000715) |
| 0.0 |
0.1 |
GO:0006264 |
mitochondrial DNA replication(GO:0006264) mitochondrial DNA metabolic process(GO:0032042) |
| 0.0 |
0.1 |
GO:0003344 |
pericardium morphogenesis(GO:0003344) |
| 0.0 |
0.2 |
GO:0032331 |
negative regulation of chondrocyte differentiation(GO:0032331) |
| 0.0 |
0.3 |
GO:0016926 |
protein desumoylation(GO:0016926) |
| 0.0 |
0.1 |
GO:0045056 |
transcytosis(GO:0045056) |
| 0.0 |
0.1 |
GO:0046294 |
formaldehyde catabolic process(GO:0046294) |
| 0.0 |
0.1 |
GO:0033299 |
secretion of lysosomal enzymes(GO:0033299) |
| 0.0 |
0.2 |
GO:2000772 |
regulation of cellular senescence(GO:2000772) |
| 0.0 |
0.1 |
GO:1904293 |
negative regulation of ERAD pathway(GO:1904293) |
| 0.0 |
0.0 |
GO:0002923 |
regulation of humoral immune response mediated by circulating immunoglobulin(GO:0002923) |
| 0.0 |
0.1 |
GO:0046889 |
positive regulation of lipid biosynthetic process(GO:0046889) |
| 0.0 |
0.1 |
GO:0000055 |
ribosomal large subunit export from nucleus(GO:0000055) |
| 0.0 |
0.1 |
GO:0018103 |
protein C-linked glycosylation(GO:0018103) peptidyl-tryptophan modification(GO:0018211) protein C-linked glycosylation via tryptophan(GO:0018317) protein C-linked glycosylation via 2'-alpha-mannosyl-L-tryptophan(GO:0018406) |
| 0.0 |
0.0 |
GO:0008050 |
courtship behavior(GO:0007619) female courtship behavior(GO:0008050) |
| 0.0 |
0.2 |
GO:0001504 |
neurotransmitter uptake(GO:0001504) |
| 0.0 |
0.1 |
GO:0000972 |
transcription-dependent tethering of RNA polymerase II gene DNA at nuclear periphery(GO:0000972) |
| 0.0 |
0.1 |
GO:0042732 |
D-xylose metabolic process(GO:0042732) |
| 0.0 |
0.0 |
GO:0010726 |
positive regulation of hydrogen peroxide metabolic process(GO:0010726) regulation of hydrogen peroxide biosynthetic process(GO:0010728) |
| 0.0 |
0.2 |
GO:0030497 |
fatty acid elongation(GO:0030497) |
| 0.0 |
0.1 |
GO:0010884 |
positive regulation of lipid storage(GO:0010884) |
| 0.0 |
0.2 |
GO:1901984 |
negative regulation of protein acetylation(GO:1901984) negative regulation of peptidyl-lysine acetylation(GO:2000757) |
| 0.0 |
0.3 |
GO:0052646 |
alditol phosphate metabolic process(GO:0052646) |
| 0.0 |
0.1 |
GO:1900087 |
positive regulation of G1/S transition of mitotic cell cycle(GO:1900087) |
| 0.0 |
0.1 |
GO:0030277 |
maintenance of gastrointestinal epithelium(GO:0030277) |
| 0.0 |
0.0 |
GO:0052428 |
modulation of molecular function in other organism(GO:0044359) negative regulation of molecular function in other organism(GO:0044362) negative regulation of molecular function in other organism involved in symbiotic interaction(GO:0052204) modulation of molecular function in other organism involved in symbiotic interaction(GO:0052205) negative regulation by host of symbiont molecular function(GO:0052405) modification by host of symbiont molecular function(GO:0052428) |
| 0.0 |
0.4 |
GO:0045879 |
negative regulation of smoothened signaling pathway(GO:0045879) |
| 0.0 |
0.1 |
GO:0045047 |
protein targeting to ER(GO:0045047) |
| 0.0 |
0.0 |
GO:0061365 |
positive regulation of triglyceride lipase activity(GO:0061365) |
| 0.0 |
0.0 |
GO:0071596 |
ubiquitin-dependent protein catabolic process via the N-end rule pathway(GO:0071596) |
| 0.0 |
0.1 |
GO:0098501 |
polynucleotide dephosphorylation(GO:0098501) |
| 0.0 |
0.0 |
GO:0090502 |
RNA phosphodiester bond hydrolysis, endonucleolytic(GO:0090502) |
| 0.0 |
0.1 |
GO:0006101 |
citrate metabolic process(GO:0006101) |
| 0.0 |
0.2 |
GO:0045475 |
locomotor rhythm(GO:0045475) |
| 0.0 |
0.1 |
GO:0071985 |
multivesicular body sorting pathway(GO:0071985) |
| 0.0 |
0.1 |
GO:0046621 |
negative regulation of organ growth(GO:0046621) |
| 0.0 |
0.1 |
GO:0060903 |
regulation of meiosis I(GO:0060631) positive regulation of meiosis I(GO:0060903) |
| 0.0 |
0.1 |
GO:0006646 |
phosphatidylethanolamine biosynthetic process(GO:0006646) |
| 0.0 |
0.0 |
GO:0051775 |
response to redox state(GO:0051775) |
| 0.0 |
0.3 |
GO:0010107 |
potassium ion import(GO:0010107) |
| 0.0 |
0.0 |
GO:2000189 |
positive regulation of cholesterol homeostasis(GO:2000189) |
| 0.0 |
0.0 |
GO:1904861 |
excitatory synapse assembly(GO:1904861) |
| 0.0 |
0.1 |
GO:0048102 |
autophagic cell death(GO:0048102) |
| 0.0 |
0.0 |
GO:0035590 |
purinergic nucleotide receptor signaling pathway(GO:0035590) |
| 0.0 |
0.1 |
GO:0019184 |
glutathione biosynthetic process(GO:0006750) nonribosomal peptide biosynthetic process(GO:0019184) |
| 0.0 |
0.0 |
GO:0043461 |
proton-transporting ATP synthase complex assembly(GO:0043461) proton-transporting ATP synthase complex biogenesis(GO:0070272) |
| 0.0 |
0.0 |
GO:0032472 |
Golgi calcium ion transport(GO:0032472) |
| 0.0 |
0.0 |
GO:0033273 |
response to vitamin(GO:0033273) |
| 0.0 |
0.4 |
GO:0035567 |
non-canonical Wnt signaling pathway(GO:0035567) |
| 0.0 |
0.0 |
GO:0018197 |
peptidyl-aspartic acid modification(GO:0018197) |
| 0.0 |
0.0 |
GO:0060312 |
regulation of blood vessel remodeling(GO:0060312) |
| 0.0 |
0.1 |
GO:0030903 |
notochord development(GO:0030903) |
| 0.0 |
0.0 |
GO:1902914 |
regulation of protein polyubiquitination(GO:1902914) |
| 0.0 |
0.1 |
GO:0006896 |
Golgi to vacuole transport(GO:0006896) |
| 0.0 |
0.0 |
GO:0007042 |
lysosomal lumen acidification(GO:0007042) |
| 0.0 |
0.1 |
GO:0001773 |
myeloid dendritic cell activation(GO:0001773) myeloid dendritic cell differentiation(GO:0043011) |
| 0.0 |
0.1 |
GO:0051418 |
interphase microtubule nucleation by interphase microtubule organizing center(GO:0051415) microtubule nucleation by microtubule organizing center(GO:0051418) |
| 0.0 |
0.1 |
GO:0042148 |
strand invasion(GO:0042148) |
| 0.0 |
0.0 |
GO:2000407 |
T cell extravasation(GO:0072683) regulation of T cell extravasation(GO:2000407) positive regulation of T cell extravasation(GO:2000409) |
| 0.0 |
0.3 |
GO:0006349 |
regulation of gene expression by genetic imprinting(GO:0006349) |
| 0.0 |
0.7 |
GO:0008033 |
tRNA processing(GO:0008033) |
| 0.0 |
0.1 |
GO:0051725 |
protein de-ADP-ribosylation(GO:0051725) |
| 0.0 |
0.1 |
GO:0009235 |
cobalamin metabolic process(GO:0009235) |
| 0.0 |
0.1 |
GO:0090166 |
Golgi disassembly(GO:0090166) |
| 0.0 |
0.1 |
GO:0031666 |
positive regulation of lipopolysaccharide-mediated signaling pathway(GO:0031666) |
| 0.0 |
0.0 |
GO:0090382 |
phagosome maturation(GO:0090382) |
| 0.0 |
0.1 |
GO:0006968 |
cellular defense response(GO:0006968) |
| 0.0 |
0.1 |
GO:1900084 |
regulation of peptidyl-tyrosine autophosphorylation(GO:1900084) |
| 0.0 |
0.0 |
GO:0072429 |
response to cell cycle checkpoint signaling(GO:0072396) response to DNA integrity checkpoint signaling(GO:0072402) response to DNA damage checkpoint signaling(GO:0072423) response to intra-S DNA damage checkpoint signaling(GO:0072429) |
| 0.0 |
0.1 |
GO:0032757 |
positive regulation of interleukin-8 production(GO:0032757) |
| 0.0 |
0.9 |
GO:0048814 |
regulation of dendrite morphogenesis(GO:0048814) |
| 0.0 |
0.2 |
GO:0006471 |
protein ADP-ribosylation(GO:0006471) |
| 0.0 |
0.3 |
GO:2001238 |
positive regulation of extrinsic apoptotic signaling pathway(GO:2001238) |
| 0.0 |
0.1 |
GO:0032926 |
negative regulation of activin receptor signaling pathway(GO:0032926) |
| 0.0 |
0.4 |
GO:0006970 |
response to osmotic stress(GO:0006970) |
| 0.0 |
0.0 |
GO:0061302 |
smooth muscle cell-matrix adhesion(GO:0061302) |
| 0.0 |
0.1 |
GO:0048199 |
vesicle targeting, to, from or within Golgi(GO:0048199) |
| 0.0 |
0.1 |
GO:0019355 |
nicotinamide nucleotide biosynthetic process from aspartate(GO:0019355) 'de novo' NAD biosynthetic process(GO:0034627) 'de novo' NAD biosynthetic process from aspartate(GO:0034628) |
| 0.0 |
0.0 |
GO:0003203 |
endocardial cushion morphogenesis(GO:0003203) |
| 0.0 |
0.0 |
GO:1903432 |
TORC1 signaling(GO:0038202) regulation of TORC1 signaling(GO:1903432) |
| 0.0 |
0.2 |
GO:0070536 |
protein K63-linked deubiquitination(GO:0070536) |
| 0.0 |
0.1 |
GO:0006862 |
nucleotide transport(GO:0006862) |
| 0.0 |
0.0 |
GO:0042769 |
DNA damage response, detection of DNA damage(GO:0042769) |
| 0.0 |
0.2 |
GO:0030150 |
protein import into mitochondrial matrix(GO:0030150) |
| 0.0 |
0.0 |
GO:0010640 |
regulation of platelet-derived growth factor receptor signaling pathway(GO:0010640) |
| 0.0 |
0.0 |
GO:1902969 |
mitotic DNA replication(GO:1902969) |
| 0.0 |
0.6 |
GO:0061077 |
chaperone-mediated protein folding(GO:0061077) |
| 0.0 |
0.0 |
GO:0001543 |
ovarian follicle rupture(GO:0001543) |
| 0.0 |
0.1 |
GO:0006729 |
tetrahydrobiopterin biosynthetic process(GO:0006729) tetrahydrobiopterin metabolic process(GO:0046146) |
| 0.0 |
0.0 |
GO:0015889 |
cobalamin transport(GO:0015889) |
| 0.0 |
0.1 |
GO:0071894 |
histone H2B conserved C-terminal lysine ubiquitination(GO:0071894) |
| 0.0 |
0.0 |
GO:0021554 |
optic nerve development(GO:0021554) |
| 0.0 |
0.1 |
GO:0007020 |
microtubule nucleation(GO:0007020) |
| 0.0 |
0.0 |
GO:0090322 |
regulation of superoxide metabolic process(GO:0090322) |
| 0.0 |
0.1 |
GO:0051103 |
DNA ligation involved in DNA repair(GO:0051103) |
| 0.0 |
0.1 |
GO:0035610 |
protein side chain deglutamylation(GO:0035610) |
| 0.0 |
0.2 |
GO:0033539 |
fatty acid beta-oxidation using acyl-CoA dehydrogenase(GO:0033539) |
| 0.0 |
0.1 |
GO:2000394 |
positive regulation of lamellipodium morphogenesis(GO:2000394) |
| 0.0 |
0.0 |
GO:0042447 |
hormone catabolic process(GO:0042447) |
| 0.0 |
0.0 |
GO:0097039 |
protein linear polyubiquitination(GO:0097039) |
| 0.0 |
0.1 |
GO:0021527 |
spinal cord association neuron differentiation(GO:0021527) |
| 0.0 |
0.0 |
GO:0032105 |
negative regulation of response to extracellular stimulus(GO:0032105) negative regulation of response to nutrient levels(GO:0032108) |
| 0.0 |
0.1 |
GO:0006362 |
transcription elongation from RNA polymerase I promoter(GO:0006362) |
| 0.0 |
0.0 |
GO:0006516 |
glycoprotein catabolic process(GO:0006516) |
| 0.0 |
0.1 |
GO:0010390 |
histone monoubiquitination(GO:0010390) |
| 0.0 |
0.0 |
GO:1904425 |
negative regulation of GTP binding(GO:1904425) |
| 0.0 |
0.0 |
GO:0038089 |
positive regulation of cell migration by vascular endothelial growth factor signaling pathway(GO:0038089) |
| 0.0 |
0.0 |
GO:0030851 |
granulocyte differentiation(GO:0030851) |
| 0.0 |
0.1 |
GO:0071577 |
zinc II ion transmembrane transport(GO:0071577) |
| 0.0 |
0.1 |
GO:0051084 |
'de novo' protein folding(GO:0006458) 'de novo' posttranslational protein folding(GO:0051084) |
| 0.0 |
0.1 |
GO:0032148 |
activation of protein kinase B activity(GO:0032148) |
| 0.0 |
0.7 |
GO:0006402 |
mRNA catabolic process(GO:0006402) |
| 0.0 |
0.2 |
GO:0022904 |
respiratory electron transport chain(GO:0022904) |
| 0.0 |
0.2 |
GO:0045116 |
protein neddylation(GO:0045116) |
| 0.0 |
0.0 |
GO:2000047 |
regulation of cell-cell adhesion mediated by cadherin(GO:2000047) |
| 0.0 |
0.1 |
GO:0048246 |
macrophage chemotaxis(GO:0048246) |
| 0.0 |
0.0 |
GO:0015014 |
heparan sulfate proteoglycan biosynthetic process, polysaccharide chain biosynthetic process(GO:0015014) |
| 0.0 |
0.2 |
GO:0042073 |
intraciliary transport(GO:0042073) protein transport along microtubule(GO:0098840) |
| 0.0 |
0.0 |
GO:1903587 |
regulation of blood vessel endothelial cell proliferation involved in sprouting angiogenesis(GO:1903587) |
| 0.0 |
0.0 |
GO:0007158 |
neuron cell-cell adhesion(GO:0007158) |
| 0.0 |
0.0 |
GO:0006269 |
DNA replication, synthesis of RNA primer(GO:0006269) |
| 0.0 |
0.0 |
GO:0006297 |
nucleotide-excision repair, DNA gap filling(GO:0006297) |
| 0.0 |
0.0 |
GO:0034285 |
response to sucrose(GO:0009744) response to disaccharide(GO:0034285) |
| 0.0 |
0.0 |
GO:0006287 |
base-excision repair, gap-filling(GO:0006287) |
| 0.0 |
0.0 |
GO:0035372 |
protein localization to microtubule(GO:0035372) |
| 0.0 |
0.0 |
GO:0090529 |
barrier septum assembly(GO:0000917) cell septum assembly(GO:0090529) |
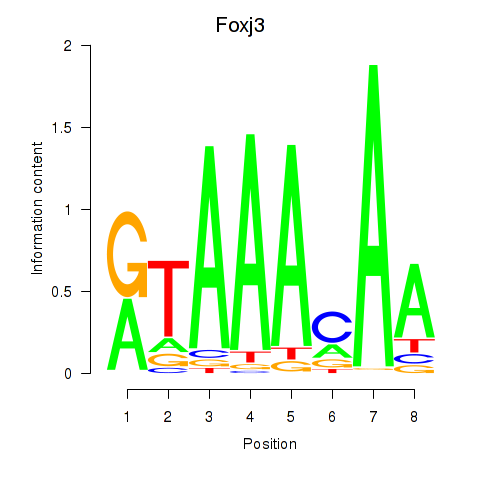
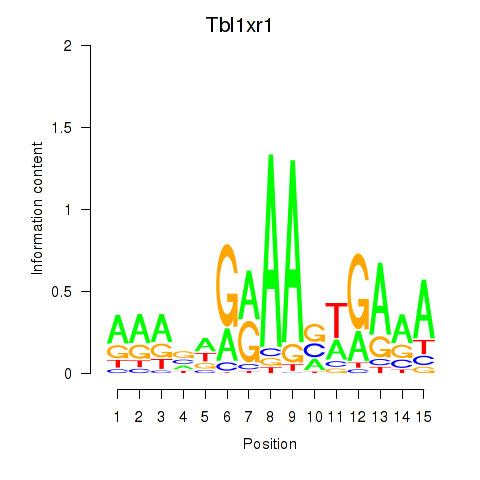
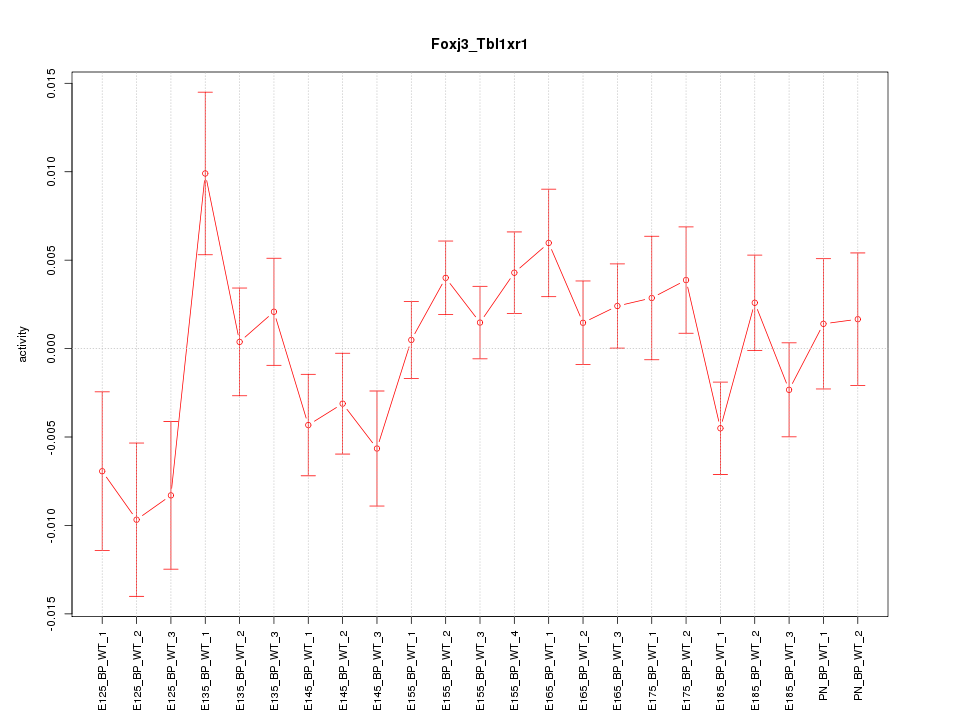
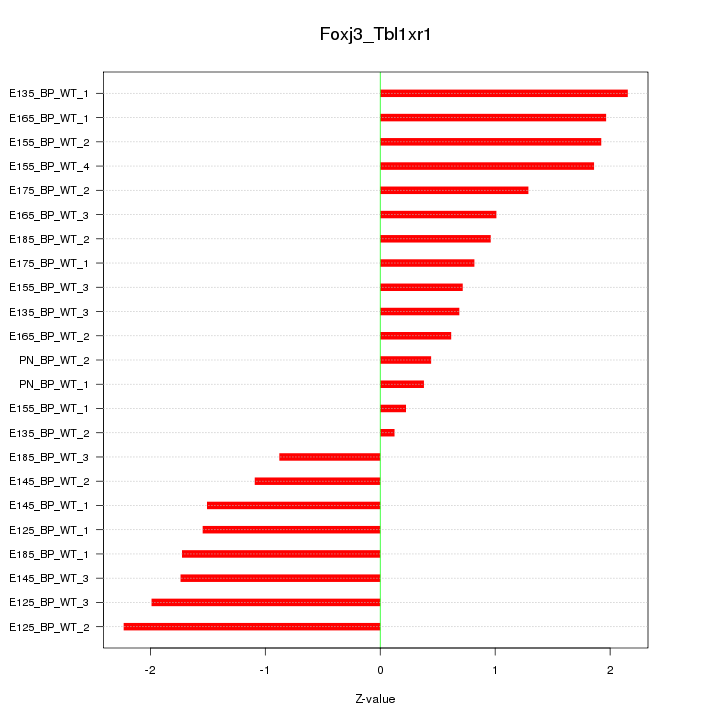

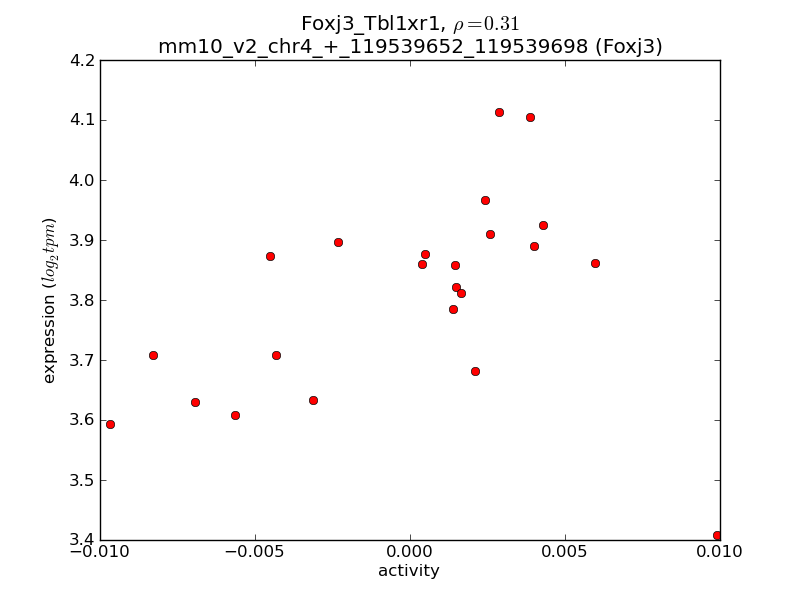
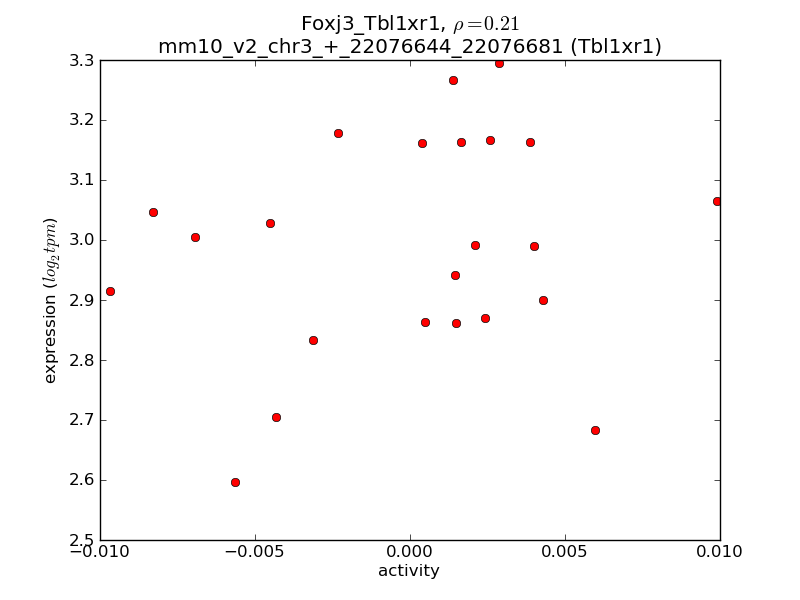
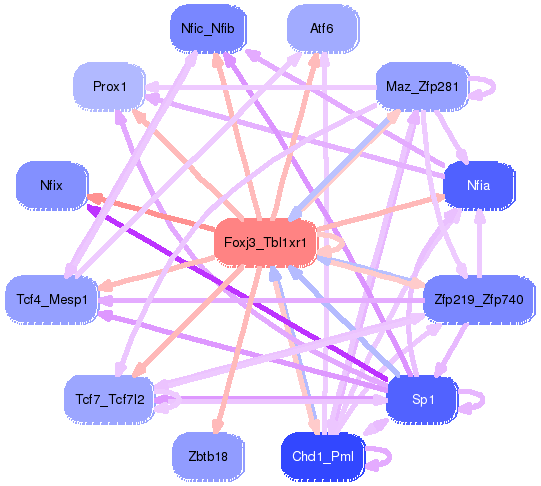