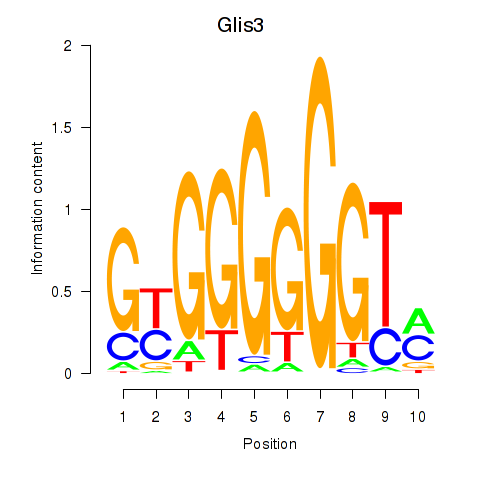
| 0.6 |
6.4 |
GO:0042572 |
retinol metabolic process(GO:0042572) |
| 0.3 |
2.4 |
GO:0060665 |
regulation of branching involved in salivary gland morphogenesis by mesenchymal-epithelial signaling(GO:0060665) |
| 0.1 |
0.4 |
GO:0070172 |
oculomotor nerve development(GO:0021557) positive regulation of tooth mineralization(GO:0070172) |
| 0.1 |
0.4 |
GO:0071649 |
regulation of chemokine (C-C motif) ligand 5 production(GO:0071649) |
| 0.1 |
0.5 |
GO:0042414 |
epinephrine metabolic process(GO:0042414) |
| 0.1 |
0.5 |
GO:0014043 |
negative regulation of neuron maturation(GO:0014043) |
| 0.1 |
0.6 |
GO:0070345 |
negative regulation of fat cell proliferation(GO:0070345) |
| 0.1 |
0.7 |
GO:0070814 |
hydrogen sulfide biosynthetic process(GO:0070814) |
| 0.1 |
0.3 |
GO:0035426 |
extracellular matrix-cell signaling(GO:0035426) |
| 0.1 |
0.2 |
GO:0003100 |
angiotensin mediated vasoconstriction involved in regulation of systemic arterial blood pressure(GO:0001998) regulation of blood vessel size by renin-angiotensin(GO:0002034) renal control of peripheral vascular resistance involved in regulation of systemic arterial blood pressure(GO:0003072) regulation of systemic arterial blood pressure by endothelin(GO:0003100) beta selection(GO:0043366) |
| 0.1 |
0.2 |
GO:0010845 |
positive regulation of reciprocal meiotic recombination(GO:0010845) |
| 0.1 |
0.4 |
GO:0051151 |
negative regulation of smooth muscle cell differentiation(GO:0051151) |
| 0.1 |
0.6 |
GO:0038028 |
insulin receptor signaling pathway via phosphatidylinositol 3-kinase(GO:0038028) |
| 0.1 |
0.9 |
GO:0060746 |
parental behavior(GO:0060746) |
| 0.1 |
0.6 |
GO:0019368 |
fatty acid elongation, saturated fatty acid(GO:0019367) fatty acid elongation, unsaturated fatty acid(GO:0019368) fatty acid elongation, monounsaturated fatty acid(GO:0034625) fatty acid elongation, polyunsaturated fatty acid(GO:0034626) |
| 0.1 |
0.3 |
GO:0021914 |
negative regulation of smoothened signaling pathway involved in ventral spinal cord patterning(GO:0021914) |
| 0.1 |
0.4 |
GO:0010571 |
positive regulation of nuclear cell cycle DNA replication(GO:0010571) |
| 0.1 |
0.2 |
GO:0003032 |
detection of oxygen(GO:0003032) |
| 0.1 |
0.2 |
GO:0051599 |
response to hydrostatic pressure(GO:0051599) |
| 0.0 |
0.2 |
GO:0030240 |
skeletal muscle thin filament assembly(GO:0030240) |
| 0.0 |
0.2 |
GO:0060903 |
positive regulation of meiosis I(GO:0060903) |
| 0.0 |
0.3 |
GO:2000672 |
negative regulation of motor neuron apoptotic process(GO:2000672) |
| 0.0 |
0.3 |
GO:0010587 |
miRNA catabolic process(GO:0010587) |
| 0.0 |
0.1 |
GO:1903265 |
positive regulation of tumor necrosis factor-mediated signaling pathway(GO:1903265) |
| 0.0 |
0.1 |
GO:0072718 |
response to cisplatin(GO:0072718) |
| 0.0 |
0.2 |
GO:0015840 |
urea transport(GO:0015840) urea transmembrane transport(GO:0071918) |
| 0.0 |
0.3 |
GO:0060613 |
fat pad development(GO:0060613) |
| 0.0 |
0.2 |
GO:0071732 |
cellular response to nitric oxide(GO:0071732) |
| 0.0 |
0.5 |
GO:2000001 |
regulation of DNA damage checkpoint(GO:2000001) |
| 0.0 |
0.2 |
GO:0051574 |
positive regulation of histone H3-K9 methylation(GO:0051574) |
| 0.0 |
0.2 |
GO:0048387 |
negative regulation of retinoic acid receptor signaling pathway(GO:0048387) |
| 0.0 |
0.2 |
GO:0048742 |
regulation of skeletal muscle fiber development(GO:0048742) regulation of branching morphogenesis of a nerve(GO:2000172) |
| 0.0 |
0.2 |
GO:0070914 |
UV-damage excision repair(GO:0070914) |
| 0.0 |
0.1 |
GO:1900112 |
regulation of histone H3-K9 trimethylation(GO:1900112) negative regulation of histone H3-K9 trimethylation(GO:1900113) |
| 0.0 |
0.1 |
GO:0051305 |
chromosome movement towards spindle pole(GO:0051305) |
| 0.0 |
0.6 |
GO:0060325 |
face morphogenesis(GO:0060325) |
| 0.0 |
0.1 |
GO:1905049 |
negative regulation of metalloendopeptidase activity(GO:1904684) negative regulation of metallopeptidase activity(GO:1905049) |
| 0.0 |
0.3 |
GO:0033235 |
positive regulation of protein sumoylation(GO:0033235) |
| 0.0 |
0.2 |
GO:0002467 |
germinal center formation(GO:0002467) |


