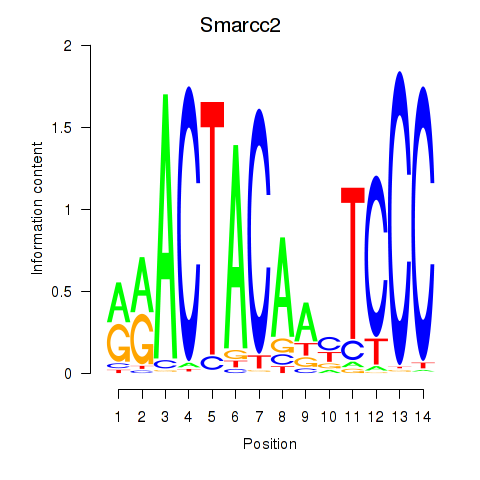
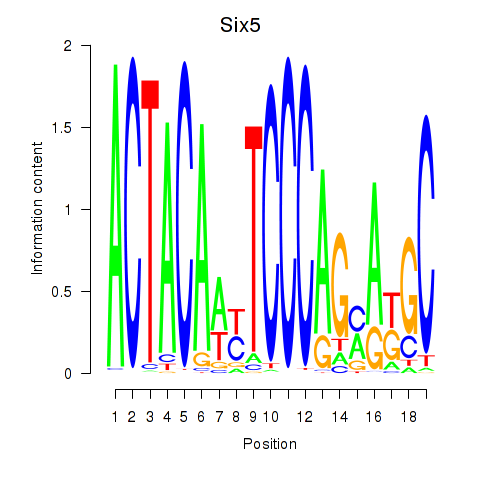
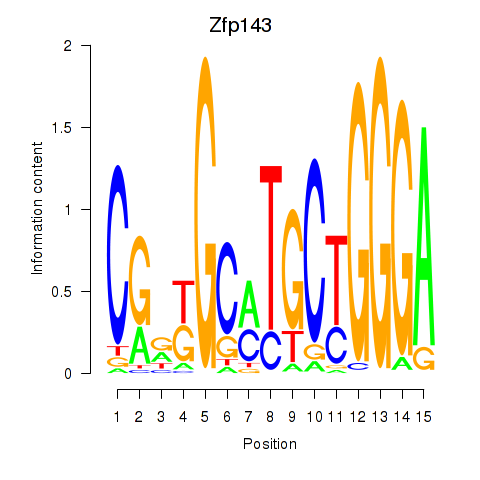
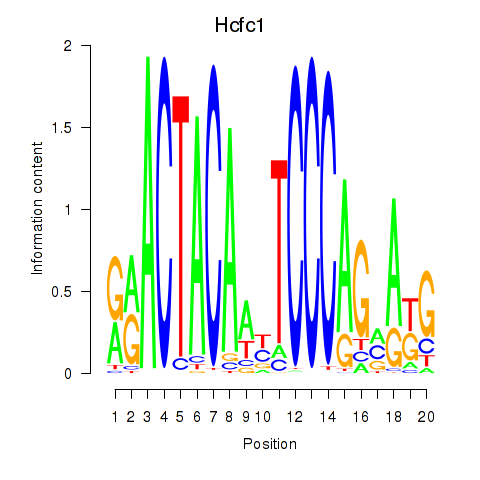
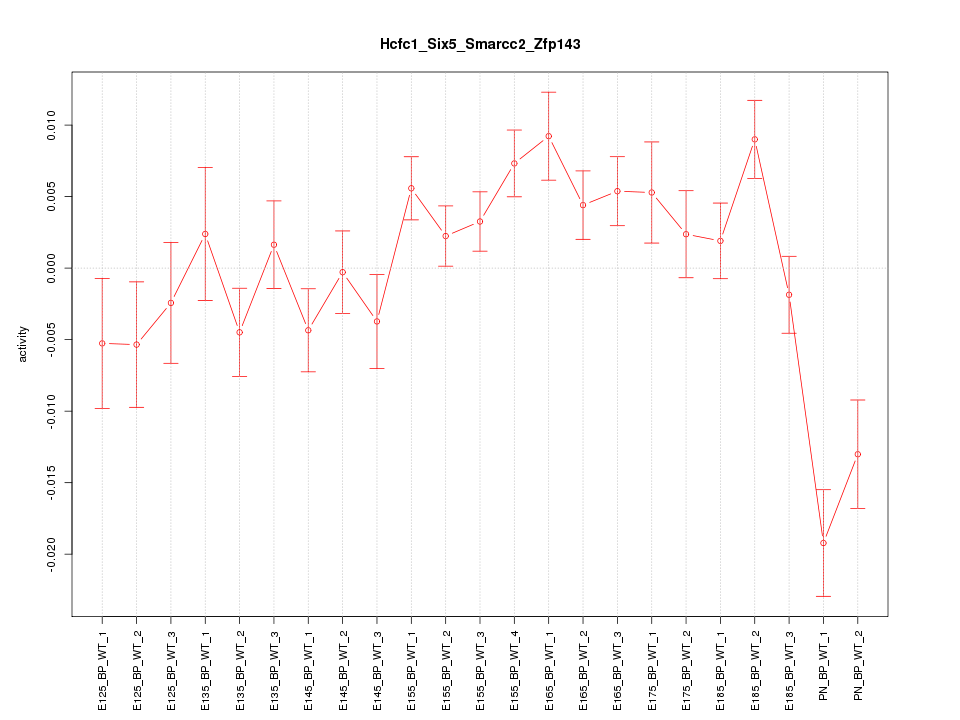
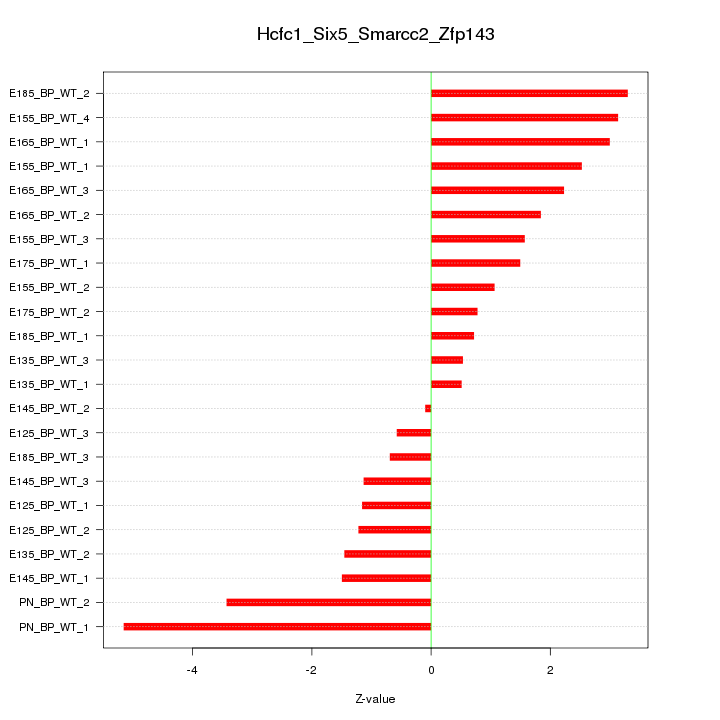
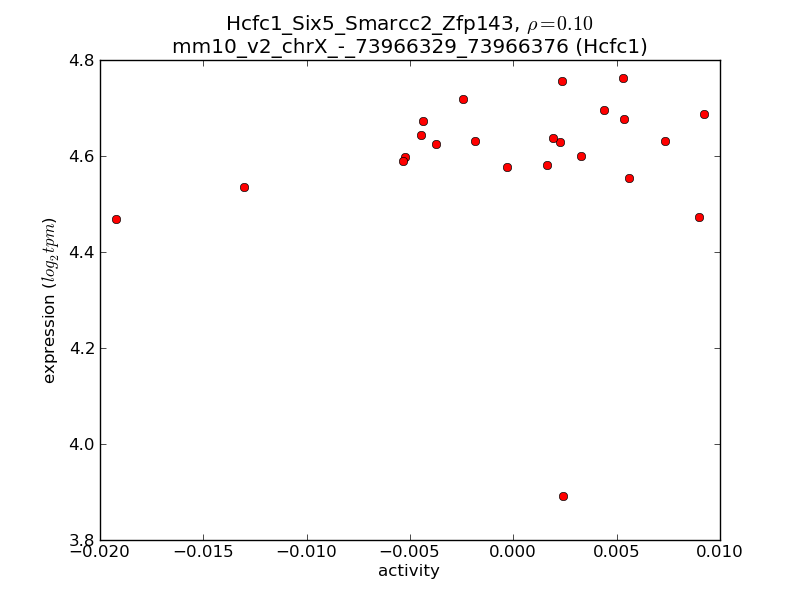
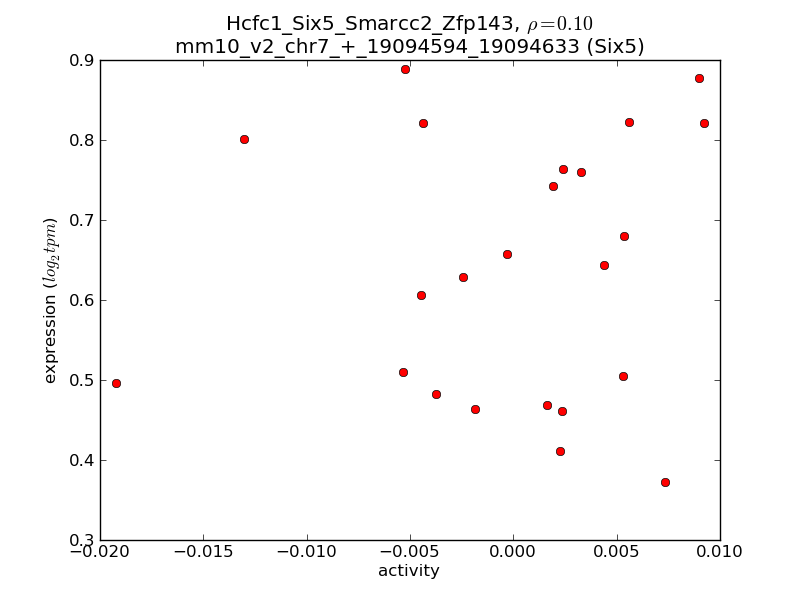
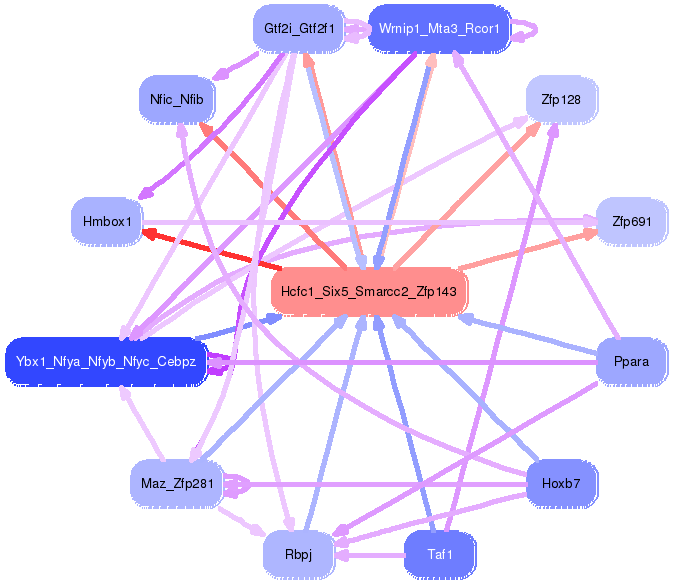
Motif ID: Hcfc1_Six5_Smarcc2_Zfp143
Z-value: 2.081
Transcription factors associated with Hcfc1_Six5_Smarcc2_Zfp143:
| Gene Symbol | Entrez ID | Gene Name |
|---|---|---|
| Hcfc1 | ENSMUSG00000031386.8 | Hcfc1 |
| Six5 | ENSMUSG00000040841.5 | Six5 |
| Smarcc2 | ENSMUSG00000025369.8 | Smarcc2 |
| Zfp143 | ENSMUSG00000061079.7 | Zfp143 |
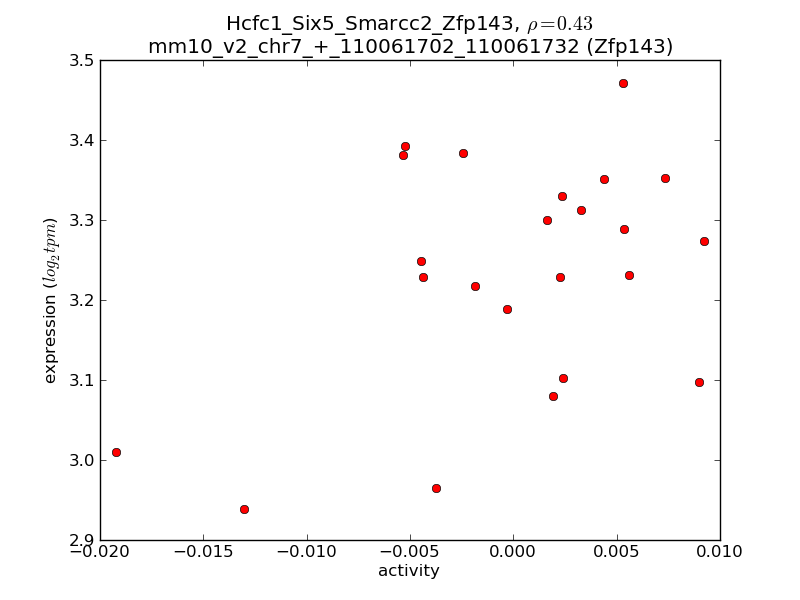
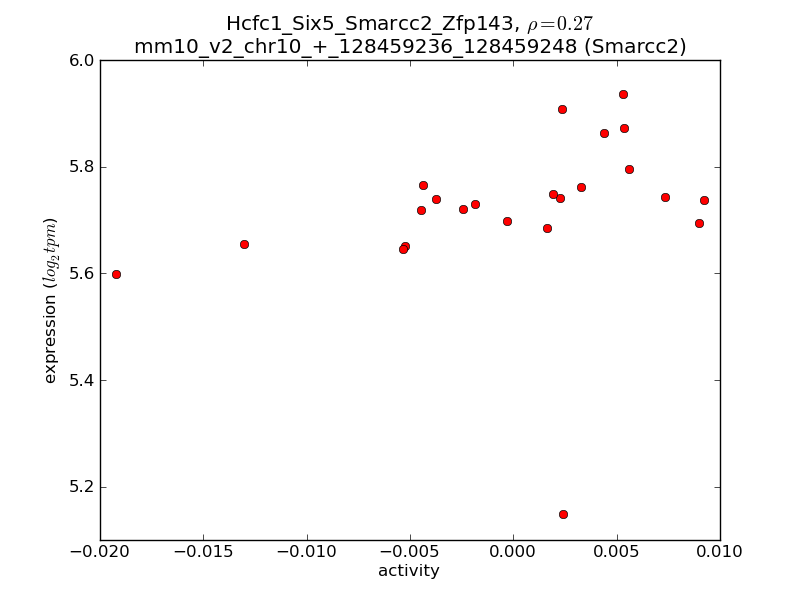
Activity-expression correlation:
| Gene Symbol | Promoter | Pearson corr. coef. | P-value | Plot |
|---|---|---|---|---|
| Zfp143 | mm10_v2_chr7_+_110061702_110061732 | 0.43 | 4.0e-02 | Click! |
| Smarcc2 | mm10_v2_chr10_+_128459236_128459248 | 0.27 | 2.1e-01 | Click! |
| Hcfc1 | mm10_v2_chrX_-_73966329_73966376 | 0.10 | 6.4e-01 | Click! |
| Six5 | mm10_v2_chr7_+_19094594_19094633 | 0.10 | 6.6e-01 | Click! |

Top targets:
Gene overrepresentation in biological_process category:
| Log-likelihood per target | Total log-likelihood | Term | Description |
|---|---|---|---|
| 0.9 | 3.5 | GO:2001106 | regulation of Rho guanyl-nucleotide exchange factor activity(GO:2001106) |
| 0.6 | 3.5 | GO:0042045 | epithelial fluid transport(GO:0042045) |
| 0.5 | 1.4 | GO:0035864 | response to potassium ion(GO:0035864) cellular response to potassium ion(GO:0035865) |
| 0.5 | 1.4 | GO:0072531 | pyrimidine-containing compound transmembrane transport(GO:0072531) |
| 0.4 | 2.0 | GO:0014886 | transition between slow and fast fiber(GO:0014886) |
| 0.4 | 1.5 | GO:0045343 | MHC class I biosynthetic process(GO:0045341) regulation of MHC class I biosynthetic process(GO:0045343) positive regulation of MHC class I biosynthetic process(GO:0045345) |
| 0.4 | 2.2 | GO:0009235 | cobalamin metabolic process(GO:0009235) |
| 0.4 | 1.8 | GO:0051697 | protein delipidation(GO:0051697) |
| 0.4 | 1.1 | GO:0021837 | motogenic signaling involved in postnatal olfactory bulb interneuron migration(GO:0021837) positive regulation of mitotic cell cycle DNA replication(GO:1903465) |
| 0.3 | 4.7 | GO:0035563 | positive regulation of chromatin binding(GO:0035563) |
| 0.3 | 1.8 | GO:0032483 | regulation of Rab protein signal transduction(GO:0032483) |
| 0.2 | 0.7 | GO:0009644 | response to high light intensity(GO:0009644) |
| 0.2 | 2.6 | GO:1902018 | negative regulation of cilium assembly(GO:1902018) |
| 0.2 | 0.7 | GO:0035621 | ER to Golgi ceramide transport(GO:0035621) ceramide transport(GO:0035627) |
| 0.2 | 1.3 | GO:0051013 | microtubule severing(GO:0051013) |
| 0.2 | 0.4 | GO:0009642 | response to light intensity(GO:0009642) |
| 0.2 | 0.6 | GO:1903896 | positive regulation of IRE1-mediated unfolded protein response(GO:1903896) |
| 0.2 | 0.6 | GO:0071476 | cellular hypotonic response(GO:0071476) |
| 0.2 | 0.8 | GO:0060971 | embryonic heart tube left/right pattern formation(GO:0060971) |
| 0.2 | 0.6 | GO:0035552 | oxidative single-stranded DNA demethylation(GO:0035552) |
| 0.2 | 0.6 | GO:0000350 | generation of catalytic spliceosome for second transesterification step(GO:0000350) |
| 0.2 | 0.6 | GO:2000616 | negative regulation of histone H3-K9 acetylation(GO:2000616) |
| 0.2 | 1.3 | GO:0002051 | osteoblast fate commitment(GO:0002051) |
| 0.2 | 0.7 | GO:0090188 | negative regulation of pancreatic juice secretion(GO:0090188) |
| 0.2 | 0.7 | GO:0046726 | positive regulation by virus of viral protein levels in host cell(GO:0046726) |
| 0.2 | 0.7 | GO:0060334 | regulation of interferon-gamma-mediated signaling pathway(GO:0060334) |
| 0.2 | 0.8 | GO:0090038 | negative regulation of protein kinase C signaling(GO:0090038) |
| 0.2 | 0.8 | GO:0009052 | pentose-phosphate shunt, non-oxidative branch(GO:0009052) |
| 0.2 | 0.5 | GO:0000087 | mitotic M phase(GO:0000087) |
| 0.2 | 0.5 | GO:0071921 | establishment of sister chromatid cohesion(GO:0034085) cohesin loading(GO:0071921) regulation of cohesin loading(GO:0071922) |
| 0.1 | 0.9 | GO:0000733 | DNA strand renaturation(GO:0000733) |
| 0.1 | 0.6 | GO:0043987 | histone H3-S10 phosphorylation(GO:0043987) |
| 0.1 | 0.7 | GO:0036508 | protein deglycosylation involved in glycoprotein catabolic process(GO:0035977) protein demannosylation(GO:0036507) protein alpha-1,2-demannosylation(GO:0036508) mannose trimming involved in glycoprotein ERAD pathway(GO:1904382) |
| 0.1 | 0.7 | GO:0060178 | regulation of exocyst localization(GO:0060178) |
| 0.1 | 0.4 | GO:0042505 | tyrosine phosphorylation of Stat6 protein(GO:0042505) regulation of tyrosine phosphorylation of Stat6 protein(GO:0042525) |
| 0.1 | 0.5 | GO:2001045 | closure of optic fissure(GO:0061386) negative regulation of integrin-mediated signaling pathway(GO:2001045) |
| 0.1 | 0.3 | GO:0036112 | medium-chain fatty-acyl-CoA metabolic process(GO:0036112) |
| 0.1 | 1.5 | GO:0007076 | mitotic chromosome condensation(GO:0007076) |
| 0.1 | 1.7 | GO:1990403 | embryonic brain development(GO:1990403) |
| 0.1 | 0.2 | GO:0042790 | transcription of nuclear large rRNA transcript from RNA polymerase I promoter(GO:0042790) |
| 0.1 | 0.3 | GO:0035519 | protein K29-linked ubiquitination(GO:0035519) |
| 0.1 | 0.6 | GO:0014022 | neural plate elongation(GO:0014022) convergent extension involved in neural plate elongation(GO:0022007) |
| 0.1 | 0.4 | GO:0071596 | ubiquitin-dependent protein catabolic process via the N-end rule pathway(GO:0071596) |
| 0.1 | 0.3 | GO:0000454 | snoRNA guided rRNA pseudouridine synthesis(GO:0000454) |
| 0.1 | 0.3 | GO:0060399 | positive regulation of growth hormone receptor signaling pathway(GO:0060399) |
| 0.1 | 0.6 | GO:0034227 | tRNA thio-modification(GO:0034227) |
| 0.1 | 1.0 | GO:0048341 | paraxial mesoderm formation(GO:0048341) |
| 0.1 | 0.5 | GO:0034968 | histone lysine methylation(GO:0034968) |
| 0.1 | 0.4 | GO:0061511 | centriole elongation(GO:0061511) |
| 0.1 | 0.2 | GO:0000389 | mRNA 3'-splice site recognition(GO:0000389) |
| 0.1 | 0.5 | GO:0060447 | bud outgrowth involved in lung branching(GO:0060447) |
| 0.1 | 0.2 | GO:0071034 | CUT catabolic process(GO:0071034) CUT metabolic process(GO:0071043) |
| 0.1 | 0.3 | GO:0044849 | estrous cycle(GO:0044849) |
| 0.1 | 0.5 | GO:0046501 | protoporphyrinogen IX metabolic process(GO:0046501) |
| 0.1 | 0.3 | GO:0035574 | histone H4-K20 demethylation(GO:0035574) |
| 0.1 | 0.5 | GO:1902774 | late endosome to lysosome transport(GO:1902774) |
| 0.1 | 1.3 | GO:0006107 | oxaloacetate metabolic process(GO:0006107) |
| 0.1 | 0.3 | GO:0016598 | protein arginylation(GO:0016598) |
| 0.1 | 0.3 | GO:0051189 | Mo-molybdopterin cofactor biosynthetic process(GO:0006777) Mo-molybdopterin cofactor metabolic process(GO:0019720) molybdopterin cofactor biosynthetic process(GO:0032324) molybdopterin cofactor metabolic process(GO:0043545) prosthetic group metabolic process(GO:0051189) |
| 0.1 | 0.3 | GO:0051151 | negative regulation of smooth muscle cell differentiation(GO:0051151) |
| 0.1 | 0.5 | GO:0051694 | pointed-end actin filament capping(GO:0051694) |
| 0.1 | 0.3 | GO:0060912 | cardiac cell fate specification(GO:0060912) |
| 0.1 | 0.7 | GO:0015919 | peroxisomal membrane transport(GO:0015919) protein import into peroxisome membrane(GO:0045046) |
| 0.1 | 0.9 | GO:1990126 | retrograde transport, endosome to plasma membrane(GO:1990126) |
| 0.1 | 1.3 | GO:0042407 | cristae formation(GO:0042407) |
| 0.1 | 1.1 | GO:0015937 | coenzyme A biosynthetic process(GO:0015937) |
| 0.1 | 0.5 | GO:0007217 | tachykinin receptor signaling pathway(GO:0007217) |
| 0.1 | 0.4 | GO:1902775 | mitochondrial large ribosomal subunit assembly(GO:1902775) |
| 0.1 | 0.3 | GO:0010793 | regulation of mRNA export from nucleus(GO:0010793) regulation of ribonucleoprotein complex localization(GO:2000197) |
| 0.1 | 0.8 | GO:0034498 | early endosome to Golgi transport(GO:0034498) |
| 0.1 | 0.5 | GO:0045743 | positive regulation of fibroblast growth factor receptor signaling pathway(GO:0045743) |
| 0.1 | 0.1 | GO:0045041 | protein import into mitochondrial intermembrane space(GO:0045041) |
| 0.1 | 1.0 | GO:0006103 | 2-oxoglutarate metabolic process(GO:0006103) |
| 0.1 | 0.3 | GO:1901524 | regulation of macromitophagy(GO:1901524) negative regulation of macromitophagy(GO:1901525) |
| 0.1 | 0.9 | GO:0000059 | protein import into nucleus, docking(GO:0000059) |
| 0.1 | 0.4 | GO:0070417 | cellular response to cold(GO:0070417) |
| 0.1 | 0.5 | GO:0008616 | queuosine biosynthetic process(GO:0008616) queuosine metabolic process(GO:0046116) |
| 0.1 | 0.2 | GO:0046959 | habituation(GO:0046959) |
| 0.1 | 0.4 | GO:0036066 | protein O-linked fucosylation(GO:0036066) |
| 0.1 | 3.3 | GO:0007029 | endoplasmic reticulum organization(GO:0007029) |
| 0.1 | 0.2 | GO:0072070 | loop of Henle development(GO:0072070) metanephric loop of Henle development(GO:0072236) |
| 0.1 | 0.1 | GO:0000480 | endonucleolytic cleavage in 5'-ETS of tricistronic rRNA transcript (SSU-rRNA, 5.8S rRNA, LSU-rRNA)(GO:0000480) |
| 0.1 | 0.2 | GO:0001561 | fatty acid alpha-oxidation(GO:0001561) |
| 0.1 | 0.4 | GO:0061042 | vascular wound healing(GO:0061042) |
| 0.1 | 0.3 | GO:0034184 | positive regulation of maintenance of sister chromatid cohesion(GO:0034093) positive regulation of maintenance of mitotic sister chromatid cohesion(GO:0034184) |
| 0.1 | 0.3 | GO:1901165 | positive regulation of trophoblast cell migration(GO:1901165) |
| 0.1 | 0.1 | GO:0007039 | protein catabolic process in the vacuole(GO:0007039) |
| 0.1 | 0.4 | GO:0016078 | tRNA catabolic process(GO:0016078) |
| 0.1 | 0.3 | GO:0060665 | regulation of branching involved in salivary gland morphogenesis by mesenchymal-epithelial signaling(GO:0060665) |
| 0.1 | 0.6 | GO:0007000 | nucleolus organization(GO:0007000) |
| 0.1 | 1.0 | GO:0007530 | sex determination(GO:0007530) |
| 0.1 | 0.1 | GO:0034140 | negative regulation of toll-like receptor 3 signaling pathway(GO:0034140) |
| 0.1 | 0.5 | GO:0016114 | terpenoid biosynthetic process(GO:0016114) |
| 0.1 | 0.2 | GO:0048386 | positive regulation of retinoic acid receptor signaling pathway(GO:0048386) |
| 0.1 | 0.2 | GO:0018214 | peptidyl-glutamic acid carboxylation(GO:0017187) protein carboxylation(GO:0018214) |
| 0.1 | 0.2 | GO:0002184 | cytoplasmic translational termination(GO:0002184) |
| 0.1 | 0.4 | GO:0035405 | histone-threonine phosphorylation(GO:0035405) |
| 0.1 | 0.2 | GO:1903265 | positive regulation of tumor necrosis factor-mediated signaling pathway(GO:1903265) |
| 0.1 | 0.2 | GO:0031581 | hemidesmosome assembly(GO:0031581) |
| 0.1 | 2.5 | GO:0006493 | protein O-linked glycosylation(GO:0006493) |
| 0.1 | 0.2 | GO:0000019 | regulation of mitotic recombination(GO:0000019) |
| 0.1 | 0.4 | GO:0032308 | positive regulation of prostaglandin secretion(GO:0032308) |
| 0.1 | 0.5 | GO:0035871 | protein K11-linked deubiquitination(GO:0035871) |
| 0.1 | 0.4 | GO:0010820 | positive regulation of T cell chemotaxis(GO:0010820) |
| 0.1 | 0.2 | GO:1903587 | regulation of blood vessel endothelial cell proliferation involved in sprouting angiogenesis(GO:1903587) |
| 0.1 | 0.6 | GO:0097034 | mitochondrial respiratory chain complex IV assembly(GO:0033617) mitochondrial respiratory chain complex IV biogenesis(GO:0097034) |
| 0.1 | 2.6 | GO:0045668 | negative regulation of osteoblast differentiation(GO:0045668) |
| 0.1 | 0.4 | GO:0034351 | negative regulation of glial cell apoptotic process(GO:0034351) |
| 0.1 | 0.4 | GO:0019370 | leukotriene biosynthetic process(GO:0019370) |
| 0.1 | 0.2 | GO:0031349 | positive regulation of defense response(GO:0031349) |
| 0.1 | 0.5 | GO:0042760 | very long-chain fatty acid catabolic process(GO:0042760) |
| 0.0 | 0.1 | GO:0006867 | asparagine transport(GO:0006867) glutamine transport(GO:0006868) |
| 0.0 | 0.2 | GO:0002922 | positive regulation of humoral immune response(GO:0002922) |
| 0.0 | 1.1 | GO:2000369 | regulation of clathrin-mediated endocytosis(GO:2000369) |
| 0.0 | 0.3 | GO:0090503 | RNA phosphodiester bond hydrolysis, exonucleolytic(GO:0090503) |
| 0.0 | 0.1 | GO:2001286 | regulation of caveolin-mediated endocytosis(GO:2001286) |
| 0.0 | 0.5 | GO:0046784 | viral mRNA export from host cell nucleus(GO:0046784) |
| 0.0 | 0.6 | GO:0006388 | tRNA splicing, via endonucleolytic cleavage and ligation(GO:0006388) |
| 0.0 | 0.1 | GO:0032240 | negative regulation of nucleobase-containing compound transport(GO:0032240) negative regulation of RNA export from nucleus(GO:0046832) |
| 0.0 | 0.2 | GO:0051045 | negative regulation of membrane protein ectodomain proteolysis(GO:0051045) |
| 0.0 | 0.1 | GO:0040009 | regulation of growth rate(GO:0040009) |
| 0.0 | 0.3 | GO:0071955 | recycling endosome to Golgi transport(GO:0071955) |
| 0.0 | 0.9 | GO:0016226 | iron-sulfur cluster assembly(GO:0016226) metallo-sulfur cluster assembly(GO:0031163) |
| 0.0 | 0.1 | GO:0006296 | base-excision repair, AP site formation(GO:0006285) nucleotide-excision repair, DNA incision, 5'-to lesion(GO:0006296) |
| 0.0 | 0.2 | GO:0034975 | protein folding in endoplasmic reticulum(GO:0034975) |
| 0.0 | 0.2 | GO:0034145 | positive regulation of toll-like receptor 4 signaling pathway(GO:0034145) |
| 0.0 | 0.5 | GO:0030866 | cortical actin cytoskeleton organization(GO:0030866) |
| 0.0 | 0.2 | GO:0008655 | pyrimidine-containing compound salvage(GO:0008655) pyrimidine nucleoside salvage(GO:0043097) |
| 0.0 | 0.8 | GO:0000301 | retrograde transport, vesicle recycling within Golgi(GO:0000301) |
| 0.0 | 0.1 | GO:0048611 | ectodermal digestive tract development(GO:0007439) embryonic ectodermal digestive tract development(GO:0048611) |
| 0.0 | 0.8 | GO:0043968 | histone H2A acetylation(GO:0043968) |
| 0.0 | 0.0 | GO:0070555 | response to interleukin-1(GO:0070555) |
| 0.0 | 0.3 | GO:0072393 | microtubule anchoring at microtubule organizing center(GO:0072393) |
| 0.0 | 0.1 | GO:0048633 | positive regulation of skeletal muscle tissue growth(GO:0048633) |
| 0.0 | 0.4 | GO:0035457 | cellular response to interferon-alpha(GO:0035457) |
| 0.0 | 0.2 | GO:0072383 | plus-end-directed vesicle transport along microtubule(GO:0072383) plus-end-directed organelle transport along microtubule(GO:0072386) |
| 0.0 | 0.1 | GO:2001271 | negative regulation of cysteine-type endopeptidase activity involved in execution phase of apoptosis(GO:2001271) |
| 0.0 | 0.4 | GO:0032926 | negative regulation of activin receptor signaling pathway(GO:0032926) |
| 0.0 | 0.2 | GO:0070126 | mitochondrial translational termination(GO:0070126) |
| 0.0 | 3.0 | GO:0051453 | regulation of intracellular pH(GO:0051453) |
| 0.0 | 3.9 | GO:0016579 | protein deubiquitination(GO:0016579) |
| 0.0 | 1.1 | GO:0030970 | retrograde protein transport, ER to cytosol(GO:0030970) |
| 0.0 | 3.6 | GO:0098792 | xenophagy(GO:0098792) |
| 0.0 | 0.3 | GO:0030174 | regulation of DNA-dependent DNA replication initiation(GO:0030174) |
| 0.0 | 0.1 | GO:0072656 | maintenance of protein location in mitochondrion(GO:0072656) |
| 0.0 | 0.3 | GO:2000051 | negative regulation of non-canonical Wnt signaling pathway(GO:2000051) |
| 0.0 | 0.1 | GO:0043504 | mitochondrial DNA repair(GO:0043504) |
| 0.0 | 0.1 | GO:0051031 | tRNA transport(GO:0051031) |
| 0.0 | 0.4 | GO:0000012 | single strand break repair(GO:0000012) |
| 0.0 | 1.3 | GO:0090162 | establishment of epithelial cell polarity(GO:0090162) |
| 0.0 | 0.1 | GO:0097211 | response to gonadotropin-releasing hormone(GO:0097210) cellular response to gonadotropin-releasing hormone(GO:0097211) |
| 0.0 | 0.1 | GO:0006553 | lysine metabolic process(GO:0006553) |
| 0.0 | 0.3 | GO:0010650 | positive regulation of cell communication by electrical coupling(GO:0010650) positive regulation of membrane depolarization during cardiac muscle cell action potential(GO:1900827) |
| 0.0 | 0.2 | GO:0031145 | anaphase-promoting complex-dependent catabolic process(GO:0031145) |
| 0.0 | 0.3 | GO:1902916 | positive regulation of protein polyubiquitination(GO:1902916) |
| 0.0 | 0.3 | GO:0060736 | prostate gland growth(GO:0060736) |
| 0.0 | 0.2 | GO:0098838 | reduced folate transmembrane transport(GO:0098838) |
| 0.0 | 0.2 | GO:0000447 | endonucleolytic cleavage in ITS1 to separate SSU-rRNA from 5.8S rRNA and LSU-rRNA from tricistronic rRNA transcript (SSU-rRNA, 5.8S rRNA, LSU-rRNA)(GO:0000447) |
| 0.0 | 0.6 | GO:0045653 | negative regulation of megakaryocyte differentiation(GO:0045653) |
| 0.0 | 0.3 | GO:0010447 | response to acidic pH(GO:0010447) |
| 0.0 | 0.1 | GO:0090110 | cargo loading into COPII-coated vesicle(GO:0090110) regulation of cargo loading into COPII-coated vesicle(GO:1901301) |
| 0.0 | 0.4 | GO:0032516 | positive regulation of phosphoprotein phosphatase activity(GO:0032516) |
| 0.0 | 0.2 | GO:0006627 | protein processing involved in protein targeting to mitochondrion(GO:0006627) |
| 0.0 | 0.2 | GO:0006265 | DNA topological change(GO:0006265) |
| 0.0 | 0.1 | GO:1902037 | negative regulation of hematopoietic stem cell differentiation(GO:1902037) |
| 0.0 | 0.2 | GO:1903551 | regulation of extracellular exosome assembly(GO:1903551) |
| 0.0 | 0.3 | GO:0097094 | craniofacial suture morphogenesis(GO:0097094) |
| 0.0 | 1.4 | GO:0045600 | positive regulation of fat cell differentiation(GO:0045600) |
| 0.0 | 0.1 | GO:0006297 | nucleotide-excision repair, DNA gap filling(GO:0006297) |
| 0.0 | 0.2 | GO:0033564 | anterior/posterior axon guidance(GO:0033564) |
| 0.0 | 0.1 | GO:0015808 | L-alanine transport(GO:0015808) |
| 0.0 | 0.1 | GO:0006030 | chitin metabolic process(GO:0006030) chitin catabolic process(GO:0006032) |
| 0.0 | 0.7 | GO:0007416 | synapse assembly(GO:0007416) |
| 0.0 | 0.1 | GO:1904694 | negative regulation of vascular smooth muscle contraction(GO:1904694) |
| 0.0 | 0.2 | GO:1902894 | negative regulation of pri-miRNA transcription from RNA polymerase II promoter(GO:1902894) |
| 0.0 | 0.1 | GO:0034729 | histone H3-K79 methylation(GO:0034729) |
| 0.0 | 0.1 | GO:0010961 | cellular magnesium ion homeostasis(GO:0010961) |
| 0.0 | 1.7 | GO:0031338 | regulation of vesicle fusion(GO:0031338) |
| 0.0 | 0.3 | GO:0018206 | peptidyl-methionine modification(GO:0018206) |
| 0.0 | 0.2 | GO:0031440 | regulation of mRNA 3'-end processing(GO:0031440) |
| 0.0 | 0.4 | GO:0051457 | maintenance of protein location in nucleus(GO:0051457) |
| 0.0 | 0.1 | GO:2000194 | progesterone secretion(GO:0042701) regulation of female gonad development(GO:2000194) |
| 0.0 | 0.5 | GO:0001574 | ganglioside biosynthetic process(GO:0001574) |
| 0.0 | 0.4 | GO:0006607 | NLS-bearing protein import into nucleus(GO:0006607) |
| 0.0 | 0.1 | GO:1904587 | glycoprotein ERAD pathway(GO:0097466) response to glycoprotein(GO:1904587) |
| 0.0 | 0.1 | GO:1904425 | negative regulation of GTP binding(GO:1904425) |
| 0.0 | 0.9 | GO:0042073 | intraciliary transport(GO:0042073) protein transport along microtubule(GO:0098840) |
| 0.0 | 0.3 | GO:0070102 | interleukin-6-mediated signaling pathway(GO:0070102) |
| 0.0 | 0.1 | GO:0097298 | regulation of nucleus size(GO:0097298) |
| 0.0 | 0.2 | GO:1901844 | regulation of cell communication by electrical coupling involved in cardiac conduction(GO:1901844) |
| 0.0 | 1.3 | GO:0043268 | positive regulation of potassium ion transport(GO:0043268) |
| 0.0 | 1.6 | GO:0042475 | odontogenesis of dentin-containing tooth(GO:0042475) |
| 0.0 | 0.0 | GO:0009193 | pyrimidine ribonucleoside diphosphate metabolic process(GO:0009193) UDP metabolic process(GO:0046048) |
| 0.0 | 0.1 | GO:0002098 | tRNA wobble uridine modification(GO:0002098) |
| 0.0 | 0.8 | GO:0034605 | cellular response to heat(GO:0034605) |
| 0.0 | 0.1 | GO:0090666 | scaRNA localization to Cajal body(GO:0090666) |
| 0.0 | 0.1 | GO:0006646 | phosphatidylethanolamine biosynthetic process(GO:0006646) |
| 0.0 | 0.2 | GO:0071378 | growth hormone receptor signaling pathway(GO:0060396) cellular response to growth hormone stimulus(GO:0071378) |
| 0.0 | 0.1 | GO:0006842 | tricarboxylic acid transport(GO:0006842) citrate transport(GO:0015746) |
| 0.0 | 0.1 | GO:0006659 | phosphatidylserine biosynthetic process(GO:0006659) |
| 0.0 | 0.2 | GO:0006488 | dolichol-linked oligosaccharide biosynthetic process(GO:0006488) |
| 0.0 | 0.5 | GO:0046856 | phosphatidylinositol dephosphorylation(GO:0046856) |
| 0.0 | 0.1 | GO:0002756 | MyD88-independent toll-like receptor signaling pathway(GO:0002756) |
| 0.0 | 0.6 | GO:0048662 | negative regulation of smooth muscle cell proliferation(GO:0048662) |
| 0.0 | 0.1 | GO:0071397 | cellular response to cholesterol(GO:0071397) |
| 0.0 | 1.0 | GO:0006367 | transcription initiation from RNA polymerase II promoter(GO:0006367) |
| 0.0 | 0.1 | GO:1903847 | regulation of aorta morphogenesis(GO:1903847) positive regulation of aorta morphogenesis(GO:1903849) |
| 0.0 | 0.2 | GO:0007250 | activation of NF-kappaB-inducing kinase activity(GO:0007250) |
| 0.0 | 0.1 | GO:0090529 | barrier septum assembly(GO:0000917) cell septum assembly(GO:0090529) |
| 0.0 | 0.1 | GO:0060008 | Sertoli cell differentiation(GO:0060008) Sertoli cell development(GO:0060009) |
| 0.0 | 0.4 | GO:0035855 | megakaryocyte development(GO:0035855) |
| 0.0 | 0.1 | GO:0006398 | mRNA 3'-end processing by stem-loop binding and cleavage(GO:0006398) |
| 0.0 | 0.2 | GO:0051085 | chaperone mediated protein folding requiring cofactor(GO:0051085) |
| 0.0 | 0.1 | GO:0033353 | S-adenosylmethionine cycle(GO:0033353) |
| 0.0 | 0.3 | GO:0034063 | stress granule assembly(GO:0034063) |
| 0.0 | 0.1 | GO:0006546 | glycine catabolic process(GO:0006546) glycine decarboxylation via glycine cleavage system(GO:0019464) |
| 0.0 | 0.1 | GO:0034198 | cellular response to amino acid starvation(GO:0034198) |
| 0.0 | 0.4 | GO:0032878 | regulation of establishment or maintenance of cell polarity(GO:0032878) |
| 0.0 | 0.6 | GO:1900449 | regulation of glutamate receptor signaling pathway(GO:1900449) |
| 0.0 | 0.1 | GO:0010792 | DNA double-strand break processing involved in repair via single-strand annealing(GO:0010792) |
| 0.0 | 1.1 | GO:0051260 | protein homooligomerization(GO:0051260) |
| 0.0 | 0.2 | GO:0032366 | intracellular sterol transport(GO:0032366) |
| 0.0 | 0.1 | GO:0090365 | regulation of mRNA modification(GO:0090365) |
| 0.0 | 0.2 | GO:0051131 | chaperone-mediated protein complex assembly(GO:0051131) |
| 0.0 | 0.5 | GO:0043550 | regulation of lipid kinase activity(GO:0043550) |
| 0.0 | 0.0 | GO:0030214 | hyaluronan catabolic process(GO:0030214) |
| 0.0 | 0.4 | GO:0000413 | protein peptidyl-prolyl isomerization(GO:0000413) |
| 0.0 | 0.1 | GO:1900246 | positive regulation of RIG-I signaling pathway(GO:1900246) |
| 0.0 | 0.1 | GO:0061718 | NADH regeneration(GO:0006735) canonical glycolysis(GO:0061621) glycolytic process through glucose-1-phosphate(GO:0061622) glucose catabolic process to pyruvate(GO:0061718) |
| 0.0 | 0.7 | GO:0006487 | protein N-linked glycosylation(GO:0006487) |
| 0.0 | 0.2 | GO:0009081 | branched-chain amino acid metabolic process(GO:0009081) branched-chain amino acid catabolic process(GO:0009083) |
| 0.0 | 0.0 | GO:0032079 | positive regulation of endodeoxyribonuclease activity(GO:0032079) |
| 0.0 | 0.2 | GO:0006465 | signal peptide processing(GO:0006465) |
| 0.0 | 0.5 | GO:0061512 | protein localization to cilium(GO:0061512) |
| 0.0 | 0.1 | GO:0070127 | tRNA aminoacylation for mitochondrial protein translation(GO:0070127) |
| 0.0 | 0.1 | GO:0097576 | vacuole fusion(GO:0097576) |
| 0.0 | 1.7 | GO:0006813 | potassium ion transport(GO:0006813) |
| 0.0 | 0.0 | GO:0019085 | early viral transcription(GO:0019085) |
| 0.0 | 0.3 | GO:0050435 | beta-amyloid metabolic process(GO:0050435) |
| 0.0 | 0.1 | GO:0048703 | embryonic neurocranium morphogenesis(GO:0048702) embryonic viscerocranium morphogenesis(GO:0048703) |
| 0.0 | 0.1 | GO:0018095 | protein polyglutamylation(GO:0018095) |
| 0.0 | 1.4 | GO:0030705 | cytoskeleton-dependent intracellular transport(GO:0030705) |
| 0.0 | 0.0 | GO:0035928 | RNA import into mitochondrion(GO:0035927) rRNA import into mitochondrion(GO:0035928) |
| 0.0 | 0.0 | GO:0048239 | negative regulation of DNA recombination at telomere(GO:0048239) regulation of DNA recombination at telomere(GO:0072695) |
| 0.0 | 0.1 | GO:0060632 | regulation of microtubule-based movement(GO:0060632) |
| 0.0 | 0.2 | GO:2000117 | negative regulation of cysteine-type endopeptidase activity(GO:2000117) |
| 0.0 | 0.1 | GO:0045793 | positive regulation of cell size(GO:0045793) |
| 0.0 | 1.9 | GO:0042787 | protein ubiquitination involved in ubiquitin-dependent protein catabolic process(GO:0042787) |
| 0.0 | 0.2 | GO:0009268 | response to pH(GO:0009268) |
| 0.0 | 0.0 | GO:0010808 | positive regulation of synaptic vesicle priming(GO:0010808) positive regulation of synaptic vesicle exocytosis(GO:2000302) |
| 0.0 | 0.0 | GO:0017183 | peptidyl-diphthamide metabolic process(GO:0017182) peptidyl-diphthamide biosynthetic process from peptidyl-histidine(GO:0017183) |
| 0.0 | 0.3 | GO:0032007 | negative regulation of TOR signaling(GO:0032007) |
| 0.0 | 0.1 | GO:0070131 | positive regulation of mitochondrial translation(GO:0070131) |
| 0.0 | 0.0 | GO:1902035 | positive regulation of hematopoietic stem cell proliferation(GO:1902035) |
| 0.0 | 0.1 | GO:0071480 | cellular response to gamma radiation(GO:0071480) |
| 0.0 | 0.3 | GO:0070979 | protein K11-linked ubiquitination(GO:0070979) |
| 0.0 | 0.0 | GO:2000774 | positive regulation of cellular senescence(GO:2000774) |
| 0.0 | 0.1 | GO:0034723 | DNA replication-dependent nucleosome assembly(GO:0006335) DNA replication-dependent nucleosome organization(GO:0034723) |
| 0.0 | 0.1 | GO:0007175 | negative regulation of epidermal growth factor-activated receptor activity(GO:0007175) |
| 0.0 | 1.0 | GO:0030518 | intracellular steroid hormone receptor signaling pathway(GO:0030518) |
| 0.0 | 0.1 | GO:0007625 | grooming behavior(GO:0007625) |
| 0.0 | 0.0 | GO:1900365 | positive regulation of mRNA polyadenylation(GO:1900365) |
| 0.0 | 0.1 | GO:0030091 | protein repair(GO:0030091) |
Gene overrepresentation in cellular_component category:
| Log-likelihood per target | Total log-likelihood | Term | Description |
|---|---|---|---|
| 1.2 | 3.5 | GO:0031088 | platelet dense granule membrane(GO:0031088) |
| 0.3 | 0.8 | GO:0030905 | retromer, tubulation complex(GO:0030905) |
| 0.3 | 0.8 | GO:0002142 | stereocilia ankle link complex(GO:0002142) |
| 0.3 | 0.8 | GO:0097543 | ciliary inversin compartment(GO:0097543) |
| 0.2 | 5.1 | GO:0005697 | telomerase holoenzyme complex(GO:0005697) |
| 0.2 | 0.7 | GO:0055087 | Ski complex(GO:0055087) |
| 0.2 | 1.1 | GO:0061689 | tricellular tight junction(GO:0061689) |
| 0.2 | 0.8 | GO:0097361 | CIA complex(GO:0097361) |
| 0.2 | 1.5 | GO:0071012 | catalytic step 1 spliceosome(GO:0071012) |
| 0.2 | 0.8 | GO:0032777 | Piccolo NuA4 histone acetyltransferase complex(GO:0032777) |
| 0.1 | 1.5 | GO:0071439 | clathrin complex(GO:0071439) |
| 0.1 | 0.7 | GO:0044611 | nuclear pore inner ring(GO:0044611) |
| 0.1 | 0.7 | GO:0044316 | cone cell pedicle(GO:0044316) |
| 0.1 | 1.2 | GO:0061617 | MICOS complex(GO:0061617) |
| 0.1 | 0.4 | GO:0000172 | ribonuclease MRP complex(GO:0000172) |
| 0.1 | 0.6 | GO:0000214 | tRNA-intron endonuclease complex(GO:0000214) |
| 0.1 | 0.6 | GO:0000444 | MIS12/MIND type complex(GO:0000444) |
| 0.1 | 0.7 | GO:0001940 | male pronucleus(GO:0001940) |
| 0.1 | 6.2 | GO:0031463 | Cul3-RING ubiquitin ligase complex(GO:0031463) |
| 0.1 | 1.1 | GO:0034464 | BBSome(GO:0034464) |
| 0.1 | 0.7 | GO:0033256 | I-kappaB/NF-kappaB complex(GO:0033256) |
| 0.1 | 1.0 | GO:0032584 | growth cone membrane(GO:0032584) |
| 0.1 | 0.4 | GO:0036449 | microtubule minus-end(GO:0036449) |
| 0.1 | 0.4 | GO:0009331 | glycerol-3-phosphate dehydrogenase complex(GO:0009331) |
| 0.1 | 1.1 | GO:0071203 | WASH complex(GO:0071203) |
| 0.1 | 2.5 | GO:0031672 | A band(GO:0031672) |
| 0.1 | 0.9 | GO:0017119 | Golgi transport complex(GO:0017119) |
| 0.1 | 0.2 | GO:0018444 | translation release factor complex(GO:0018444) |
| 0.1 | 0.6 | GO:0005642 | annulate lamellae(GO:0005642) |
| 0.1 | 0.5 | GO:0000347 | THO complex(GO:0000347) THO complex part of transcription export complex(GO:0000445) |
| 0.1 | 0.2 | GO:0016012 | sarcoglycan complex(GO:0016012) |
| 0.1 | 0.2 | GO:0043259 | laminin-1 complex(GO:0005606) laminin-10 complex(GO:0043259) |
| 0.1 | 0.3 | GO:0035867 | alphav-beta3 integrin-IGF-1-IGF1R complex(GO:0035867) |
| 0.1 | 1.5 | GO:0080008 | Cul4-RING E3 ubiquitin ligase complex(GO:0080008) |
| 0.1 | 0.7 | GO:0036513 | Derlin-1 retrotranslocation complex(GO:0036513) |
| 0.1 | 1.8 | GO:0000407 | pre-autophagosomal structure(GO:0000407) |
| 0.0 | 1.3 | GO:0033270 | paranode region of axon(GO:0033270) |
| 0.0 | 0.6 | GO:0097542 | ciliary tip(GO:0097542) |
| 0.0 | 1.5 | GO:0035869 | ciliary transition zone(GO:0035869) |
| 0.0 | 0.2 | GO:0005947 | mitochondrial alpha-ketoglutarate dehydrogenase complex(GO:0005947) |
| 0.0 | 0.2 | GO:0032541 | cortical endoplasmic reticulum(GO:0032541) |
| 0.0 | 0.2 | GO:0030870 | Mre11 complex(GO:0030870) |
| 0.0 | 0.2 | GO:0070044 | synaptobrevin 2-SNAP-25-syntaxin-1a complex(GO:0070044) |
| 0.0 | 0.2 | GO:0033185 | dolichol-phosphate-mannose synthase complex(GO:0033185) |
| 0.0 | 0.1 | GO:0005673 | transcription factor TFIIE complex(GO:0005673) |
| 0.0 | 0.4 | GO:0000145 | exocyst(GO:0000145) |
| 0.0 | 0.4 | GO:0042622 | photoreceptor outer segment membrane(GO:0042622) |
| 0.0 | 1.2 | GO:0030665 | clathrin-coated vesicle membrane(GO:0030665) |
| 0.0 | 0.3 | GO:0031512 | motile primary cilium(GO:0031512) |
| 0.0 | 1.4 | GO:0097610 | cleavage furrow(GO:0032154) cell surface furrow(GO:0097610) |
| 0.0 | 0.4 | GO:0043220 | Schmidt-Lanterman incisure(GO:0043220) |
| 0.0 | 0.7 | GO:0030992 | intraciliary transport particle B(GO:0030992) |
| 0.0 | 0.2 | GO:0032389 | MutLalpha complex(GO:0032389) |
| 0.0 | 0.2 | GO:0032982 | myosin filament(GO:0032982) |
| 0.0 | 0.1 | GO:0071001 | U4/U6 snRNP(GO:0071001) |
| 0.0 | 1.6 | GO:0030173 | integral component of Golgi membrane(GO:0030173) |
| 0.0 | 0.1 | GO:0002177 | manchette(GO:0002177) |
| 0.0 | 0.2 | GO:0051286 | cell tip(GO:0051286) |
| 0.0 | 0.3 | GO:0071598 | neuronal ribonucleoprotein granule(GO:0071598) |
| 0.0 | 0.6 | GO:0042470 | melanosome(GO:0042470) pigment granule(GO:0048770) |
| 0.0 | 0.4 | GO:0005736 | DNA-directed RNA polymerase I complex(GO:0005736) |
| 0.0 | 1.3 | GO:0005788 | endoplasmic reticulum lumen(GO:0005788) |
| 0.0 | 0.1 | GO:1990745 | EARP complex(GO:1990745) |
| 0.0 | 0.2 | GO:0031315 | extrinsic component of mitochondrial outer membrane(GO:0031315) |
| 0.0 | 0.1 | GO:1903095 | microprocessor complex(GO:0070877) ribonuclease III complex(GO:1903095) |
| 0.0 | 0.1 | GO:0005744 | mitochondrial inner membrane presequence translocase complex(GO:0005744) |
| 0.0 | 0.2 | GO:0032045 | guanyl-nucleotide exchange factor complex(GO:0032045) |
| 0.0 | 0.3 | GO:0044447 | axoneme part(GO:0044447) |
| 0.0 | 0.1 | GO:0048787 | presynaptic active zone membrane(GO:0048787) |
| 0.0 | 0.1 | GO:0005945 | 6-phosphofructokinase complex(GO:0005945) |
| 0.0 | 0.3 | GO:0097539 | ciliary transition fiber(GO:0097539) |
| 0.0 | 2.1 | GO:0030175 | filopodium(GO:0030175) |
| 0.0 | 0.5 | GO:0005865 | striated muscle thin filament(GO:0005865) myofilament(GO:0036379) |
| 0.0 | 0.1 | GO:0030127 | COPII vesicle coat(GO:0030127) |
| 0.0 | 0.3 | GO:0005771 | multivesicular body(GO:0005771) |
| 0.0 | 0.3 | GO:0005793 | endoplasmic reticulum-Golgi intermediate compartment(GO:0005793) |
| 0.0 | 0.4 | GO:0030014 | CCR4-NOT complex(GO:0030014) |
| 0.0 | 0.4 | GO:0031307 | integral component of mitochondrial outer membrane(GO:0031307) |
| 0.0 | 0.1 | GO:0071782 | endoplasmic reticulum tubular network(GO:0071782) |
| 0.0 | 0.2 | GO:0030478 | actin cap(GO:0030478) |
| 0.0 | 0.8 | GO:0042645 | nucleoid(GO:0009295) mitochondrial nucleoid(GO:0042645) |
| 0.0 | 0.0 | GO:0031306 | intrinsic component of mitochondrial outer membrane(GO:0031306) |
| 0.0 | 0.1 | GO:0070876 | SOSS complex(GO:0070876) |
| 0.0 | 0.3 | GO:0034451 | centriolar satellite(GO:0034451) |
| 0.0 | 0.1 | GO:0031428 | box C/D snoRNP complex(GO:0031428) |
| 0.0 | 0.1 | GO:0036056 | filtration diaphragm(GO:0036056) slit diaphragm(GO:0036057) |
| 0.0 | 0.1 | GO:0048476 | Holliday junction resolvase complex(GO:0048476) |
| 0.0 | 0.3 | GO:0005669 | transcription factor TFIID complex(GO:0005669) |
| 0.0 | 0.7 | GO:0005776 | autophagosome(GO:0005776) |
| 0.0 | 0.4 | GO:0070822 | Sin3-type complex(GO:0070822) |
| 0.0 | 0.2 | GO:0061700 | GATOR2 complex(GO:0061700) |
| 0.0 | 0.4 | GO:0005689 | U12-type spliceosomal complex(GO:0005689) |
| 0.0 | 1.1 | GO:0005795 | Golgi stack(GO:0005795) |
| 0.0 | 0.4 | GO:0015030 | Cajal body(GO:0015030) |
| 0.0 | 0.1 | GO:0030057 | desmosome(GO:0030057) |
| 0.0 | 0.1 | GO:0031523 | Myb complex(GO:0031523) |
| 0.0 | 0.2 | GO:0031305 | integral component of mitochondrial inner membrane(GO:0031305) |
| 0.0 | 0.1 | GO:0033263 | CORVET complex(GO:0033263) |
| 0.0 | 0.1 | GO:0035985 | senescence-associated heterochromatin focus(GO:0035985) |
| 0.0 | 2.9 | GO:0016323 | basolateral plasma membrane(GO:0016323) |
| 0.0 | 0.1 | GO:0042382 | paraspeckles(GO:0042382) |
| 0.0 | 0.5 | GO:0016592 | mediator complex(GO:0016592) |
| 0.0 | 0.1 | GO:0044322 | endoplasmic reticulum quality control compartment(GO:0044322) |
| 0.0 | 0.1 | GO:0005971 | ribonucleoside-diphosphate reductase complex(GO:0005971) |
| 0.0 | 0.0 | GO:0005787 | signal peptidase complex(GO:0005787) |
| 0.0 | 0.1 | GO:0031080 | nuclear pore outer ring(GO:0031080) |
| 0.0 | 0.4 | GO:0044295 | axonal growth cone(GO:0044295) |
Gene overrepresentation in molecular_function category:
| Log-likelihood per target | Total log-likelihood | Term | Description |
|---|---|---|---|
| 1.2 | 3.5 | GO:0005220 | inositol 1,4,5-trisphosphate-sensitive calcium-release channel activity(GO:0005220) |
| 0.6 | 2.9 | GO:0005166 | neurotrophin p75 receptor binding(GO:0005166) |
| 0.5 | 2.0 | GO:0016286 | small conductance calcium-activated potassium channel activity(GO:0016286) |
| 0.5 | 5.0 | GO:0003691 | double-stranded telomeric DNA binding(GO:0003691) |
| 0.3 | 2.2 | GO:0031419 | cobalamin binding(GO:0031419) |
| 0.3 | 1.4 | GO:0000403 | Y-form DNA binding(GO:0000403) |
| 0.3 | 1.3 | GO:0004594 | pantothenate kinase activity(GO:0004594) |
| 0.2 | 0.8 | GO:1990460 | leptin receptor binding(GO:1990460) |
| 0.2 | 3.9 | GO:0008242 | omega peptidase activity(GO:0008242) |
| 0.2 | 0.6 | GO:0035175 | histone kinase activity (H3-S10 specific)(GO:0035175) |
| 0.2 | 0.6 | GO:0052658 | inositol-1,4,5-trisphosphate 5-phosphatase activity(GO:0052658) |
| 0.2 | 1.1 | GO:0046912 | transferase activity, transferring acyl groups, acyl groups converted into alkyl on transfer(GO:0046912) |
| 0.2 | 0.5 | GO:0071862 | protein phosphatase type 1 activator activity(GO:0071862) |
| 0.2 | 1.4 | GO:0015165 | pyrimidine nucleotide-sugar transmembrane transporter activity(GO:0015165) |
| 0.2 | 0.2 | GO:0004583 | dolichyl-phosphate-glucose-glycolipid alpha-glucosyltransferase activity(GO:0004583) |
| 0.2 | 0.2 | GO:0004611 | phosphoenolpyruvate carboxykinase activity(GO:0004611) |
| 0.1 | 0.6 | GO:0004337 | geranyltranstransferase activity(GO:0004337) |
| 0.1 | 0.6 | GO:0035514 | DNA demethylase activity(GO:0035514) oxidative RNA demethylase activity(GO:0035515) |
| 0.1 | 0.6 | GO:0000386 | second spliceosomal transesterification activity(GO:0000386) |
| 0.1 | 2.9 | GO:0005452 | inorganic anion exchanger activity(GO:0005452) |
| 0.1 | 0.7 | GO:0030144 | alpha-1,6-mannosylglycoprotein 6-beta-N-acetylglucosaminyltransferase activity(GO:0030144) |
| 0.1 | 0.7 | GO:0097001 | sphingolipid transporter activity(GO:0046624) ceramide binding(GO:0097001) |
| 0.1 | 0.4 | GO:0000171 | ribonuclease MRP activity(GO:0000171) |
| 0.1 | 1.3 | GO:0008568 | microtubule-severing ATPase activity(GO:0008568) |
| 0.1 | 1.1 | GO:0005007 | fibroblast growth factor-activated receptor activity(GO:0005007) |
| 0.1 | 0.2 | GO:0070180 | large ribosomal subunit rRNA binding(GO:0070180) |
| 0.1 | 0.6 | GO:0046404 | ATP-dependent polydeoxyribonucleotide 5'-hydroxyl-kinase activity(GO:0046404) polydeoxyribonucleotide kinase activity(GO:0051733) |
| 0.1 | 1.4 | GO:1904264 | ubiquitin protein ligase activity involved in ERAD pathway(GO:1904264) |
| 0.1 | 1.4 | GO:0034211 | GTP-dependent protein kinase activity(GO:0034211) |
| 0.1 | 0.4 | GO:0008061 | chitin binding(GO:0008061) |
| 0.1 | 0.6 | GO:0015379 | potassium:chloride symporter activity(GO:0015379) potassium ion symporter activity(GO:0022820) |
| 0.1 | 0.3 | GO:0045504 | dynein heavy chain binding(GO:0045504) |
| 0.1 | 0.4 | GO:0097003 | adipokinetic hormone receptor activity(GO:0097003) |
| 0.1 | 0.9 | GO:0003847 | 1-alkyl-2-acetylglycerophosphocholine esterase activity(GO:0003847) |
| 0.1 | 0.3 | GO:0035575 | histone demethylase activity (H4-K20 specific)(GO:0035575) |
| 0.1 | 0.6 | GO:0017099 | very-long-chain-acyl-CoA dehydrogenase activity(GO:0017099) |
| 0.1 | 1.0 | GO:0016861 | intramolecular oxidoreductase activity, interconverting aldoses and ketoses(GO:0016861) |
| 0.1 | 0.8 | GO:0019870 | potassium channel inhibitor activity(GO:0019870) |
| 0.1 | 0.3 | GO:0034513 | box H/ACA snoRNA binding(GO:0034513) |
| 0.1 | 0.6 | GO:0061665 | SUMO ligase activity(GO:0061665) |
| 0.1 | 0.4 | GO:0004367 | glycerol-3-phosphate dehydrogenase [NAD+] activity(GO:0004367) |
| 0.1 | 0.9 | GO:1990226 | histone methyltransferase binding(GO:1990226) |
| 0.1 | 0.7 | GO:0004571 | mannosyl-oligosaccharide 1,2-alpha-mannosidase activity(GO:0004571) |
| 0.1 | 0.3 | GO:0005008 | hepatocyte growth factor-activated receptor activity(GO:0005008) |
| 0.1 | 3.9 | GO:0051019 | mitogen-activated protein kinase binding(GO:0051019) |
| 0.1 | 0.1 | GO:0070878 | primary miRNA binding(GO:0070878) |
| 0.1 | 0.6 | GO:0043495 | protein anchor(GO:0043495) |
| 0.1 | 0.5 | GO:0008479 | queuine tRNA-ribosyltransferase activity(GO:0008479) |
| 0.1 | 2.0 | GO:0070016 | armadillo repeat domain binding(GO:0070016) |
| 0.1 | 0.6 | GO:0097157 | pre-mRNA intronic binding(GO:0097157) |
| 0.1 | 1.0 | GO:0035612 | AP-2 adaptor complex binding(GO:0035612) |
| 0.1 | 1.2 | GO:0050811 | GABA receptor binding(GO:0050811) |
| 0.1 | 1.5 | GO:0004697 | protein kinase C activity(GO:0004697) |
| 0.1 | 0.3 | GO:0016508 | long-chain-enoyl-CoA hydratase activity(GO:0016508) |
| 0.1 | 0.2 | GO:0001851 | complement component C3b binding(GO:0001851) proteinase activated receptor binding(GO:0031871) |
| 0.1 | 0.2 | GO:0035184 | histone threonine kinase activity(GO:0035184) |
| 0.1 | 1.5 | GO:0017160 | Ral GTPase binding(GO:0017160) |
| 0.1 | 0.4 | GO:0070699 | type II activin receptor binding(GO:0070699) |
| 0.1 | 0.5 | GO:0098632 | protein binding involved in cell-cell adhesion(GO:0098632) |
| 0.1 | 2.5 | GO:0000978 | RNA polymerase II core promoter proximal region sequence-specific DNA binding(GO:0000978) |
| 0.1 | 0.4 | GO:0052650 | NADP-retinol dehydrogenase activity(GO:0052650) |
| 0.1 | 0.5 | GO:0003836 | beta-galactoside (CMP) alpha-2,3-sialyltransferase activity(GO:0003836) |
| 0.1 | 0.4 | GO:0004301 | epoxide hydrolase activity(GO:0004301) |
| 0.1 | 0.7 | GO:0005522 | profilin binding(GO:0005522) |
| 0.1 | 0.5 | GO:0005523 | tropomyosin binding(GO:0005523) |
| 0.1 | 0.3 | GO:0032767 | copper-dependent protein binding(GO:0032767) |
| 0.1 | 0.7 | GO:0008157 | protein phosphatase 1 binding(GO:0008157) |
| 0.1 | 2.2 | GO:0032266 | phosphatidylinositol-3-phosphate binding(GO:0032266) |
| 0.1 | 0.5 | GO:0016634 | structural constituent of eye lens(GO:0005212) oxidoreductase activity, acting on the CH-CH group of donors, oxygen as acceptor(GO:0016634) |
| 0.1 | 0.3 | GO:0046976 | histone methyltransferase activity (H3-K27 specific)(GO:0046976) |
| 0.1 | 0.2 | GO:0005483 | soluble NSF attachment protein activity(GO:0005483) |
| 0.0 | 0.1 | GO:0004529 | exodeoxyribonuclease activity(GO:0004529) single-stranded DNA exodeoxyribonuclease activity(GO:0008297) exodeoxyribonuclease activity, producing 5'-phosphomonoesters(GO:0016895) |
| 0.0 | 0.8 | GO:1990841 | promoter-specific chromatin binding(GO:1990841) |
| 0.0 | 0.2 | GO:0016149 | translation release factor activity, codon specific(GO:0016149) |
| 0.0 | 1.1 | GO:0008483 | transaminase activity(GO:0008483) |
| 0.0 | 0.2 | GO:0015467 | G-protein activated inward rectifier potassium channel activity(GO:0015467) |
| 0.0 | 1.0 | GO:0035326 | enhancer binding(GO:0035326) |
| 0.0 | 0.1 | GO:0015173 | aromatic amino acid transmembrane transporter activity(GO:0015173) |
| 0.0 | 0.2 | GO:0003917 | DNA topoisomerase type I activity(GO:0003917) |
| 0.0 | 0.5 | GO:0015299 | solute:proton antiporter activity(GO:0015299) |
| 0.0 | 0.2 | GO:0004849 | uridine kinase activity(GO:0004849) |
| 0.0 | 0.3 | GO:0000182 | rDNA binding(GO:0000182) |
| 0.0 | 0.3 | GO:0004652 | polynucleotide adenylyltransferase activity(GO:0004652) |
| 0.0 | 0.2 | GO:0030911 | TPR domain binding(GO:0030911) |
| 0.0 | 0.2 | GO:0000099 | sulfur amino acid transmembrane transporter activity(GO:0000099) |
| 0.0 | 0.3 | GO:0051959 | dynein light intermediate chain binding(GO:0051959) |
| 0.0 | 0.2 | GO:0043208 | glycosphingolipid binding(GO:0043208) |
| 0.0 | 0.7 | GO:0017056 | structural constituent of nuclear pore(GO:0017056) |
| 0.0 | 0.4 | GO:0031386 | protein tag(GO:0031386) |
| 0.0 | 0.2 | GO:0005042 | netrin receptor activity(GO:0005042) |
| 0.0 | 0.3 | GO:0018741 | alkyl sulfatase activity(GO:0018741) endosulfan hemisulfate sulfatase activity(GO:0034889) endosulfan sulfate hydrolase activity(GO:0034902) |
| 0.0 | 0.8 | GO:0031489 | myosin V binding(GO:0031489) |
| 0.0 | 0.2 | GO:0003747 | translation release factor activity(GO:0003747) translation termination factor activity(GO:0008079) |
| 0.0 | 0.3 | GO:0043559 | insulin binding(GO:0043559) |
| 0.0 | 0.6 | GO:0003906 | DNA-(apurinic or apyrimidinic site) lyase activity(GO:0003906) |
| 0.0 | 0.2 | GO:0018121 | imidazoleglycerol-phosphate synthase activity(GO:0000107) NAD(P)-cysteine ADP-ribosyltransferase activity(GO:0018071) NAD(P)-asparagine ADP-ribosyltransferase activity(GO:0018121) NAD(P)-serine ADP-ribosyltransferase activity(GO:0018127) 7-cyano-7-deazaguanine tRNA-ribosyltransferase activity(GO:0043867) purine deoxyribosyltransferase activity(GO:0044102) |
| 0.0 | 0.2 | GO:0008269 | JAK pathway signal transduction adaptor activity(GO:0008269) |
| 0.0 | 0.5 | GO:0044183 | protein binding involved in protein folding(GO:0044183) |
| 0.0 | 0.3 | GO:0045236 | CXCR chemokine receptor binding(GO:0045236) |
| 0.0 | 0.2 | GO:0004582 | dolichyl-phosphate beta-D-mannosyltransferase activity(GO:0004582) |
| 0.0 | 2.6 | GO:0019208 | phosphatase regulator activity(GO:0019208) |
| 0.0 | 0.2 | GO:0008518 | reduced folate carrier activity(GO:0008518) |
| 0.0 | 0.2 | GO:0048531 | beta-1,3-galactosyltransferase activity(GO:0048531) |
| 0.0 | 0.1 | GO:0004382 | guanosine-diphosphatase activity(GO:0004382) |
| 0.0 | 0.1 | GO:0034190 | apolipoprotein receptor binding(GO:0034190) |
| 0.0 | 0.1 | GO:0004307 | ethanolaminephosphotransferase activity(GO:0004307) |
| 0.0 | 0.1 | GO:0004839 | ubiquitin activating enzyme activity(GO:0004839) |
| 0.0 | 0.2 | GO:0032794 | GTPase activating protein binding(GO:0032794) |
| 0.0 | 0.4 | GO:0004708 | MAP kinase kinase activity(GO:0004708) |
| 0.0 | 0.5 | GO:0018024 | histone-lysine N-methyltransferase activity(GO:0018024) |
| 0.0 | 0.4 | GO:0001054 | RNA polymerase I activity(GO:0001054) |
| 0.0 | 0.3 | GO:0030296 | protein tyrosine kinase activator activity(GO:0030296) |
| 0.0 | 0.1 | GO:0070181 | small ribosomal subunit rRNA binding(GO:0070181) |
| 0.0 | 0.5 | GO:0070577 | lysine-acetylated histone binding(GO:0070577) |
| 0.0 | 0.8 | GO:0000175 | 3'-5'-exoribonuclease activity(GO:0000175) exoribonuclease activity, producing 5'-phosphomonoesters(GO:0016896) |
| 0.0 | 0.3 | GO:0016755 | transferase activity, transferring amino-acyl groups(GO:0016755) |
| 0.0 | 0.7 | GO:0051059 | NF-kappaB binding(GO:0051059) |
| 0.0 | 0.6 | GO:0033558 | protein deacetylase activity(GO:0033558) |
| 0.0 | 0.7 | GO:0008139 | nuclear localization sequence binding(GO:0008139) |
| 0.0 | 1.5 | GO:0001104 | RNA polymerase II transcription cofactor activity(GO:0001104) |
| 0.0 | 0.2 | GO:0080025 | phosphatidylinositol-3,5-bisphosphate binding(GO:0080025) |
| 0.0 | 30.4 | GO:0003700 | nucleic acid binding transcription factor activity(GO:0001071) transcription factor activity, sequence-specific DNA binding(GO:0003700) |
| 0.0 | 0.1 | GO:0015186 | L-asparagine transmembrane transporter activity(GO:0015182) L-glutamine transmembrane transporter activity(GO:0015186) |
| 0.0 | 0.5 | GO:0071889 | 14-3-3 protein binding(GO:0071889) |
| 0.0 | 0.7 | GO:0043014 | alpha-tubulin binding(GO:0043014) |
| 0.0 | 0.3 | GO:0016701 | oxidoreductase activity, acting on single donors with incorporation of molecular oxygen(GO:0016701) oxidoreductase activity, acting on single donors with incorporation of molecular oxygen, incorporation of two atoms of oxygen(GO:0016702) |
| 0.0 | 0.1 | GO:0016647 | oxidoreductase activity, acting on the CH-NH group of donors, oxygen as acceptor(GO:0016647) |
| 0.0 | 0.2 | GO:0005095 | GTPase inhibitor activity(GO:0005095) |
| 0.0 | 0.1 | GO:0003872 | 6-phosphofructokinase activity(GO:0003872) |
| 0.0 | 0.1 | GO:0005049 | nuclear export signal receptor activity(GO:0005049) |
| 0.0 | 0.2 | GO:0030544 | Hsp70 protein binding(GO:0030544) |
| 0.0 | 0.1 | GO:0015142 | citrate transmembrane transporter activity(GO:0015137) tricarboxylic acid transmembrane transporter activity(GO:0015142) |
| 0.0 | 0.3 | GO:0004190 | aspartic-type endopeptidase activity(GO:0004190) aspartic-type peptidase activity(GO:0070001) |
| 0.0 | 1.4 | GO:0004197 | cysteine-type endopeptidase activity(GO:0004197) |
| 0.0 | 3.0 | GO:0017137 | Rab GTPase binding(GO:0017137) |
| 0.0 | 0.1 | GO:0000340 | RNA 7-methylguanosine cap binding(GO:0000340) |
| 0.0 | 0.1 | GO:0032453 | histone demethylase activity (H3-K4 specific)(GO:0032453) |
| 0.0 | 0.2 | GO:0001103 | RNA polymerase II repressing transcription factor binding(GO:0001103) |
| 0.0 | 0.1 | GO:0036033 | mediator complex binding(GO:0036033) |
| 0.0 | 0.2 | GO:0042975 | peroxisome proliferator activated receptor binding(GO:0042975) |
| 0.0 | 0.1 | GO:0019961 | interferon binding(GO:0019961) |
| 0.0 | 1.1 | GO:0008417 | fucosyltransferase activity(GO:0008417) |
| 0.0 | 0.1 | GO:0005138 | interleukin-6 receptor binding(GO:0005138) |
| 0.0 | 0.1 | GO:0004013 | adenosylhomocysteinase activity(GO:0004013) trialkylsulfonium hydrolase activity(GO:0016802) |
| 0.0 | 0.0 | GO:0001565 | phorbol ester receptor activity(GO:0001565) non-kinase phorbol ester receptor activity(GO:0001566) |
| 0.0 | 0.1 | GO:0030976 | thiamine pyrophosphate binding(GO:0030976) |
| 0.0 | 0.1 | GO:0016615 | malate dehydrogenase activity(GO:0016615) |
| 0.0 | 0.0 | GO:0004415 | hyalurononglucosaminidase activity(GO:0004415) |
| 0.0 | 0.1 | GO:0030621 | U4 snRNA binding(GO:0030621) |
| 0.0 | 0.5 | GO:0004712 | protein serine/threonine/tyrosine kinase activity(GO:0004712) |
| 0.0 | 0.2 | GO:0046527 | glucosyltransferase activity(GO:0046527) |
| 0.0 | 0.3 | GO:0035380 | C-3 sterol dehydrogenase (C-4 sterol decarboxylase) activity(GO:0000252) mevaldate reductase activity(GO:0004495) gluconate dehydrogenase activity(GO:0008875) epoxide dehydrogenase activity(GO:0018451) 5-exo-hydroxycamphor dehydrogenase activity(GO:0018452) 2-hydroxytetrahydrofuran dehydrogenase activity(GO:0018453) acetoin dehydrogenase activity(GO:0019152) phenylcoumaran benzylic ether reductase activity(GO:0032442) D-xylose:NADP reductase activity(GO:0032866) L-arabinose:NADP reductase activity(GO:0032867) D-arabinitol dehydrogenase, D-ribulose forming (NADP+) activity(GO:0033709) (R)-(-)-1,2,3,4-tetrahydronaphthol dehydrogenase activity(GO:0034831) 3-hydroxymenthone dehydrogenase activity(GO:0034840) very long-chain-3-hydroxyacyl-CoA dehydrogenase activity(GO:0035380) dihydrotestosterone 17-beta-dehydrogenase activity(GO:0035410) (R)-2-hydroxyisocaproate dehydrogenase activity(GO:0043713) L-arabinose 1-dehydrogenase (NADP+) activity(GO:0044103) L-xylulose reductase (NAD+) activity(GO:0044105) 3-ketoglucose-reductase activity(GO:0048258) D-arabinitol dehydrogenase, D-xylulose forming (NADP+) activity(GO:0052677) |
| 0.0 | 0.2 | GO:0019215 | intermediate filament binding(GO:0019215) |
| 0.0 | 0.3 | GO:0097602 | cullin family protein binding(GO:0097602) |
| 0.0 | 0.1 | GO:0030942 | endoplasmic reticulum signal peptide binding(GO:0030942) |
| 0.0 | 0.1 | GO:0008865 | fructokinase activity(GO:0008865) mannokinase activity(GO:0019158) |
| 0.0 | 0.1 | GO:0008821 | crossover junction endodeoxyribonuclease activity(GO:0008821) |
| 0.0 | 0.3 | GO:0001671 | ATPase activator activity(GO:0001671) |
| 0.0 | 0.1 | GO:0070191 | methionine-R-sulfoxide reductase activity(GO:0070191) |
| 0.0 | 0.1 | GO:1990247 | N6-methyladenosine-containing RNA binding(GO:1990247) |
| 0.0 | 0.1 | GO:0005225 | volume-sensitive anion channel activity(GO:0005225) |
| 0.0 | 0.3 | GO:0008093 | cytoskeletal adaptor activity(GO:0008093) |
| 0.0 | 0.1 | GO:0004305 | ethanolamine kinase activity(GO:0004305) |
| 0.0 | 0.1 | GO:0070034 | telomerase RNA binding(GO:0070034) |
| 0.0 | 0.1 | GO:0005087 | Ran guanyl-nucleotide exchange factor activity(GO:0005087) |
| 0.0 | 0.1 | GO:0017169 | CDP-alcohol phosphatidyltransferase activity(GO:0017169) |
| 0.0 | 0.2 | GO:0008191 | metalloendopeptidase inhibitor activity(GO:0008191) |
| 0.0 | 0.0 | GO:0031752 | D5 dopamine receptor binding(GO:0031752) |
| 0.0 | 0.1 | GO:0000268 | peroxisome targeting sequence binding(GO:0000268) |
| 0.0 | 0.1 | GO:0004792 | thiosulfate sulfurtransferase activity(GO:0004792) |
| 0.0 | 0.1 | GO:0061731 | ribonucleoside-diphosphate reductase activity, thioredoxin disulfide as acceptor(GO:0004748) oxidoreductase activity, acting on CH or CH2 groups, disulfide as acceptor(GO:0016728) ribonucleoside-diphosphate reductase activity(GO:0061731) |
| 0.0 | 0.2 | GO:0042162 | telomeric DNA binding(GO:0042162) |
| 0.0 | 0.2 | GO:0031404 | chloride ion binding(GO:0031404) |
| 0.0 | 0.1 | GO:0070628 | proteasome binding(GO:0070628) |
| 0.0 | 0.2 | GO:0030955 | potassium ion binding(GO:0030955) |
| 0.0 | 0.1 | GO:0016004 | phospholipase activator activity(GO:0016004) lipase activator activity(GO:0060229) |
| 0.0 | 0.8 | GO:0101005 | thiol-dependent ubiquitinyl hydrolase activity(GO:0036459) ubiquitinyl hydrolase activity(GO:0101005) |
| 0.0 | 0.1 | GO:0000064 | L-ornithine transmembrane transporter activity(GO:0000064) |
| 0.0 | 0.1 | GO:0005159 | insulin-like growth factor receptor binding(GO:0005159) |
| 0.0 | 0.2 | GO:0017112 | Rab guanyl-nucleotide exchange factor activity(GO:0017112) |
|
|
|
|