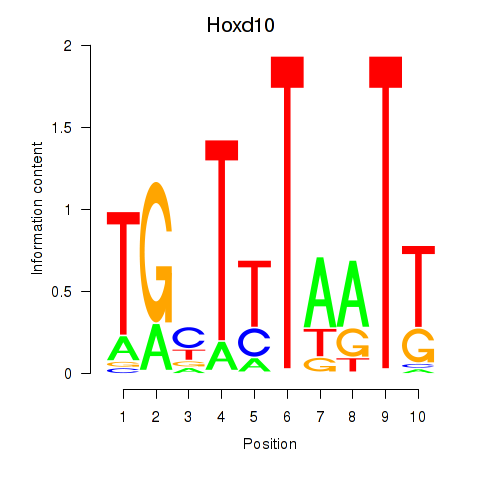
Motif ID: Hoxd10
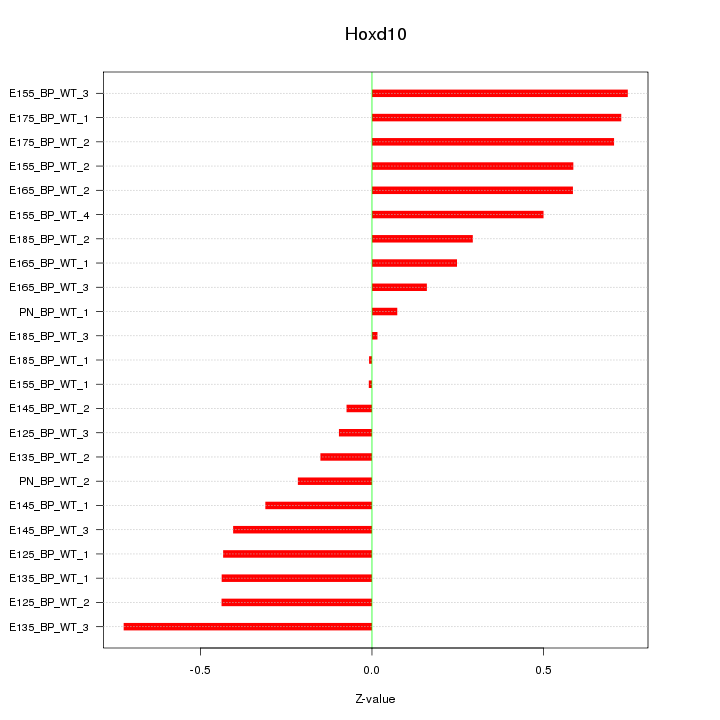
Z-value: 0.424
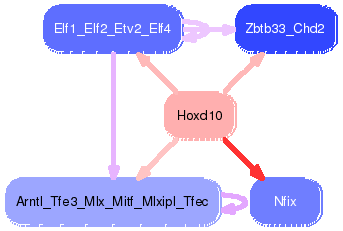
Transcription factors associated with Hoxd10:
| Gene Symbol | Entrez ID | Gene Name |
|---|---|---|
| Hoxd10 | ENSMUSG00000050368.3 | Hoxd10 |

Top targets:
Gene overrepresentation in biological_process category:
| Log-likelihood per target | Total log-likelihood | Term | Description |
|---|---|---|---|
| 0.3 | 1.1 | GO:0032289 | central nervous system myelin formation(GO:0032289) cardiac cell fate specification(GO:0060912) |
| 0.2 | 0.7 | GO:1903225 | negative regulation of endodermal cell differentiation(GO:1903225) |
| 0.1 | 2.0 | GO:0021684 | cerebellar granular layer formation(GO:0021684) cerebellar granule cell differentiation(GO:0021707) |
| 0.1 | 0.4 | GO:1904884 | telomerase catalytic core complex assembly(GO:1904868) regulation of telomerase catalytic core complex assembly(GO:1904882) positive regulation of telomerase catalytic core complex assembly(GO:1904884) |
| 0.1 | 1.6 | GO:0035235 | ionotropic glutamate receptor signaling pathway(GO:0035235) |
| 0.1 | 0.3 | GO:0036438 | maintenance of lens transparency(GO:0036438) |
| 0.1 | 1.4 | GO:0051044 | positive regulation of membrane protein ectodomain proteolysis(GO:0051044) |
| 0.1 | 0.6 | GO:0010650 | positive regulation of cell communication by electrical coupling(GO:0010650) positive regulation of membrane depolarization during cardiac muscle cell action potential(GO:1900827) |
| 0.0 | 0.3 | GO:0048341 | paraxial mesoderm formation(GO:0048341) |
| 0.0 | 0.2 | GO:0007195 | adenylate cyclase-inhibiting dopamine receptor signaling pathway(GO:0007195) |
| 0.0 | 0.2 | GO:0030035 | microspike assembly(GO:0030035) |
| 0.0 | 0.3 | GO:0060218 | hematopoietic stem cell differentiation(GO:0060218) |
| 0.0 | 0.1 | GO:0061010 | gall bladder development(GO:0061010) |
| 0.0 | 1.0 | GO:0051489 | regulation of filopodium assembly(GO:0051489) |
| 0.0 | 0.2 | GO:0050860 | negative regulation of T cell receptor signaling pathway(GO:0050860) |
| 0.0 | 0.3 | GO:0007097 | nuclear migration(GO:0007097) |
Gene overrepresentation in cellular_component category:
| Log-likelihood per target | Total log-likelihood | Term | Description |
|---|---|---|---|
| 0.2 | 0.7 | GO:0005588 | collagen type V trimer(GO:0005588) |
| 0.1 | 1.6 | GO:0032279 | asymmetric synapse(GO:0032279) |
| 0.0 | 0.8 | GO:0005614 | interstitial matrix(GO:0005614) |
| 0.0 | 0.8 | GO:0000159 | protein phosphatase type 2A complex(GO:0000159) |
| 0.0 | 0.2 | GO:0031523 | Myb complex(GO:0031523) |
| 0.0 | 0.3 | GO:0032584 | growth cone membrane(GO:0032584) |
| 0.0 | 0.6 | GO:0014731 | spectrin-associated cytoskeleton(GO:0014731) |
| 0.0 | 0.1 | GO:0033503 | HULC complex(GO:0033503) |
| 0.0 | 0.4 | GO:0001741 | XY body(GO:0001741) |
| 0.0 | 1.0 | GO:0016459 | myosin complex(GO:0016459) |
| 0.0 | 0.1 | GO:0032777 | Piccolo NuA4 histone acetyltransferase complex(GO:0032777) |
Gene overrepresentation in molecular_function category:
| Log-likelihood per target | Total log-likelihood | Term | Description |
|---|---|---|---|
| 0.2 | 1.5 | GO:0015277 | kainate selective glutamate receptor activity(GO:0015277) |
| 0.1 | 0.3 | GO:0008109 | N-acetyllactosaminide beta-1,6-N-acetylglucosaminyltransferase activity(GO:0008109) |
| 0.1 | 0.4 | GO:0032405 | MutLalpha complex binding(GO:0032405) MutSalpha complex binding(GO:0032407) |
| 0.1 | 1.4 | GO:0070064 | proline-rich region binding(GO:0070064) |
| 0.1 | 0.3 | GO:0008321 | Ral guanyl-nucleotide exchange factor activity(GO:0008321) |
| 0.1 | 0.2 | GO:0008475 | procollagen-lysine 5-dioxygenase activity(GO:0008475) |
| 0.1 | 0.2 | GO:0034988 | Fc-gamma receptor I complex binding(GO:0034988) |
| 0.0 | 0.8 | GO:0070016 | armadillo repeat domain binding(GO:0070016) |
| 0.0 | 1.6 | GO:0030507 | spectrin binding(GO:0030507) |
| 0.0 | 0.7 | GO:0005201 | extracellular matrix structural constituent(GO:0005201) |
| 0.0 | 0.3 | GO:0017160 | Ral GTPase binding(GO:0017160) |