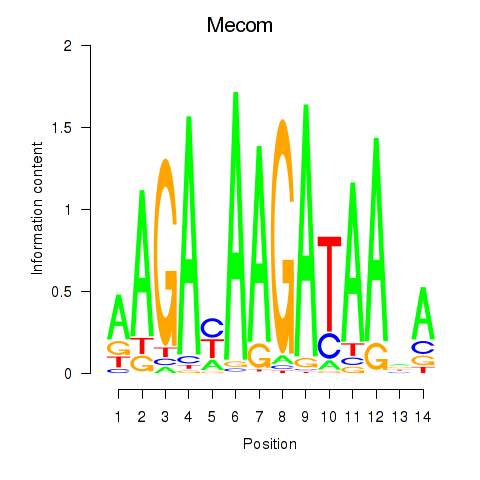
Motif ID: Mecom
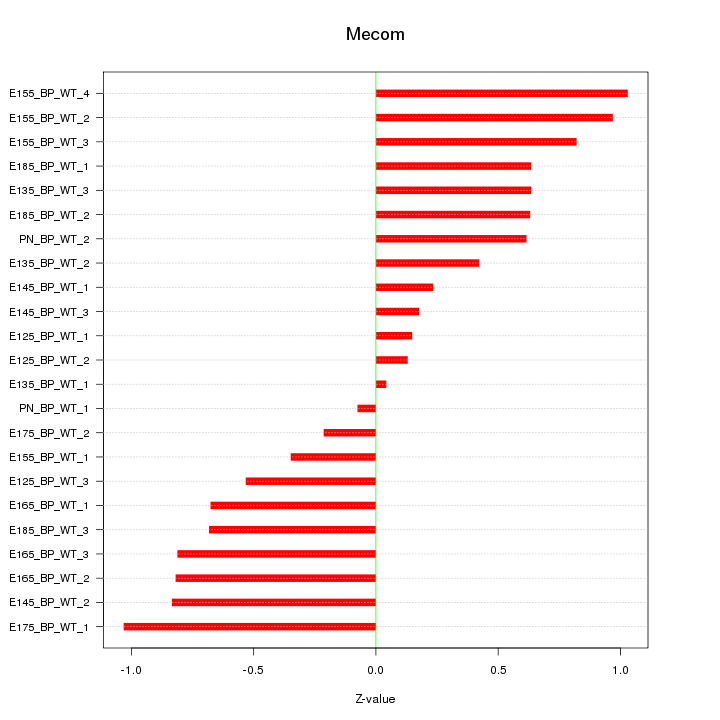
Z-value: 0.627
Transcription factors associated with Mecom:
| Gene Symbol | Entrez ID | Gene Name |
|---|---|---|
| Mecom | ENSMUSG00000027684.10 | Mecom |

Top targets:
Gene overrepresentation in biological_process category:
| Log-likelihood per target | Total log-likelihood | Term | Description |
|---|---|---|---|
| 2.1 | 10.5 | GO:0002457 | T cell antigen processing and presentation(GO:0002457) |
| 0.3 | 0.8 | GO:0050915 | sensory perception of sour taste(GO:0050915) |
| 0.2 | 1.2 | GO:0015671 | oxygen transport(GO:0015671) |
| 0.2 | 0.8 | GO:0060414 | aorta smooth muscle tissue morphogenesis(GO:0060414) |
| 0.1 | 0.3 | GO:0034476 | U1 snRNA 3'-end processing(GO:0034473) U5 snRNA 3'-end processing(GO:0034476) |
| 0.1 | 1.1 | GO:0097067 | negative regulation of erythrocyte differentiation(GO:0045647) cellular response to thyroid hormone stimulus(GO:0097067) |
| 0.1 | 0.2 | GO:0003032 | detection of oxygen(GO:0003032) regulation of epithelial to mesenchymal transition involved in endocardial cushion formation(GO:1905005) |
| 0.1 | 0.2 | GO:0048014 | Tie signaling pathway(GO:0048014) |
| 0.0 | 0.1 | GO:1900365 | positive regulation of mRNA polyadenylation(GO:1900365) |
| 0.0 | 0.2 | GO:0050747 | positive regulation of lipoprotein metabolic process(GO:0050747) |
| 0.0 | 0.1 | GO:1901843 | positive regulation of high voltage-gated calcium channel activity(GO:1901843) |
| 0.0 | 0.1 | GO:0070171 | negative regulation of tooth mineralization(GO:0070171) |
| 0.0 | 0.2 | GO:0036158 | outer dynein arm assembly(GO:0036158) |
| 0.0 | 0.3 | GO:0030948 | negative regulation of vascular endothelial growth factor receptor signaling pathway(GO:0030948) |
| 0.0 | 0.0 | GO:0018094 | protein polyglycylation(GO:0018094) |
| 0.0 | 0.0 | GO:0015712 | hexose phosphate transport(GO:0015712) glucose-6-phosphate transport(GO:0015760) phosphate ion transmembrane transport(GO:0035435) |
Gene overrepresentation in cellular_component category:
| Log-likelihood per target | Total log-likelihood | Term | Description |
|---|---|---|---|
| 0.2 | 1.2 | GO:0005833 | hemoglobin complex(GO:0005833) |
| 0.1 | 0.8 | GO:0098643 | fibrillar collagen trimer(GO:0005583) banded collagen fibril(GO:0098643) |
| 0.0 | 0.2 | GO:0036157 | outer dynein arm(GO:0036157) |
| 0.0 | 0.3 | GO:0000176 | nuclear exosome (RNase complex)(GO:0000176) |
Gene overrepresentation in molecular_function category:
| Log-likelihood per target | Total log-likelihood | Term | Description |
|---|---|---|---|
| 1.5 | 10.5 | GO:0032453 | histone demethylase activity (H3-K4 specific)(GO:0032453) |
| 0.3 | 1.2 | GO:0031721 | hemoglobin alpha binding(GO:0031721) |
| 0.1 | 0.8 | GO:0048407 | platelet-derived growth factor binding(GO:0048407) |
| 0.0 | 0.2 | GO:0034714 | type III transforming growth factor beta receptor binding(GO:0034714) |
| 0.0 | 0.8 | GO:1905030 | voltage-gated sodium channel activity(GO:0005248) voltage-gated ion channel activity involved in regulation of postsynaptic membrane potential(GO:1905030) |
| 0.0 | 0.2 | GO:0004427 | inorganic diphosphatase activity(GO:0004427) |
| 0.0 | 1.1 | GO:0043425 | bHLH transcription factor binding(GO:0043425) E-box binding(GO:0070888) |
| 0.0 | 0.2 | GO:0008429 | phosphatidylethanolamine binding(GO:0008429) |
| 0.0 | 0.2 | GO:0005172 | vascular endothelial growth factor receptor binding(GO:0005172) |
| 0.0 | 0.6 | GO:0004867 | serine-type endopeptidase inhibitor activity(GO:0004867) |
| 0.0 | 0.0 | GO:0035374 | chondroitin sulfate binding(GO:0035374) |
| 0.0 | 0.4 | GO:0017091 | AU-rich element binding(GO:0017091) |