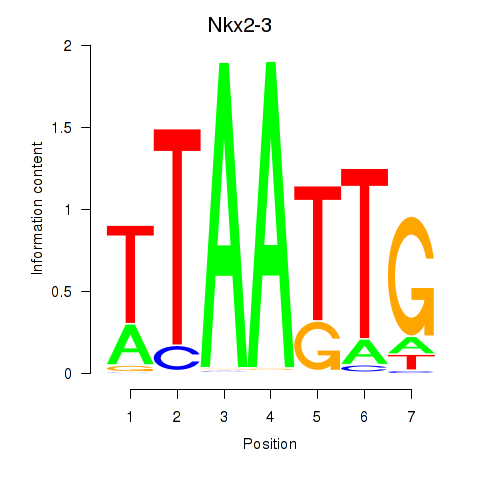
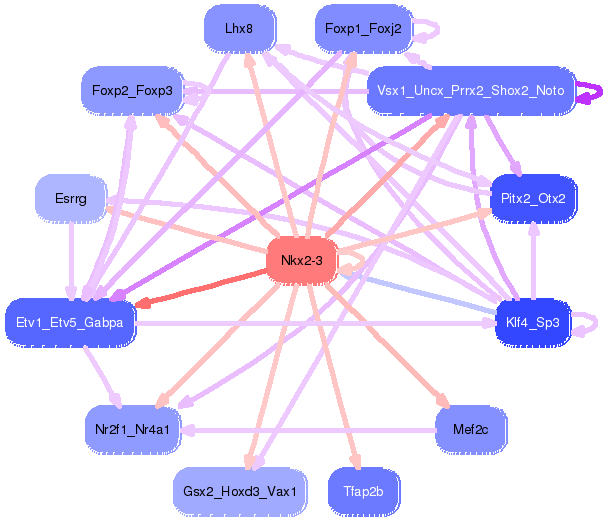
Motif ID: Nkx2-3
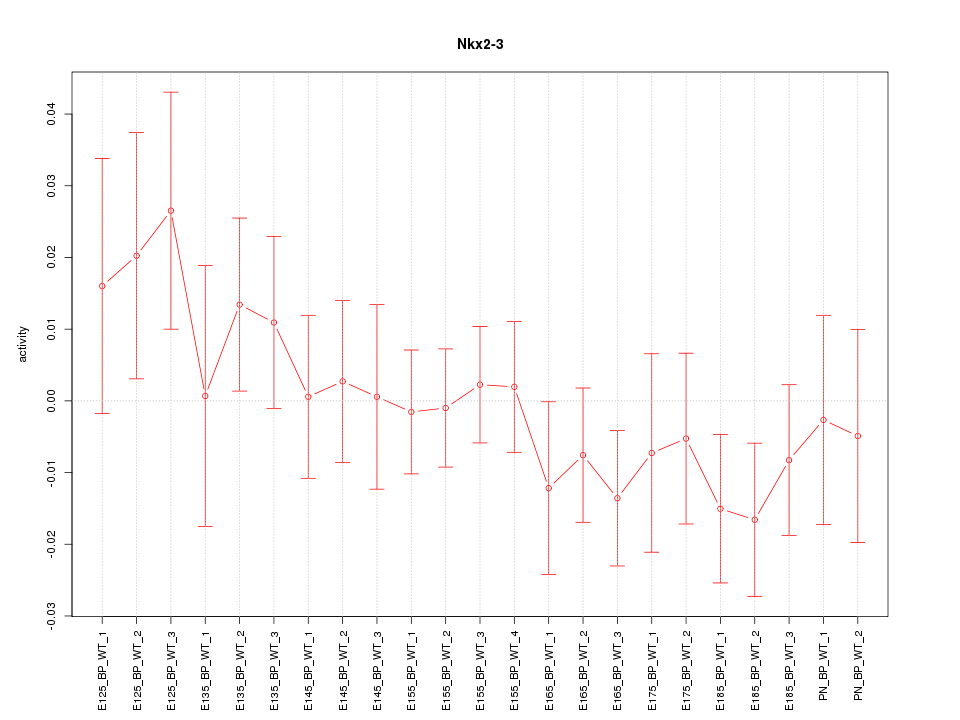
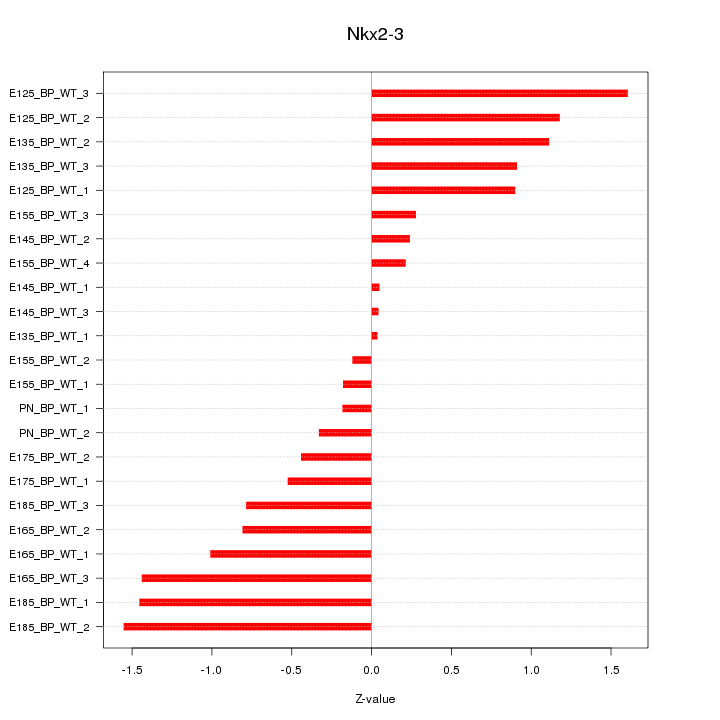
Z-value: 0.849
Transcription factors associated with Nkx2-3:
| Gene Symbol | Entrez ID | Gene Name |
|---|---|---|
| Nkx2-3 | ENSMUSG00000044220.12 | Nkx2-3 |
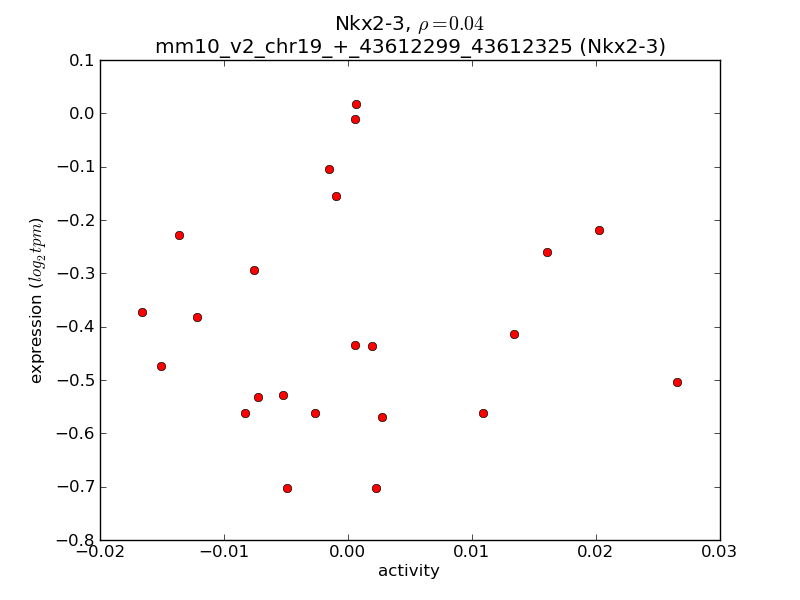
Activity-expression correlation:
| Gene Symbol | Promoter | Pearson corr. coef. | P-value | Plot |
|---|---|---|---|---|
| Nkx2-3 | mm10_v2_chr19_+_43612299_43612325 | 0.04 | 8.6e-01 | Click! |

Top targets:
Gene overrepresentation in biological_process category:
| Log-likelihood per target | Total log-likelihood | Term | Description |
|---|---|---|---|
| 1.6 | 9.3 | GO:0021797 | forebrain anterior/posterior pattern specification(GO:0021797) |
| 1.2 | 4.9 | GO:0014846 | esophagus smooth muscle contraction(GO:0014846) |
| 1.1 | 36.3 | GO:0007638 | mechanosensory behavior(GO:0007638) |
| 1.0 | 3.1 | GO:0016095 | polyprenol catabolic process(GO:0016095) terpenoid catabolic process(GO:0016115) primary alcohol catabolic process(GO:0034310) |
| 0.9 | 2.6 | GO:2001016 | muscle cell fate determination(GO:0007521) cellular response to parathyroid hormone stimulus(GO:0071374) positive regulation of macrophage apoptotic process(GO:2000111) positive regulation of skeletal muscle cell differentiation(GO:2001016) |
| 0.6 | 3.6 | GO:0060539 | diaphragm development(GO:0060539) |
| 0.6 | 2.8 | GO:1903215 | negative regulation of protein targeting to mitochondrion(GO:1903215) |
| 0.4 | 1.3 | GO:0060023 | soft palate development(GO:0060023) |
| 0.4 | 2.7 | GO:0051798 | positive regulation of hair follicle development(GO:0051798) |
| 0.4 | 1.1 | GO:0097274 | urea homeostasis(GO:0097274) |
| 0.3 | 1.2 | GO:0003347 | epicardial cell to mesenchymal cell transition(GO:0003347) |
| 0.3 | 1.4 | GO:0002121 | inter-male aggressive behavior(GO:0002121) |
| 0.2 | 2.0 | GO:0032625 | interleukin-21 production(GO:0032625) interleukin-21 secretion(GO:0072619) |
| 0.2 | 1.9 | GO:0035726 | common myeloid progenitor cell proliferation(GO:0035726) |
| 0.2 | 0.7 | GO:0045472 | response to ether(GO:0045472) |
| 0.2 | 2.1 | GO:0018230 | peptidyl-L-cysteine S-palmitoylation(GO:0018230) peptidyl-S-diacylglycerol-L-cysteine biosynthetic process from peptidyl-cysteine(GO:0018231) |
| 0.2 | 0.7 | GO:0014005 | microglia differentiation(GO:0014004) microglia development(GO:0014005) |
| 0.2 | 0.8 | GO:0046552 | eye photoreceptor cell fate commitment(GO:0042706) photoreceptor cell fate commitment(GO:0046552) |
| 0.2 | 1.0 | GO:0003383 | apical constriction(GO:0003383) |
| 0.2 | 0.8 | GO:0015692 | vanadium ion transport(GO:0015676) lead ion transport(GO:0015692) |
| 0.2 | 0.8 | GO:0046601 | positive regulation of centriole replication(GO:0046601) |
| 0.2 | 0.6 | GO:0010510 | regulation of acetyl-CoA biosynthetic process from pyruvate(GO:0010510) |
| 0.2 | 0.6 | GO:2000481 | positive regulation of cAMP-dependent protein kinase activity(GO:2000481) |
| 0.1 | 0.6 | GO:1902683 | regulation of receptor localization to synapse(GO:1902683) |
| 0.1 | 0.8 | GO:1900194 | negative regulation of oocyte maturation(GO:1900194) |
| 0.1 | 1.3 | GO:0035335 | peptidyl-tyrosine dephosphorylation(GO:0035335) |
| 0.1 | 0.4 | GO:0097155 | fasciculation of sensory neuron axon(GO:0097155) |
| 0.1 | 2.2 | GO:0071392 | cellular response to estradiol stimulus(GO:0071392) |
| 0.1 | 0.5 | GO:0071787 | endoplasmic reticulum tubular network assembly(GO:0071787) |
| 0.1 | 0.3 | GO:0060743 | epithelial cell maturation involved in prostate gland development(GO:0060743) alveolar secondary septum development(GO:0061144) |
| 0.1 | 2.6 | GO:0007617 | mating behavior(GO:0007617) multi-organism reproductive behavior(GO:0044705) |
| 0.1 | 2.1 | GO:0010172 | embryonic body morphogenesis(GO:0010172) |
| 0.1 | 2.0 | GO:0040037 | negative regulation of fibroblast growth factor receptor signaling pathway(GO:0040037) |
| 0.1 | 1.3 | GO:0060236 | regulation of mitotic spindle organization(GO:0060236) |
| 0.1 | 1.3 | GO:0021796 | cerebral cortex regionalization(GO:0021796) |
| 0.1 | 0.2 | GO:1902915 | negative regulation of protein K63-linked ubiquitination(GO:1900045) negative regulation of protein polyubiquitination(GO:1902915) |
| 0.1 | 0.8 | GO:0006012 | galactose metabolic process(GO:0006012) |
| 0.1 | 1.0 | GO:1903504 | regulation of mitotic cell cycle spindle assembly checkpoint(GO:0090266) regulation of mitotic spindle checkpoint(GO:1903504) |
| 0.1 | 0.5 | GO:0021780 | oligodendrocyte cell fate specification(GO:0021778) oligodendrocyte cell fate commitment(GO:0021779) glial cell fate specification(GO:0021780) |
| 0.1 | 1.0 | GO:0031017 | exocrine pancreas development(GO:0031017) |
| 0.1 | 1.2 | GO:0080111 | DNA demethylation(GO:0080111) |
| 0.1 | 0.6 | GO:1903847 | regulation of aorta morphogenesis(GO:1903847) positive regulation of aorta morphogenesis(GO:1903849) |
| 0.1 | 1.8 | GO:0006491 | N-glycan processing(GO:0006491) |
| 0.1 | 0.5 | GO:0018344 | protein geranylgeranylation(GO:0018344) |
| 0.1 | 0.3 | GO:0046684 | response to pyrethroid(GO:0046684) |
| 0.1 | 0.7 | GO:0060837 | blood vessel endothelial cell differentiation(GO:0060837) |
| 0.1 | 1.9 | GO:0003301 | physiological muscle hypertrophy(GO:0003298) physiological cardiac muscle hypertrophy(GO:0003301) cell growth involved in cardiac muscle cell development(GO:0061049) |
| 0.1 | 0.3 | GO:0009052 | pentose-phosphate shunt, non-oxidative branch(GO:0009052) |
| 0.1 | 0.2 | GO:0002326 | B cell lineage commitment(GO:0002326) |
| 0.1 | 0.4 | GO:0035095 | behavioral response to nicotine(GO:0035095) |
| 0.0 | 2.6 | GO:0048384 | retinoic acid receptor signaling pathway(GO:0048384) |
| 0.0 | 0.5 | GO:2001256 | regulation of store-operated calcium entry(GO:2001256) |
| 0.0 | 2.2 | GO:0032611 | interleukin-1 beta production(GO:0032611) |
| 0.0 | 0.4 | GO:0036371 | protein localization to M-band(GO:0036309) protein localization to T-tubule(GO:0036371) |
| 0.0 | 0.4 | GO:0007406 | negative regulation of neuroblast proliferation(GO:0007406) |
| 0.0 | 0.4 | GO:0033353 | S-adenosylmethionine cycle(GO:0033353) |
| 0.0 | 3.3 | GO:0051965 | positive regulation of synapse assembly(GO:0051965) |
| 0.0 | 0.3 | GO:2000301 | negative regulation of synaptic vesicle exocytosis(GO:2000301) |
| 0.0 | 0.2 | GO:0002317 | plasma cell differentiation(GO:0002317) |
| 0.0 | 0.3 | GO:0000395 | mRNA 5'-splice site recognition(GO:0000395) |
| 0.0 | 0.3 | GO:0035735 | intraciliary transport involved in cilium morphogenesis(GO:0035735) |
| 0.0 | 0.2 | GO:0045218 | zonula adherens maintenance(GO:0045218) |
| 0.0 | 0.1 | GO:0034214 | protein hexamerization(GO:0034214) |
| 0.0 | 0.0 | GO:0060166 | olfactory pit development(GO:0060166) |
| 0.0 | 0.2 | GO:0060018 | astrocyte fate commitment(GO:0060018) |
| 0.0 | 0.2 | GO:0030916 | otic vesicle formation(GO:0030916) |
| 0.0 | 0.4 | GO:0045899 | positive regulation of RNA polymerase II transcriptional preinitiation complex assembly(GO:0045899) |
| 0.0 | 1.0 | GO:0010842 | retina layer formation(GO:0010842) |
| 0.0 | 0.2 | GO:0032790 | ribosome disassembly(GO:0032790) |
| 0.0 | 0.3 | GO:0046036 | GTP biosynthetic process(GO:0006183) CTP biosynthetic process(GO:0006241) CTP metabolic process(GO:0046036) |
| 0.0 | 0.2 | GO:1903377 | negative regulation of oxidative stress-induced neuron intrinsic apoptotic signaling pathway(GO:1903377) |
| 0.0 | 0.8 | GO:0010800 | positive regulation of peptidyl-threonine phosphorylation(GO:0010800) |
| 0.0 | 0.1 | GO:0090148 | membrane fission(GO:0090148) |
| 0.0 | 0.5 | GO:0021860 | pyramidal neuron development(GO:0021860) |
| 0.0 | 0.2 | GO:0017196 | N-terminal peptidyl-methionine acetylation(GO:0017196) |
| 0.0 | 0.3 | GO:0010650 | positive regulation of cell communication by electrical coupling(GO:0010650) positive regulation of membrane depolarization during cardiac muscle cell action potential(GO:1900827) |
| 0.0 | 0.1 | GO:0021759 | globus pallidus development(GO:0021759) |
| 0.0 | 0.2 | GO:0016584 | nucleosome positioning(GO:0016584) |
| 0.0 | 0.6 | GO:0071425 | hematopoietic stem cell proliferation(GO:0071425) |
| 0.0 | 0.1 | GO:0014835 | myoblast differentiation involved in skeletal muscle regeneration(GO:0014835) stress-induced premature senescence(GO:0090400) |
| 0.0 | 0.3 | GO:0043922 | negative regulation by host of viral transcription(GO:0043922) |
| 0.0 | 0.1 | GO:0030242 | pexophagy(GO:0030242) |
| 0.0 | 0.2 | GO:0046085 | adenosine metabolic process(GO:0046085) |
| 0.0 | 0.3 | GO:0048672 | positive regulation of collateral sprouting(GO:0048672) |
| 0.0 | 0.1 | GO:0046689 | response to mercury ion(GO:0046689) |
| 0.0 | 1.9 | GO:0021954 | central nervous system neuron development(GO:0021954) |
| 0.0 | 0.1 | GO:0010871 | negative regulation of receptor biosynthetic process(GO:0010871) |
| 0.0 | 1.2 | GO:0048146 | positive regulation of fibroblast proliferation(GO:0048146) |
| 0.0 | 0.5 | GO:0071353 | cellular response to interleukin-4(GO:0071353) |
| 0.0 | 0.9 | GO:0002066 | columnar/cuboidal epithelial cell development(GO:0002066) |
| 0.0 | 0.2 | GO:0045974 | miRNA mediated inhibition of translation(GO:0035278) negative regulation of translation, ncRNA-mediated(GO:0040033) regulation of translation, ncRNA-mediated(GO:0045974) |
| 0.0 | 0.1 | GO:2000270 | negative regulation of fibroblast apoptotic process(GO:2000270) |
| 0.0 | 0.1 | GO:0070561 | vitamin D receptor signaling pathway(GO:0070561) regulation of vitamin D receptor signaling pathway(GO:0070562) |
| 0.0 | 0.7 | GO:0000184 | nuclear-transcribed mRNA catabolic process, nonsense-mediated decay(GO:0000184) |
| 0.0 | 0.2 | GO:0043508 | negative regulation of JUN kinase activity(GO:0043508) |
| 0.0 | 0.5 | GO:0048488 | synaptic vesicle endocytosis(GO:0048488) |
| 0.0 | 0.1 | GO:0008611 | ether lipid biosynthetic process(GO:0008611) glycerol ether biosynthetic process(GO:0046504) cellular lipid biosynthetic process(GO:0097384) ether biosynthetic process(GO:1901503) |
| 0.0 | 1.1 | GO:0043488 | regulation of mRNA stability(GO:0043488) |
| 0.0 | 0.8 | GO:0007219 | Notch signaling pathway(GO:0007219) |
| 0.0 | 0.3 | GO:0032402 | melanosome transport(GO:0032402) pigment granule transport(GO:0051904) |
| 0.0 | 0.2 | GO:0031507 | heterochromatin assembly(GO:0031507) |
| 0.0 | 1.2 | GO:0007601 | visual perception(GO:0007601) |
| 0.0 | 0.2 | GO:0043968 | histone H2A acetylation(GO:0043968) |
| 0.0 | 0.3 | GO:0014823 | response to activity(GO:0014823) |
| 0.0 | 0.2 | GO:0007094 | mitotic spindle assembly checkpoint(GO:0007094) |
| 0.0 | 0.2 | GO:0045063 | T-helper 1 cell differentiation(GO:0045063) |
| 0.0 | 0.1 | GO:0070171 | negative regulation of tooth mineralization(GO:0070171) |
| 0.0 | 0.1 | GO:0010715 | regulation of extracellular matrix disassembly(GO:0010715) smooth muscle cell-matrix adhesion(GO:0061302) |
| 0.0 | 0.4 | GO:0046627 | negative regulation of insulin receptor signaling pathway(GO:0046627) |
| 0.0 | 1.7 | GO:0030178 | negative regulation of Wnt signaling pathway(GO:0030178) |
| 0.0 | 1.1 | GO:0000086 | G2/M transition of mitotic cell cycle(GO:0000086) |
| 0.0 | 0.1 | GO:0090527 | actin filament reorganization(GO:0090527) |
Gene overrepresentation in cellular_component category:
| Log-likelihood per target | Total log-likelihood | Term | Description |
|---|---|---|---|
| 0.6 | 3.5 | GO:0033116 | endoplasmic reticulum-Golgi intermediate compartment membrane(GO:0033116) |
| 0.3 | 2.7 | GO:0097442 | CA3 pyramidal cell dendrite(GO:0097442) |
| 0.3 | 1.4 | GO:0000308 | cytoplasmic cyclin-dependent protein kinase holoenzyme complex(GO:0000308) |
| 0.2 | 2.1 | GO:0002178 | palmitoyltransferase complex(GO:0002178) |
| 0.2 | 0.8 | GO:0060187 | cell pole(GO:0060187) |
| 0.2 | 1.3 | GO:0005818 | aster(GO:0005818) |
| 0.2 | 1.1 | GO:0001940 | male pronucleus(GO:0001940) |
| 0.2 | 0.8 | GO:0070826 | paraferritin complex(GO:0070826) |
| 0.1 | 0.7 | GO:0000444 | MIS12/MIND type complex(GO:0000444) |
| 0.1 | 0.6 | GO:0070820 | tertiary granule(GO:0070820) |
| 0.1 | 1.0 | GO:0033269 | internode region of axon(GO:0033269) |
| 0.1 | 1.7 | GO:0005922 | connexon complex(GO:0005922) |
| 0.1 | 0.5 | GO:0005968 | Rab-protein geranylgeranyltransferase complex(GO:0005968) |
| 0.1 | 3.6 | GO:0043034 | costamere(GO:0043034) |
| 0.1 | 0.8 | GO:0098536 | deuterosome(GO:0098536) |
| 0.1 | 0.6 | GO:0001674 | female germ cell nucleus(GO:0001674) |
| 0.1 | 1.1 | GO:0042788 | polysomal ribosome(GO:0042788) |
| 0.1 | 0.7 | GO:0046581 | intercellular canaliculus(GO:0046581) |
| 0.1 | 0.4 | GO:0070876 | SOSS complex(GO:0070876) |
| 0.1 | 0.3 | GO:0017146 | NMDA selective glutamate receptor complex(GO:0017146) |
| 0.1 | 1.7 | GO:0046658 | anchored component of plasma membrane(GO:0046658) |
| 0.0 | 0.8 | GO:0031588 | nucleotide-activated protein kinase complex(GO:0031588) |
| 0.0 | 0.1 | GO:0097233 | lamellar body membrane(GO:0097232) alveolar lamellar body membrane(GO:0097233) |
| 0.0 | 0.5 | GO:0005677 | chromatin silencing complex(GO:0005677) |
| 0.0 | 1.0 | GO:0005680 | anaphase-promoting complex(GO:0005680) |
| 0.0 | 0.3 | GO:0008074 | guanylate cyclase complex, soluble(GO:0008074) |
| 0.0 | 0.4 | GO:0005892 | acetylcholine-gated channel complex(GO:0005892) |
| 0.0 | 1.3 | GO:0043198 | dendritic shaft(GO:0043198) |
| 0.0 | 0.4 | GO:0031595 | nuclear proteasome complex(GO:0031595) |
| 0.0 | 0.6 | GO:0035145 | exon-exon junction complex(GO:0035145) |
| 0.0 | 0.3 | GO:0000243 | commitment complex(GO:0000243) |
| 0.0 | 1.0 | GO:0032839 | dendrite cytoplasm(GO:0032839) |
| 0.0 | 0.2 | GO:0035068 | micro-ribonucleoprotein complex(GO:0035068) |
| 0.0 | 0.5 | GO:0005640 | nuclear outer membrane(GO:0005640) |
| 0.0 | 0.2 | GO:0042382 | paraspeckles(GO:0042382) |
| 0.0 | 0.2 | GO:0031415 | NatA complex(GO:0031415) |
| 0.0 | 0.3 | GO:0031045 | dense core granule(GO:0031045) |
| 0.0 | 0.1 | GO:0034684 | integrin alphav-beta5 complex(GO:0034684) |
| 0.0 | 0.3 | GO:0005852 | eukaryotic translation initiation factor 3 complex(GO:0005852) |
| 0.0 | 0.2 | GO:0016272 | prefoldin complex(GO:0016272) |
| 0.0 | 0.3 | GO:0034706 | voltage-gated sodium channel complex(GO:0001518) sodium channel complex(GO:0034706) |
| 0.0 | 2.6 | GO:0016607 | nuclear speck(GO:0016607) |
| 0.0 | 0.3 | GO:0014731 | spectrin-associated cytoskeleton(GO:0014731) |
| 0.0 | 0.3 | GO:0097225 | sperm midpiece(GO:0097225) |
| 0.0 | 2.9 | GO:0014069 | postsynaptic density(GO:0014069) postsynaptic specialization(GO:0099572) |
| 0.0 | 0.3 | GO:0016580 | Sin3 complex(GO:0016580) |
| 0.0 | 0.1 | GO:0005726 | perichromatin fibrils(GO:0005726) |
| 0.0 | 0.2 | GO:0005869 | dynactin complex(GO:0005869) |
| 0.0 | 0.1 | GO:0005751 | mitochondrial respiratory chain complex IV(GO:0005751) |
| 0.0 | 0.2 | GO:0043189 | NuA4 histone acetyltransferase complex(GO:0035267) H4/H2A histone acetyltransferase complex(GO:0043189) H4 histone acetyltransferase complex(GO:1902562) |
| 0.0 | 0.1 | GO:0000276 | mitochondrial proton-transporting ATP synthase complex, coupling factor F(o)(GO:0000276) |
| 0.0 | 0.7 | GO:0031463 | Cul3-RING ubiquitin ligase complex(GO:0031463) |
| 0.0 | 0.1 | GO:0008290 | F-actin capping protein complex(GO:0008290) |
Gene overrepresentation in molecular_function category:
| Log-likelihood per target | Total log-likelihood | Term | Description |
|---|---|---|---|
| 1.0 | 4.9 | GO:0008449 | N-acetylglucosamine-6-sulfatase activity(GO:0008449) |
| 0.7 | 2.2 | GO:0004994 | somatostatin receptor activity(GO:0004994) |
| 0.5 | 3.1 | GO:0001758 | retinal dehydrogenase activity(GO:0001758) |
| 0.5 | 3.4 | GO:0015016 | [heparan sulfate]-glucosamine N-sulfotransferase activity(GO:0015016) |
| 0.4 | 1.8 | GO:0008454 | alpha-1,3-mannosylglycoprotein 4-beta-N-acetylglucosaminyltransferase activity(GO:0008454) |
| 0.3 | 2.7 | GO:0005519 | cytoskeletal regulatory protein binding(GO:0005519) |
| 0.3 | 0.8 | GO:0004335 | galactokinase activity(GO:0004335) |
| 0.3 | 1.3 | GO:0061676 | importin-alpha family protein binding(GO:0061676) |
| 0.2 | 2.6 | GO:0003680 | AT DNA binding(GO:0003680) |
| 0.2 | 2.5 | GO:0048185 | activin binding(GO:0048185) |
| 0.2 | 0.2 | GO:0008579 | protein tyrosine/threonine phosphatase activity(GO:0008330) JUN kinase phosphatase activity(GO:0008579) |
| 0.2 | 0.7 | GO:0008559 | xenobiotic-transporting ATPase activity(GO:0008559) |
| 0.2 | 0.8 | GO:0015086 | cadmium ion transmembrane transporter activity(GO:0015086) lead ion transmembrane transporter activity(GO:0015094) vanadium ion transmembrane transporter activity(GO:0015100) ferrous iron uptake transmembrane transporter activity(GO:0015639) |
| 0.2 | 0.6 | GO:0004740 | pyruvate dehydrogenase (acetyl-transferring) kinase activity(GO:0004740) |
| 0.2 | 3.0 | GO:0003708 | retinoic acid receptor activity(GO:0003708) |
| 0.1 | 2.0 | GO:0015197 | peptide transporter activity(GO:0015197) |
| 0.1 | 1.0 | GO:0044323 | retinoic acid-responsive element binding(GO:0044323) |
| 0.1 | 1.1 | GO:0000983 | transcription factor activity, RNA polymerase II core promoter sequence-specific(GO:0000983) |
| 0.1 | 0.2 | GO:0070644 | vitamin D response element binding(GO:0070644) |
| 0.1 | 42.9 | GO:0000978 | RNA polymerase II core promoter proximal region sequence-specific DNA binding(GO:0000978) |
| 0.1 | 2.1 | GO:0019706 | protein-cysteine S-palmitoyltransferase activity(GO:0019706) |
| 0.1 | 0.5 | GO:0031802 | type 5 metabotropic glutamate receptor binding(GO:0031802) |
| 0.1 | 0.7 | GO:0043522 | leucine zipper domain binding(GO:0043522) |
| 0.1 | 0.4 | GO:0071253 | connexin binding(GO:0071253) |
| 0.1 | 0.4 | GO:0001162 | RNA polymerase II intronic transcription regulatory region sequence-specific DNA binding(GO:0001162) |
| 0.1 | 3.0 | GO:0004683 | calmodulin-dependent protein kinase activity(GO:0004683) |
| 0.1 | 0.8 | GO:0008603 | cAMP-dependent protein kinase regulator activity(GO:0008603) |
| 0.1 | 0.7 | GO:0031852 | mu-type opioid receptor binding(GO:0031852) |
| 0.1 | 2.5 | GO:0043027 | cysteine-type endopeptidase inhibitor activity involved in apoptotic process(GO:0043027) |
| 0.1 | 0.5 | GO:0043495 | protein anchor(GO:0043495) |
| 0.1 | 0.5 | GO:0019869 | chloride channel inhibitor activity(GO:0019869) |
| 0.1 | 2.6 | GO:0001102 | RNA polymerase II activating transcription factor binding(GO:0001102) |
| 0.1 | 0.4 | GO:0036402 | proteasome-activating ATPase activity(GO:0036402) |
| 0.1 | 0.4 | GO:0004013 | adenosylhomocysteinase activity(GO:0004013) trialkylsulfonium hydrolase activity(GO:0016802) |
| 0.0 | 0.2 | GO:0097109 | neuroligin family protein binding(GO:0097109) |
| 0.0 | 1.2 | GO:0005070 | SH3/SH2 adaptor activity(GO:0005070) |
| 0.0 | 0.3 | GO:0004383 | guanylate cyclase activity(GO:0004383) |
| 0.0 | 0.4 | GO:0004889 | acetylcholine-activated cation-selective channel activity(GO:0004889) |
| 0.0 | 1.3 | GO:0017017 | MAP kinase tyrosine/serine/threonine phosphatase activity(GO:0017017) |
| 0.0 | 0.3 | GO:1990446 | U1 snRNP binding(GO:1990446) |
| 0.0 | 1.1 | GO:0017091 | AU-rich element binding(GO:0017091) |
| 0.0 | 1.5 | GO:0070491 | repressing transcription factor binding(GO:0070491) |
| 0.0 | 1.0 | GO:0016814 | hydrolase activity, acting on carbon-nitrogen (but not peptide) bonds, in cyclic amidines(GO:0016814) |
| 0.0 | 1.4 | GO:0097472 | cyclin-dependent protein serine/threonine kinase activity(GO:0004693) cyclin-dependent protein kinase activity(GO:0097472) |
| 0.0 | 0.6 | GO:0003950 | NAD+ ADP-ribosyltransferase activity(GO:0003950) |
| 0.0 | 1.7 | GO:0001158 | enhancer sequence-specific DNA binding(GO:0001158) |
| 0.0 | 0.1 | GO:0051525 | NFAT protein binding(GO:0051525) |
| 0.0 | 0.5 | GO:0005092 | GDP-dissociation inhibitor activity(GO:0005092) |
| 0.0 | 0.1 | GO:0004614 | phosphoglucomutase activity(GO:0004614) |
| 0.0 | 1.0 | GO:0032266 | phosphatidylinositol-3-phosphate binding(GO:0032266) |
| 0.0 | 0.1 | GO:0070579 | methylcytosine dioxygenase activity(GO:0070579) |
| 0.0 | 3.2 | GO:0030165 | PDZ domain binding(GO:0030165) |
| 0.0 | 0.3 | GO:0019215 | intermediate filament binding(GO:0019215) |
| 0.0 | 0.2 | GO:0070097 | delta-catenin binding(GO:0070097) |
| 0.0 | 0.1 | GO:0001161 | intronic transcription regulatory region sequence-specific DNA binding(GO:0001161) |
| 0.0 | 0.2 | GO:0008253 | 5'-nucleotidase activity(GO:0008253) |
| 0.0 | 0.8 | GO:0031490 | chromatin DNA binding(GO:0031490) |
| 0.0 | 3.2 | GO:0051015 | actin filament binding(GO:0051015) |
| 0.0 | 0.5 | GO:0008093 | cytoskeletal adaptor activity(GO:0008093) |
| 0.0 | 0.1 | GO:0034056 | estrogen response element binding(GO:0034056) |
| 0.0 | 0.1 | GO:0015265 | urea channel activity(GO:0015265) |
| 0.0 | 0.2 | GO:0004596 | peptide alpha-N-acetyltransferase activity(GO:0004596) |
| 0.0 | 0.3 | GO:0016857 | racemase and epimerase activity, acting on carbohydrates and derivatives(GO:0016857) |
| 0.0 | 0.1 | GO:0038062 | protein tyrosine kinase collagen receptor activity(GO:0038062) |
| 0.0 | 0.3 | GO:1905030 | voltage-gated sodium channel activity(GO:0005248) voltage-gated ion channel activity involved in regulation of postsynaptic membrane potential(GO:1905030) |
| 0.0 | 0.6 | GO:0046875 | ephrin receptor binding(GO:0046875) |
| 0.0 | 0.1 | GO:0019960 | C-X3-C chemokine binding(GO:0019960) neuregulin binding(GO:0038132) |
| 0.0 | 0.5 | GO:0005200 | structural constituent of cytoskeleton(GO:0005200) |
| 0.0 | 0.2 | GO:0046966 | thyroid hormone receptor binding(GO:0046966) |
| 0.0 | 0.7 | GO:0002039 | p53 binding(GO:0002039) |
| 0.0 | 0.3 | GO:0001786 | phosphatidylserine binding(GO:0001786) |
| 0.0 | 0.1 | GO:0000268 | peroxisome targeting sequence binding(GO:0000268) |
| 0.0 | 2.6 | GO:0061630 | ubiquitin protein ligase activity(GO:0061630) |