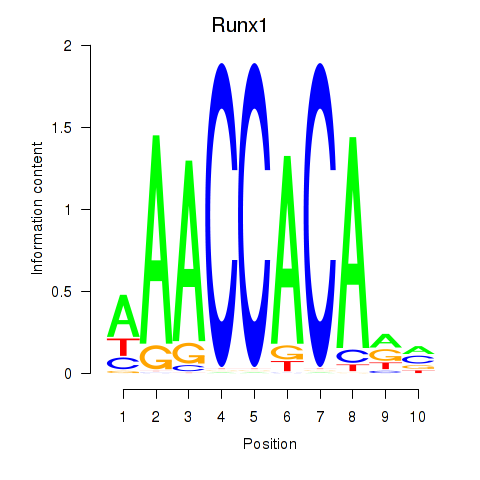
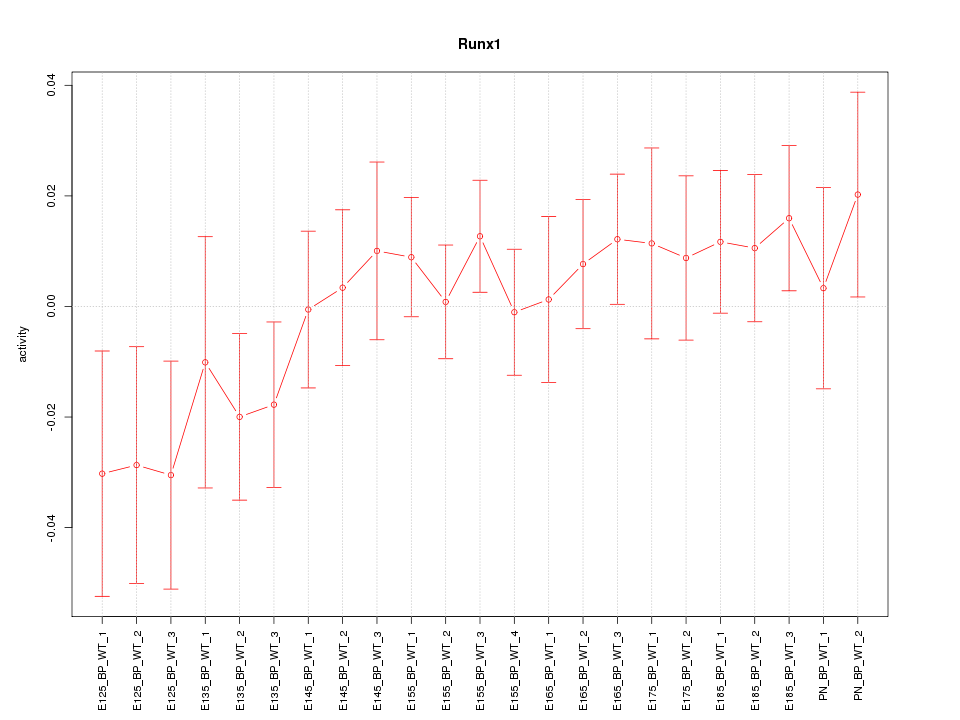
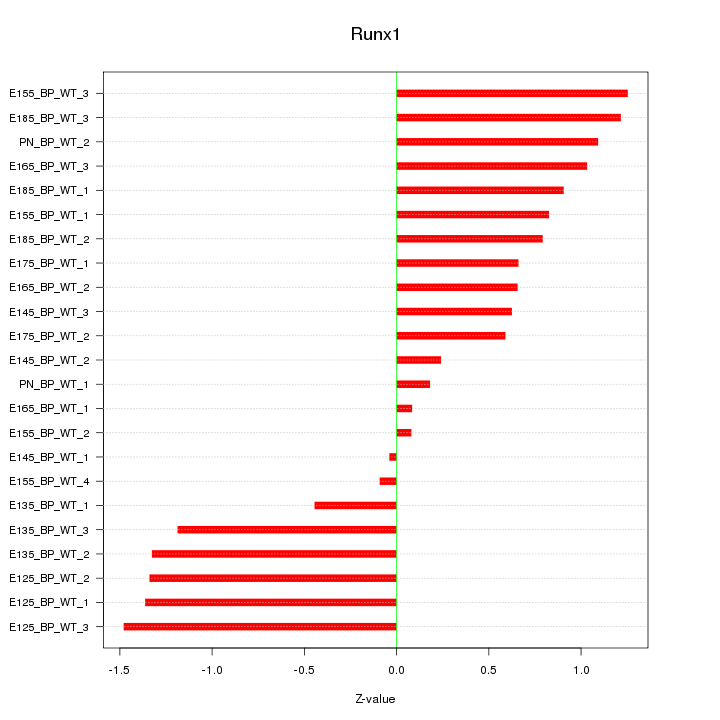
Motif ID: Runx1
Z-value: 0.894
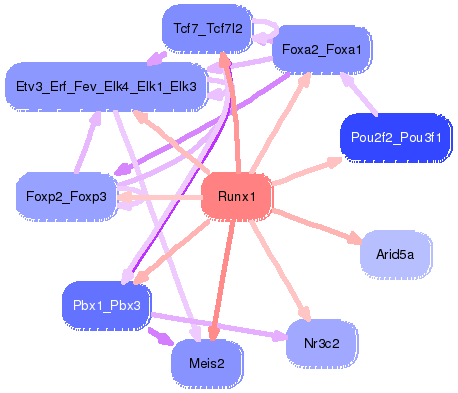
Transcription factors associated with Runx1:
| Gene Symbol | Entrez ID | Gene Name |
|---|---|---|
| Runx1 | ENSMUSG00000022952.10 | Runx1 |

Top targets:
Gene overrepresentation in biological_process category:
| Log-likelihood per target | Total log-likelihood | Term | Description |
|---|---|---|---|
| 1.7 | 5.0 | GO:1904139 | microglial cell migration(GO:1904124) regulation of microglial cell migration(GO:1904139) |
| 0.5 | 3.0 | GO:0072513 | positive regulation of secondary heart field cardioblast proliferation(GO:0072513) |
| 0.4 | 2.1 | GO:0045578 | negative regulation of B cell differentiation(GO:0045578) epithelial cell differentiation involved in mammary gland alveolus development(GO:0061030) |
| 0.4 | 3.7 | GO:0002903 | negative regulation of B cell apoptotic process(GO:0002903) |
| 0.3 | 2.1 | GO:0006957 | complement activation, alternative pathway(GO:0006957) |
| 0.3 | 0.9 | GO:0035811 | negative regulation of urine volume(GO:0035811) |
| 0.3 | 3.1 | GO:0090050 | positive regulation of cell migration involved in sprouting angiogenesis(GO:0090050) |
| 0.3 | 10.0 | GO:0032728 | positive regulation of interferon-beta production(GO:0032728) |
| 0.2 | 5.7 | GO:0032967 | positive regulation of collagen biosynthetic process(GO:0032967) |
| 0.2 | 2.0 | GO:0033280 | response to vitamin D(GO:0033280) |
| 0.2 | 1.0 | GO:0038018 | Wnt receptor catabolic process(GO:0038018) |
| 0.2 | 1.4 | GO:0002681 | somatic diversification of T cell receptor genes(GO:0002568) somatic recombination of T cell receptor gene segments(GO:0002681) T cell receptor V(D)J recombination(GO:0033153) |
| 0.2 | 0.9 | GO:0001561 | fatty acid alpha-oxidation(GO:0001561) |
| 0.2 | 1.5 | GO:0060665 | regulation of branching involved in salivary gland morphogenesis by mesenchymal-epithelial signaling(GO:0060665) |
| 0.1 | 0.7 | GO:0051684 | maintenance of Golgi location(GO:0051684) |
| 0.1 | 0.8 | GO:0042756 | drinking behavior(GO:0042756) |
| 0.1 | 0.9 | GO:0019532 | oxalate transport(GO:0019532) |
| 0.1 | 1.1 | GO:1904707 | positive regulation of vascular smooth muscle cell proliferation(GO:1904707) |
| 0.1 | 0.6 | GO:0046103 | ADP biosynthetic process(GO:0006172) inosine biosynthetic process(GO:0046103) |
| 0.1 | 0.6 | GO:1903071 | positive regulation of ER-associated ubiquitin-dependent protein catabolic process(GO:1903071) |
| 0.1 | 0.3 | GO:0045014 | detection of carbohydrate stimulus(GO:0009730) detection of hexose stimulus(GO:0009732) detection of monosaccharide stimulus(GO:0034287) carbon catabolite repression of transcription(GO:0045013) negative regulation of transcription by glucose(GO:0045014) detection of glucose(GO:0051594) |
| 0.1 | 0.2 | GO:0090071 | negative regulation of ribosome biogenesis(GO:0090071) |
| 0.1 | 0.4 | GO:0031915 | positive regulation of synaptic plasticity(GO:0031915) positive regulation of receptor binding(GO:1900122) |
| 0.1 | 1.6 | GO:0006767 | water-soluble vitamin metabolic process(GO:0006767) |
| 0.1 | 0.4 | GO:0061101 | neuroendocrine cell differentiation(GO:0061101) |
| 0.1 | 0.9 | GO:2000766 | negative regulation of cytoplasmic translation(GO:2000766) |
| 0.1 | 0.2 | GO:0010752 | signal complex assembly(GO:0007172) regulation of cGMP-mediated signaling(GO:0010752) |
| 0.1 | 1.1 | GO:0010592 | positive regulation of lamellipodium assembly(GO:0010592) |
| 0.0 | 0.9 | GO:0090231 | regulation of spindle checkpoint(GO:0090231) |
| 0.0 | 0.1 | GO:0032714 | negative regulation of interleukin-5 production(GO:0032714) regulation of CD4-positive, CD25-positive, alpha-beta regulatory T cell differentiation(GO:0032829) |
| 0.0 | 1.2 | GO:0071480 | cellular response to gamma radiation(GO:0071480) |
| 0.0 | 0.9 | GO:0010971 | positive regulation of G2/M transition of mitotic cell cycle(GO:0010971) |
| 0.0 | 0.5 | GO:0045898 | regulation of RNA polymerase II transcriptional preinitiation complex assembly(GO:0045898) |
| 0.0 | 0.3 | GO:0050908 | detection of light stimulus involved in visual perception(GO:0050908) detection of light stimulus involved in sensory perception(GO:0050962) |
| 0.0 | 0.5 | GO:0030213 | hyaluronan biosynthetic process(GO:0030213) |
| 0.0 | 1.8 | GO:0008542 | visual learning(GO:0008542) |
| 0.0 | 3.6 | GO:0030518 | intracellular steroid hormone receptor signaling pathway(GO:0030518) |
| 0.0 | 0.1 | GO:0043313 | regulation of neutrophil degranulation(GO:0043313) |
| 0.0 | 0.4 | GO:0045742 | positive regulation of epidermal growth factor receptor signaling pathway(GO:0045742) |
| 0.0 | 0.1 | GO:0070236 | negative regulation of activation-induced cell death of T cells(GO:0070236) |
| 0.0 | 0.1 | GO:0060158 | phospholipase C-activating dopamine receptor signaling pathway(GO:0060158) |
| 0.0 | 0.3 | GO:0000042 | protein targeting to Golgi(GO:0000042) |
| 0.0 | 0.7 | GO:0035066 | positive regulation of histone acetylation(GO:0035066) |
| 0.0 | 1.0 | GO:1901998 | toxin transport(GO:1901998) |
| 0.0 | 1.8 | GO:0006888 | ER to Golgi vesicle-mediated transport(GO:0006888) |
| 0.0 | 3.2 | GO:0035023 | regulation of Rho protein signal transduction(GO:0035023) |
| 0.0 | 0.8 | GO:0045744 | negative regulation of G-protein coupled receptor protein signaling pathway(GO:0045744) |
| 0.0 | 0.7 | GO:1900087 | positive regulation of G1/S transition of mitotic cell cycle(GO:1900087) |
| 0.0 | 1.2 | GO:0003073 | regulation of systemic arterial blood pressure(GO:0003073) |
| 0.0 | 0.1 | GO:0043568 | positive regulation of insulin-like growth factor receptor signaling pathway(GO:0043568) |
| 0.0 | 0.2 | GO:0060213 | regulation of nuclear-transcribed mRNA poly(A) tail shortening(GO:0060211) positive regulation of nuclear-transcribed mRNA poly(A) tail shortening(GO:0060213) |
| 0.0 | 0.2 | GO:0007190 | activation of adenylate cyclase activity(GO:0007190) |
| 0.0 | 0.1 | GO:0043615 | astrocyte cell migration(GO:0043615) |
| 0.0 | 0.3 | GO:0048305 | immunoglobulin secretion(GO:0048305) |
| 0.0 | 0.2 | GO:1901741 | positive regulation of myoblast fusion(GO:1901741) |
| 0.0 | 1.0 | GO:0015807 | L-amino acid transport(GO:0015807) |
Gene overrepresentation in cellular_component category:
| Log-likelihood per target | Total log-likelihood | Term | Description |
|---|---|---|---|
| 1.9 | 5.7 | GO:0038045 | large latent transforming growth factor-beta complex(GO:0038045) |
| 1.7 | 5.0 | GO:1990682 | CSF1-CSF1R complex(GO:1990682) |
| 0.2 | 1.1 | GO:1990604 | IRE1-TRAF2-ASK1 complex(GO:1990604) |
| 0.2 | 0.6 | GO:1990037 | Lewy body core(GO:1990037) |
| 0.1 | 1.0 | GO:0031209 | SCAR complex(GO:0031209) |
| 0.1 | 0.9 | GO:0097431 | mitotic spindle pole(GO:0097431) |
| 0.1 | 0.6 | GO:0001520 | outer dense fiber(GO:0001520) |
| 0.1 | 0.9 | GO:0031528 | microvillus membrane(GO:0031528) |
| 0.0 | 0.5 | GO:0005922 | connexon complex(GO:0005922) |
| 0.0 | 0.1 | GO:0031673 | H zone(GO:0031673) |
| 0.0 | 1.4 | GO:0005719 | nuclear euchromatin(GO:0005719) |
| 0.0 | 2.7 | GO:0035097 | histone methyltransferase complex(GO:0035097) |
| 0.0 | 0.7 | GO:0005865 | striated muscle thin filament(GO:0005865) |
| 0.0 | 0.4 | GO:0019908 | nuclear cyclin-dependent protein kinase holoenzyme complex(GO:0019908) |
| 0.0 | 3.0 | GO:0032993 | protein-DNA complex(GO:0032993) |
| 0.0 | 1.5 | GO:0036126 | sperm flagellum(GO:0036126) |
| 0.0 | 1.7 | GO:0072562 | blood microparticle(GO:0072562) |
| 0.0 | 0.5 | GO:0000307 | cyclin-dependent protein kinase holoenzyme complex(GO:0000307) |
| 0.0 | 0.4 | GO:0005844 | polysome(GO:0005844) |
| 0.0 | 0.1 | GO:0010369 | chromocenter(GO:0010369) |
| 0.0 | 0.0 | GO:0016514 | SWI/SNF complex(GO:0016514) |
| 0.0 | 0.0 | GO:0030981 | cortical microtubule cytoskeleton(GO:0030981) |
| 0.0 | 3.5 | GO:0005578 | proteinaceous extracellular matrix(GO:0005578) |
| 0.0 | 5.5 | GO:0000785 | chromatin(GO:0000785) |
| 0.0 | 0.9 | GO:0005777 | peroxisome(GO:0005777) microbody(GO:0042579) |
| 0.0 | 0.1 | GO:0044352 | pinosome(GO:0044352) macropinosome(GO:0044354) |
| 0.0 | 0.5 | GO:0030027 | lamellipodium(GO:0030027) |
Gene overrepresentation in molecular_function category:
| Log-likelihood per target | Total log-likelihood | Term | Description |
|---|---|---|---|
| 1.4 | 5.7 | GO:0050436 | microfibril binding(GO:0050436) |
| 0.7 | 2.1 | GO:0001851 | complement component C3b binding(GO:0001851) |
| 0.4 | 1.5 | GO:0005008 | hepatocyte growth factor-activated receptor activity(GO:0005008) |
| 0.1 | 0.9 | GO:0008294 | calcium- and calmodulin-responsive adenylate cyclase activity(GO:0008294) |
| 0.1 | 2.9 | GO:0031078 | histone deacetylase activity (H3-K14 specific)(GO:0031078) NAD-dependent histone deacetylase activity (H3-K14 specific)(GO:0032041) |
| 0.1 | 3.4 | GO:0070016 | armadillo repeat domain binding(GO:0070016) |
| 0.1 | 0.9 | GO:0030976 | thiamine pyrophosphate binding(GO:0030976) |
| 0.1 | 3.1 | GO:0071889 | 14-3-3 protein binding(GO:0071889) |
| 0.1 | 0.9 | GO:1990715 | mRNA CDS binding(GO:1990715) |
| 0.1 | 0.9 | GO:0019531 | oxalate transmembrane transporter activity(GO:0019531) |
| 0.1 | 0.7 | GO:0004865 | protein serine/threonine phosphatase inhibitor activity(GO:0004865) |
| 0.1 | 7.4 | GO:0005125 | cytokine activity(GO:0005125) |
| 0.1 | 10.0 | GO:0001078 | transcriptional repressor activity, RNA polymerase II core promoter proximal region sequence-specific binding(GO:0001078) |
| 0.1 | 0.2 | GO:0004999 | vasoactive intestinal polypeptide receptor activity(GO:0004999) |
| 0.1 | 0.6 | GO:0004017 | adenylate kinase activity(GO:0004017) |
| 0.0 | 1.2 | GO:0043014 | alpha-tubulin binding(GO:0043014) |
| 0.0 | 0.4 | GO:0005068 | transmembrane receptor protein tyrosine kinase adaptor activity(GO:0005068) |
| 0.0 | 0.1 | GO:0043426 | MRF binding(GO:0043426) |
| 0.0 | 0.8 | GO:0071855 | neuropeptide receptor binding(GO:0071855) |
| 0.0 | 0.1 | GO:0001588 | dopamine neurotransmitter receptor activity, coupled via Gs(GO:0001588) |
| 0.0 | 4.5 | GO:0005089 | Rho guanyl-nucleotide exchange factor activity(GO:0005089) |
| 0.0 | 1.4 | GO:0015175 | neutral amino acid transmembrane transporter activity(GO:0015175) |
| 0.0 | 1.5 | GO:0030544 | Hsp70 protein binding(GO:0030544) |
| 0.0 | 1.1 | GO:0004709 | MAP kinase kinase kinase activity(GO:0004709) |
| 0.0 | 1.6 | GO:0016811 | hydrolase activity, acting on carbon-nitrogen (but not peptide) bonds, in linear amides(GO:0016811) |
| 0.0 | 1.0 | GO:0005109 | frizzled binding(GO:0005109) |
| 0.0 | 0.1 | GO:0031995 | insulin-like growth factor II binding(GO:0031995) |
| 0.0 | 0.4 | GO:0001968 | fibronectin binding(GO:0001968) |
| 0.0 | 0.2 | GO:0005338 | nucleotide-sugar transmembrane transporter activity(GO:0005338) |
| 0.0 | 0.8 | GO:0001965 | G-protein alpha-subunit binding(GO:0001965) |
| 0.0 | 0.2 | GO:0043423 | 3-phosphoinositide-dependent protein kinase binding(GO:0043423) |
| 0.0 | 2.3 | GO:0008201 | heparin binding(GO:0008201) |
| 0.0 | 1.4 | GO:0001227 | transcriptional repressor activity, RNA polymerase II transcription regulatory region sequence-specific binding(GO:0001227) |
| 0.0 | 0.4 | GO:0030553 | cGMP binding(GO:0030553) |
| 0.0 | 2.4 | GO:0004725 | protein tyrosine phosphatase activity(GO:0004725) |
| 0.0 | 0.1 | GO:0051525 | NFAT protein binding(GO:0051525) |
| 0.0 | 0.3 | GO:0008331 | high voltage-gated calcium channel activity(GO:0008331) |
| 0.0 | 0.9 | GO:0004896 | cytokine receptor activity(GO:0004896) |
| 0.0 | 0.2 | GO:0045125 | bioactive lipid receptor activity(GO:0045125) |
| 0.0 | 3.7 | GO:0001077 | transcriptional activator activity, RNA polymerase II core promoter proximal region sequence-specific binding(GO:0001077) |
| 0.0 | 2.3 | GO:0044325 | ion channel binding(GO:0044325) |
| 0.0 | 0.5 | GO:0097472 | cyclin-dependent protein serine/threonine kinase activity(GO:0004693) cyclin-dependent protein kinase activity(GO:0097472) |