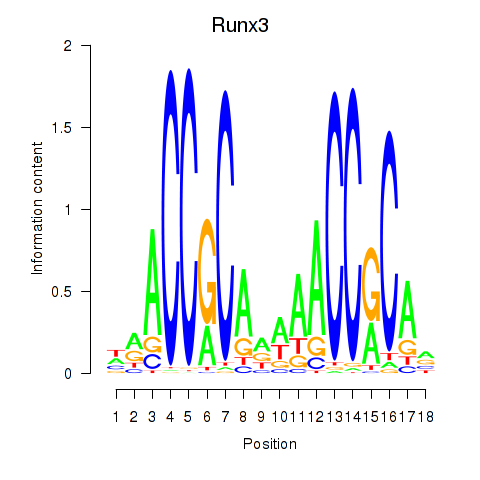
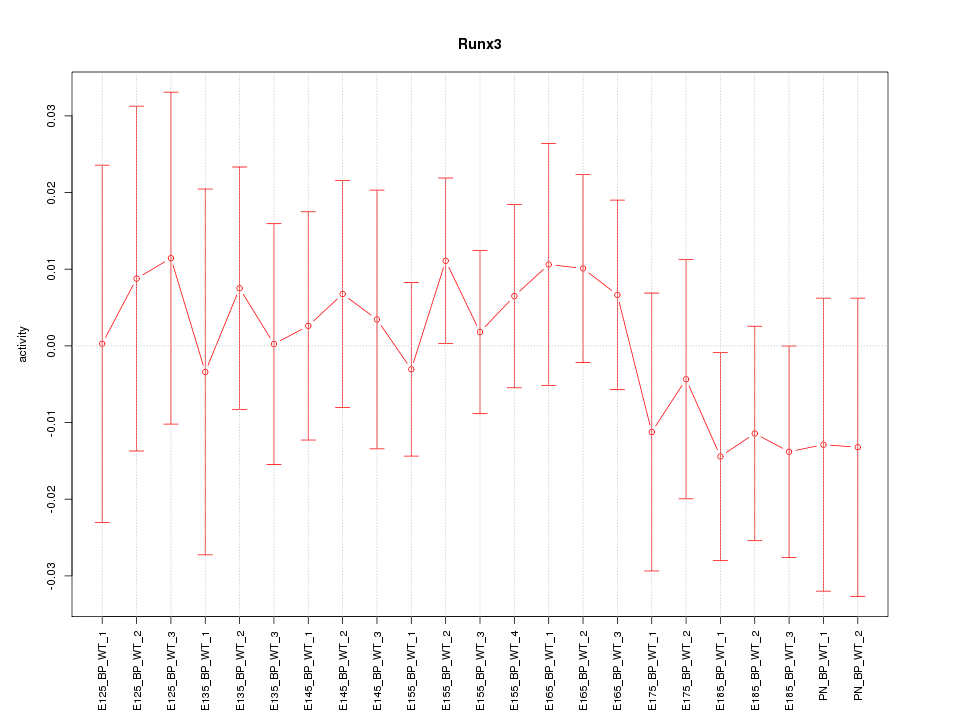
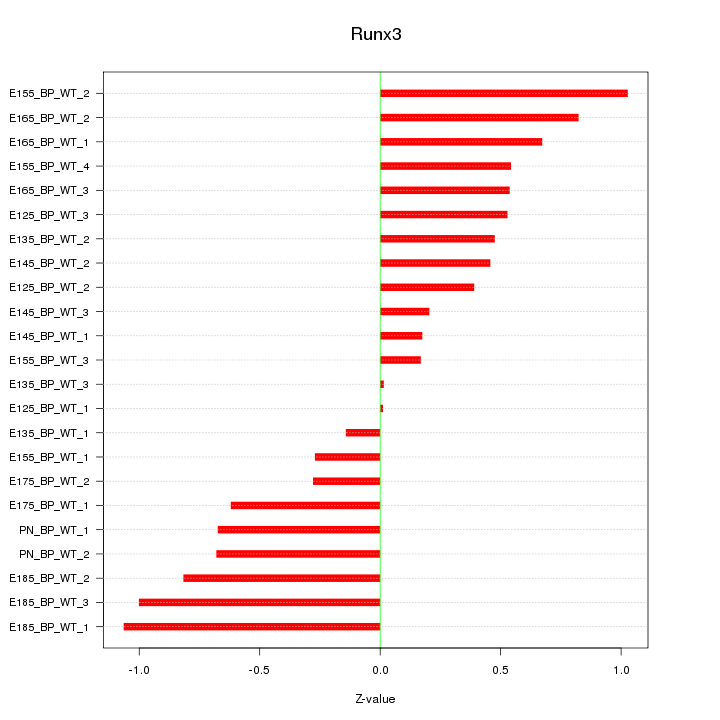
Motif ID: Runx3
Z-value: 0.590
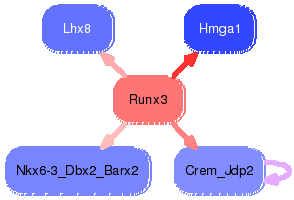
Transcription factors associated with Runx3:
| Gene Symbol | Entrez ID | Gene Name |
|---|---|---|
| Runx3 | ENSMUSG00000070691.4 | Runx3 |

Top targets:
Gene overrepresentation in biological_process category:
| Log-likelihood per target | Total log-likelihood | Term | Description |
|---|---|---|---|
| 0.2 | 3.5 | GO:0045653 | negative regulation of megakaryocyte differentiation(GO:0045653) |
| 0.2 | 1.7 | GO:0030322 | stabilization of membrane potential(GO:0030322) |
| 0.2 | 0.6 | GO:1903378 | positive regulation of oxidative stress-induced neuron intrinsic apoptotic signaling pathway(GO:1903378) |
| 0.2 | 0.6 | GO:2000313 | fibroblast growth factor receptor signaling pathway involved in neural plate anterior/posterior pattern formation(GO:0060825) regulation of fibroblast growth factor receptor signaling pathway involved in neural plate anterior/posterior pattern formation(GO:2000313) |
| 0.1 | 0.6 | GO:0006933 | negative regulation of cell adhesion involved in substrate-bound cell migration(GO:0006933) |
| 0.1 | 0.3 | GO:0090071 | negative regulation of ribosome biogenesis(GO:0090071) |
| 0.1 | 0.8 | GO:0033631 | cell-cell adhesion mediated by integrin(GO:0033631) |
| 0.1 | 0.3 | GO:1900220 | negative regulation of alkaline phosphatase activity(GO:0010693) semaphorin-plexin signaling pathway involved in bone trabecula morphogenesis(GO:1900220) |
| 0.1 | 1.2 | GO:2001224 | positive regulation of neuron migration(GO:2001224) |
| 0.0 | 0.4 | GO:0051409 | response to nitrosative stress(GO:0051409) |
| 0.0 | 2.2 | GO:0006284 | base-excision repair(GO:0006284) |
| 0.0 | 0.3 | GO:1902416 | positive regulation of mRNA binding(GO:1902416) positive regulation of RNA binding(GO:1905216) |
| 0.0 | 0.7 | GO:0031295 | lymphocyte costimulation(GO:0031294) T cell costimulation(GO:0031295) |
| 0.0 | 0.8 | GO:0035873 | lactate transport(GO:0015727) lactate transmembrane transport(GO:0035873) plasma membrane lactate transport(GO:0035879) |
| 0.0 | 0.2 | GO:0001561 | fatty acid alpha-oxidation(GO:0001561) |
| 0.0 | 0.4 | GO:0035269 | protein O-linked mannosylation(GO:0035269) |
| 0.0 | 0.1 | GO:0006083 | acetate metabolic process(GO:0006083) |
| 0.0 | 0.3 | GO:0046036 | CTP biosynthetic process(GO:0006241) CTP metabolic process(GO:0046036) |
| 0.0 | 0.1 | GO:1904491 | protein localization to ciliary transition zone(GO:1904491) |
| 0.0 | 0.1 | GO:0017196 | N-terminal peptidyl-methionine acetylation(GO:0017196) |
| 0.0 | 0.3 | GO:0015693 | magnesium ion transport(GO:0015693) |
| 0.0 | 0.1 | GO:0075525 | viral translational termination-reinitiation(GO:0075525) |
| 0.0 | 0.3 | GO:0060009 | Sertoli cell development(GO:0060009) |
| 0.0 | 0.4 | GO:0071364 | cellular response to epidermal growth factor stimulus(GO:0071364) negative regulation of reactive oxygen species biosynthetic process(GO:1903427) |
| 0.0 | 0.1 | GO:0045541 | negative regulation of cholesterol biosynthetic process(GO:0045541) negative regulation of cholesterol metabolic process(GO:0090206) |
| 0.0 | 0.1 | GO:0018243 | protein O-linked glycosylation via threonine(GO:0018243) |
| 0.0 | 0.1 | GO:2000671 | regulation of motor neuron apoptotic process(GO:2000671) |
| 0.0 | 0.2 | GO:0035020 | regulation of Rac protein signal transduction(GO:0035020) |
| 0.0 | 0.3 | GO:0000028 | ribosomal small subunit assembly(GO:0000028) |
Gene overrepresentation in cellular_component category:
| Log-likelihood per target | Total log-likelihood | Term | Description |
|---|---|---|---|
| 0.3 | 2.2 | GO:0035985 | senescence-associated heterochromatin focus(GO:0035985) |
| 0.1 | 0.4 | GO:0017109 | glutamate-cysteine ligase complex(GO:0017109) |
| 0.1 | 0.6 | GO:0097136 | Bcl-2 family protein complex(GO:0097136) |
| 0.1 | 0.6 | GO:0045261 | mitochondrial proton-transporting ATP synthase complex, catalytic core F(1)(GO:0000275) proton-transporting ATP synthase complex, catalytic core F(1)(GO:0045261) |
| 0.0 | 3.5 | GO:0000786 | nucleosome(GO:0000786) |
| 0.0 | 0.3 | GO:0030677 | nucleolar ribonuclease P complex(GO:0005655) ribonuclease P complex(GO:0030677) multimeric ribonuclease P complex(GO:0030681) |
| 0.0 | 0.5 | GO:0042788 | polysomal ribosome(GO:0042788) |
| 0.0 | 0.1 | GO:0043625 | delta DNA polymerase complex(GO:0043625) |
| 0.0 | 0.2 | GO:0001674 | female germ cell nucleus(GO:0001674) |
| 0.0 | 0.4 | GO:0016010 | dystrophin-associated glycoprotein complex(GO:0016010) glycoprotein complex(GO:0090665) |
| 0.0 | 0.8 | GO:0044295 | axonal growth cone(GO:0044295) |
| 0.0 | 0.3 | GO:0045120 | pronucleus(GO:0045120) |
| 0.0 | 0.5 | GO:0000315 | organellar large ribosomal subunit(GO:0000315) mitochondrial large ribosomal subunit(GO:0005762) |
| 0.0 | 0.1 | GO:0031501 | mannosyltransferase complex(GO:0031501) |
| 0.0 | 0.1 | GO:0031414 | N-terminal protein acetyltransferase complex(GO:0031414) |
| 0.0 | 0.2 | GO:0035327 | transcriptionally active chromatin(GO:0035327) |
Gene overrepresentation in molecular_function category:
| Log-likelihood per target | Total log-likelihood | Term | Description |
|---|---|---|---|
| 0.2 | 2.2 | GO:0051575 | 5'-deoxyribose-5-phosphate lyase activity(GO:0051575) |
| 0.2 | 0.8 | GO:0033691 | sialic acid binding(GO:0033691) |
| 0.2 | 1.7 | GO:0022841 | potassium ion leak channel activity(GO:0022841) |
| 0.1 | 0.4 | GO:0004357 | glutamate-cysteine ligase activity(GO:0004357) |
| 0.1 | 0.6 | GO:0051434 | BH3 domain binding(GO:0051434) |
| 0.1 | 0.4 | GO:0043842 | Kdo transferase activity(GO:0043842) |
| 0.1 | 0.3 | GO:0003883 | CTP synthase activity(GO:0003883) |
| 0.1 | 0.8 | GO:0015129 | lactate transmembrane transporter activity(GO:0015129) |
| 0.0 | 0.1 | GO:0048045 | 4-hydroxybenzoate octaprenyltransferase activity(GO:0008412) protoheme IX farnesyltransferase activity(GO:0008495) (S)-2,3-di-O-geranylgeranylglyceryl phosphate synthase activity(GO:0043888) cadaverine aminopropyltransferase activity(GO:0043918) agmatine aminopropyltransferase activity(GO:0043919) 1,4-dihydroxy-2-naphthoate octaprenyltransferase activity(GO:0046428) trans-pentaprenyltranstransferase activity(GO:0048045) ATP dimethylallyltransferase activity(GO:0052622) ADP dimethylallyltransferase activity(GO:0052623) |
| 0.0 | 0.6 | GO:0046933 | proton-transporting ATP synthase activity, rotational mechanism(GO:0046933) |
| 0.0 | 1.4 | GO:0030215 | semaphorin receptor binding(GO:0030215) |
| 0.0 | 0.3 | GO:0097322 | 7SK snRNA binding(GO:0097322) |
| 0.0 | 0.3 | GO:1990715 | mRNA CDS binding(GO:1990715) |
| 0.0 | 0.3 | GO:0004526 | ribonuclease P activity(GO:0004526) |
| 0.0 | 0.1 | GO:0003987 | acetate-CoA ligase activity(GO:0003987) |
| 0.0 | 0.3 | GO:0070181 | small ribosomal subunit rRNA binding(GO:0070181) |
| 0.0 | 0.2 | GO:0000268 | peroxisome targeting sequence binding(GO:0000268) |
| 0.0 | 1.0 | GO:0046875 | ephrin receptor binding(GO:0046875) |
| 0.0 | 0.3 | GO:0001046 | core promoter sequence-specific DNA binding(GO:0001046) |
| 0.0 | 0.3 | GO:0015095 | magnesium ion transmembrane transporter activity(GO:0015095) |
| 0.0 | 0.3 | GO:0008242 | omega peptidase activity(GO:0008242) |
| 0.0 | 3.1 | GO:0042393 | histone binding(GO:0042393) |
| 0.0 | 0.4 | GO:0003746 | translation elongation factor activity(GO:0003746) |
| 0.0 | 0.1 | GO:0004596 | peptide alpha-N-acetyltransferase activity(GO:0004596) |
| 0.0 | 0.2 | GO:0005313 | L-glutamate transmembrane transporter activity(GO:0005313) |
| 0.0 | 0.1 | GO:0031559 | oxidosqualene cyclase activity(GO:0031559) |