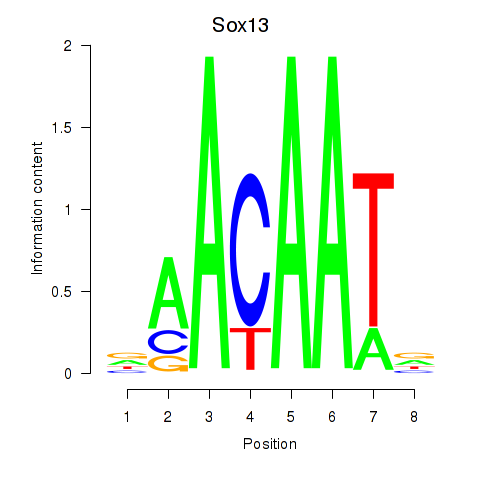
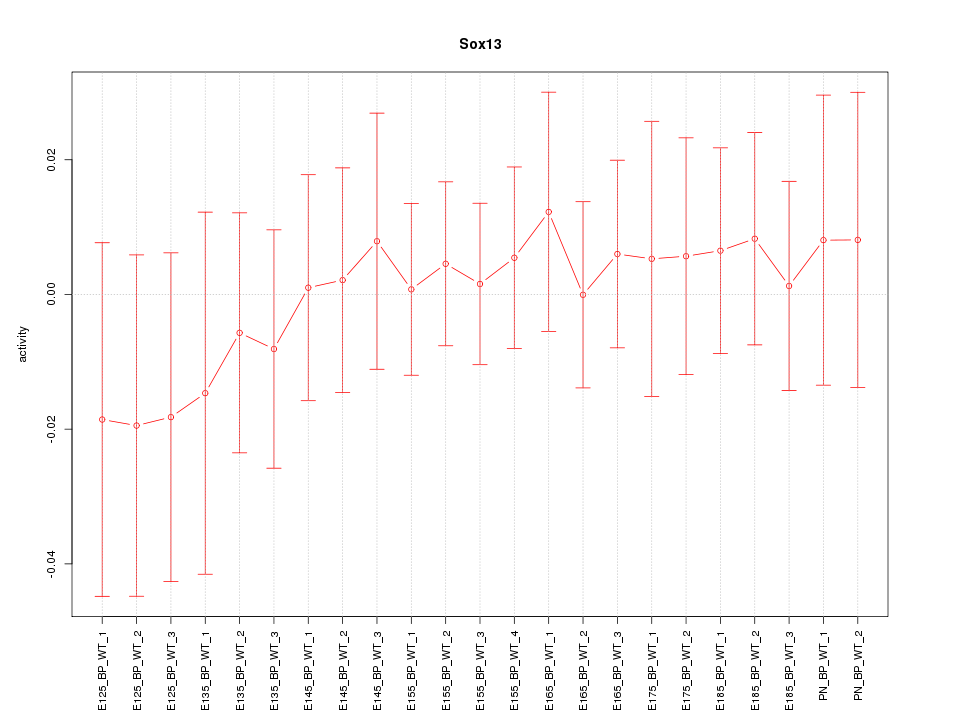
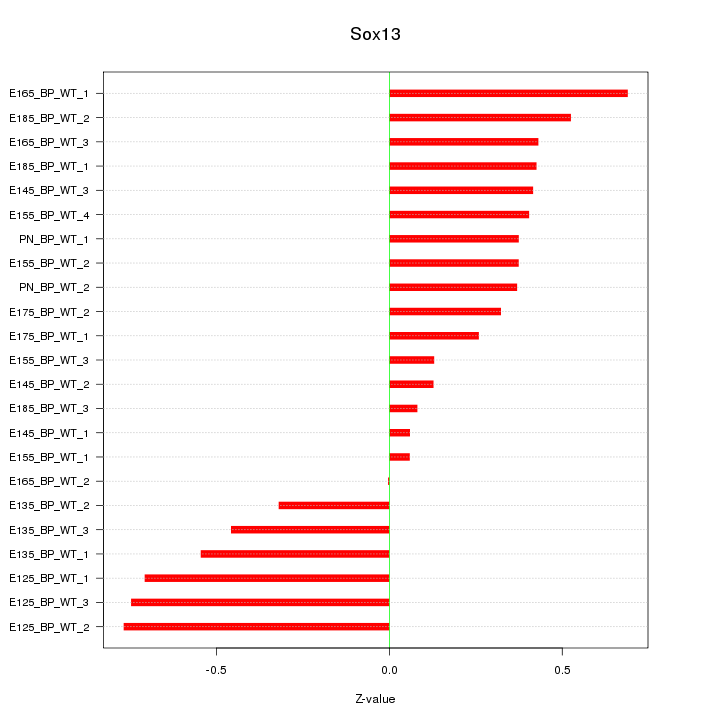
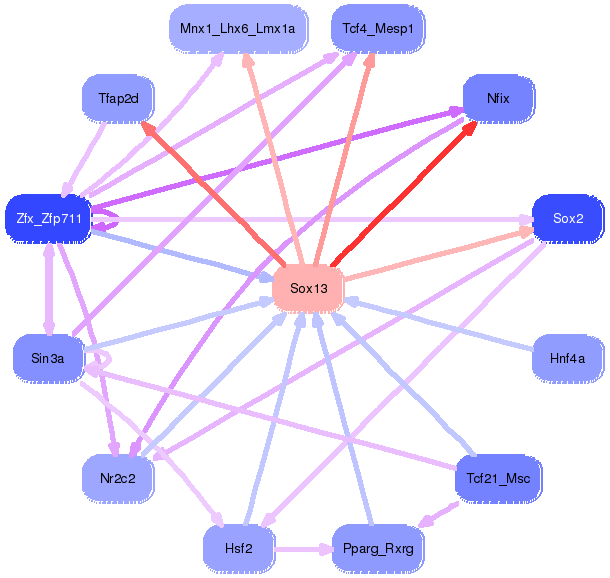
Motif ID: Sox13
Z-value: 0.435
Transcription factors associated with Sox13:
| Gene Symbol | Entrez ID | Gene Name |
|---|---|---|
| Sox13 | ENSMUSG00000070643.5 | Sox13 |
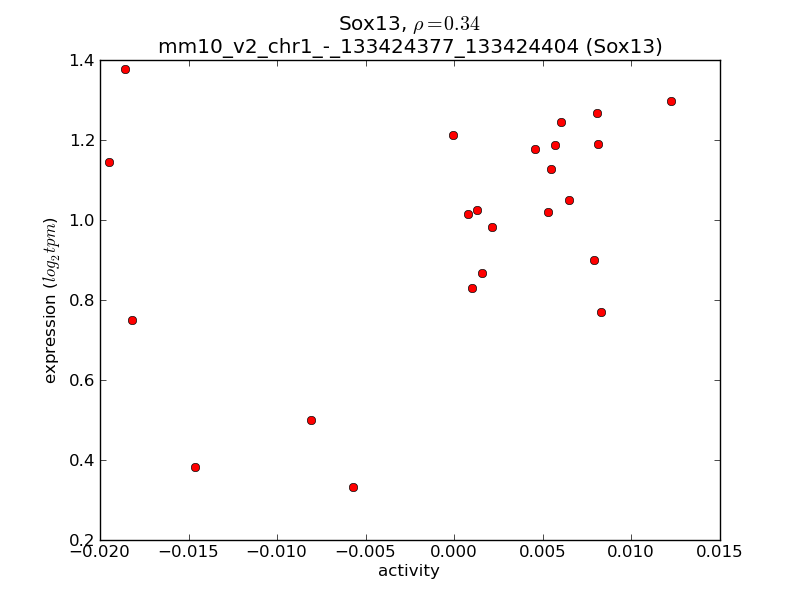
Activity-expression correlation:
| Gene Symbol | Promoter | Pearson corr. coef. | P-value | Plot |
|---|---|---|---|---|
| Sox13 | mm10_v2_chr1_-_133424377_133424404 | 0.34 | 1.1e-01 | Click! |

Top targets:
Gene overrepresentation in biological_process category:
| Log-likelihood per target | Total log-likelihood | Term | Description |
|---|---|---|---|
| 0.7 | 2.8 | GO:0032289 | central nervous system myelin formation(GO:0032289) cardiac cell fate specification(GO:0060912) |
| 0.3 | 4.1 | GO:0021684 | cerebellar granular layer formation(GO:0021684) cerebellar granule cell differentiation(GO:0021707) |
| 0.1 | 0.7 | GO:2001286 | regulation of caveolin-mediated endocytosis(GO:2001286) |
| 0.1 | 1.3 | GO:0042118 | endothelial cell activation(GO:0042118) |
| 0.1 | 0.8 | GO:0060648 | mammary gland bud morphogenesis(GO:0060648) |
| 0.1 | 1.2 | GO:0002903 | negative regulation of B cell apoptotic process(GO:0002903) |
| 0.1 | 1.1 | GO:0014807 | regulation of somitogenesis(GO:0014807) |
| 0.1 | 0.6 | GO:1904936 | cerebral cortex GABAergic interneuron migration(GO:0021853) interneuron migration(GO:1904936) |
| 0.1 | 0.4 | GO:0003192 | mitral valve formation(GO:0003192) cell migration involved in endocardial cushion formation(GO:0003273) condensed mesenchymal cell proliferation(GO:0072137) |
| 0.1 | 0.6 | GO:0071699 | olfactory placode formation(GO:0030910) olfactory placode development(GO:0071698) olfactory placode morphogenesis(GO:0071699) |
| 0.0 | 2.5 | GO:0030901 | midbrain development(GO:0030901) |
| 0.0 | 0.2 | GO:1904425 | negative regulation of GTP binding(GO:1904425) |
| 0.0 | 0.2 | GO:0005513 | detection of calcium ion(GO:0005513) |
| 0.0 | 0.1 | GO:0046549 | retinal cone cell development(GO:0046549) |
| 0.0 | 0.5 | GO:0032292 | myelination in peripheral nervous system(GO:0022011) peripheral nervous system axon ensheathment(GO:0032292) |
| 0.0 | 0.2 | GO:0031937 | positive regulation of chromatin silencing(GO:0031937) |
| 0.0 | 0.1 | GO:0051694 | pointed-end actin filament capping(GO:0051694) |
Gene overrepresentation in cellular_component category:
| Log-likelihood per target | Total log-likelihood | Term | Description |
|---|---|---|---|
| 0.1 | 0.2 | GO:0097629 | extrinsic component of omegasome membrane(GO:0097629) |
| 0.0 | 4.8 | GO:0005667 | transcription factor complex(GO:0005667) |
| 0.0 | 0.7 | GO:0005871 | kinesin complex(GO:0005871) |
Gene overrepresentation in molecular_function category:
| Log-likelihood per target | Total log-likelihood | Term | Description |
|---|---|---|---|
| 0.3 | 1.3 | GO:0001011 | transcription factor activity, sequence-specific DNA binding, RNA polymerase recruiting(GO:0001011) transcription factor activity, TFIIB-class binding(GO:0001087) |
| 0.1 | 0.7 | GO:0019871 | potassium channel inhibitor activity(GO:0019870) sodium channel inhibitor activity(GO:0019871) |
| 0.1 | 0.3 | GO:0001069 | regulatory region RNA binding(GO:0001069) |
| 0.0 | 0.1 | GO:0008502 | melatonin receptor activity(GO:0008502) |
| 0.0 | 0.6 | GO:0035198 | miRNA binding(GO:0035198) |
| 0.0 | 1.2 | GO:0071889 | 14-3-3 protein binding(GO:0071889) |
| 0.0 | 0.1 | GO:0004111 | creatine kinase activity(GO:0004111) |
| 0.0 | 0.2 | GO:0015269 | calcium-activated potassium channel activity(GO:0015269) |
| 0.0 | 0.7 | GO:0003777 | microtubule motor activity(GO:0003777) |
| 0.0 | 4.5 | GO:0001228 | transcriptional activator activity, RNA polymerase II transcription regulatory region sequence-specific binding(GO:0001228) |