| 4.5 |
13.4 |
GO:0048686 |
regulation of sprouting of injured axon(GO:0048686) regulation of axon extension involved in regeneration(GO:0048690) |
| 4.3 |
8.6 |
GO:0072223 |
metanephric glomerular mesangium development(GO:0072223) metanephric glomerular mesangial cell proliferation involved in metanephros development(GO:0072262) |
| 4.3 |
12.8 |
GO:0015910 |
peroxisomal long-chain fatty acid import(GO:0015910) |
| 4.1 |
12.3 |
GO:0030421 |
defecation(GO:0030421) |
| 3.9 |
15.8 |
GO:2000525 |
regulation of T cell costimulation(GO:2000523) positive regulation of T cell costimulation(GO:2000525) |
| 3.9 |
27.4 |
GO:0060762 |
regulation of branching involved in mammary gland duct morphogenesis(GO:0060762) |
| 3.3 |
13.2 |
GO:0044268 |
multicellular organismal protein metabolic process(GO:0044268) |
| 3.1 |
9.4 |
GO:0072034 |
renal vesicle induction(GO:0072034) |
| 3.0 |
11.9 |
GO:0016340 |
calcium-dependent cell-matrix adhesion(GO:0016340) |
| 2.9 |
8.7 |
GO:0043696 |
dedifferentiation(GO:0043696) cell dedifferentiation(GO:0043697) |
| 2.9 |
8.6 |
GO:0021837 |
motogenic signaling involved in postnatal olfactory bulb interneuron migration(GO:0021837) positive regulation of mitotic cell cycle DNA replication(GO:1903465) |
| 2.8 |
11.0 |
GO:0043490 |
malate-aspartate shuttle(GO:0043490) |
| 2.6 |
10.3 |
GO:0043974 |
histone H3-K27 acetylation(GO:0043974) regulation of histone H3-K27 acetylation(GO:1901674) |
| 2.6 |
10.2 |
GO:0031284 |
positive regulation of guanylate cyclase activity(GO:0031284) |
| 2.5 |
7.6 |
GO:0032765 |
positive regulation of mast cell cytokine production(GO:0032765) |
| 2.4 |
7.2 |
GO:0009405 |
pathogenesis(GO:0009405) |
| 2.4 |
12.0 |
GO:0010991 |
negative regulation of SMAD protein complex assembly(GO:0010991) |
| 2.4 |
2.4 |
GO:0002035 |
brain renin-angiotensin system(GO:0002035) |
| 2.4 |
7.1 |
GO:0018103 |
protein C-linked glycosylation(GO:0018103) peptidyl-tryptophan modification(GO:0018211) protein C-linked glycosylation via tryptophan(GO:0018317) protein C-linked glycosylation via 2'-alpha-mannosyl-L-tryptophan(GO:0018406) |
| 2.4 |
2.4 |
GO:0060693 |
regulation of branching involved in salivary gland morphogenesis(GO:0060693) |
| 2.3 |
16.3 |
GO:0090336 |
positive regulation of brown fat cell differentiation(GO:0090336) |
| 2.3 |
9.2 |
GO:0072235 |
distal convoluted tubule development(GO:0072025) DCT cell differentiation(GO:0072069) metanephric distal convoluted tubule development(GO:0072221) metanephric distal tubule development(GO:0072235) metanephric DCT cell differentiation(GO:0072240) |
| 2.3 |
9.1 |
GO:0032489 |
regulation of Cdc42 protein signal transduction(GO:0032489) |
| 2.2 |
2.2 |
GO:1901420 |
negative regulation of response to alcohol(GO:1901420) |
| 2.2 |
6.7 |
GO:0097155 |
fasciculation of sensory neuron axon(GO:0097155) |
| 2.2 |
6.6 |
GO:0043988 |
histone H3-S28 phosphorylation(GO:0043988) |
| 2.2 |
6.5 |
GO:1904049 |
regulation of spontaneous neurotransmitter secretion(GO:1904048) negative regulation of spontaneous neurotransmitter secretion(GO:1904049) |
| 2.1 |
17.1 |
GO:0048625 |
myoblast fate commitment(GO:0048625) |
| 2.1 |
17.0 |
GO:0032429 |
regulation of phospholipase A2 activity(GO:0032429) |
| 2.1 |
10.4 |
GO:0015871 |
choline transport(GO:0015871) |
| 2.0 |
6.1 |
GO:0042939 |
glutathione transport(GO:0034635) tripeptide transport(GO:0042939) |
| 2.0 |
2.0 |
GO:0032918 |
polyamine acetylation(GO:0032917) spermidine acetylation(GO:0032918) |
| 2.0 |
2.0 |
GO:0072554 |
blood vessel lumenization(GO:0072554) |
| 2.0 |
2.0 |
GO:0007521 |
muscle cell fate determination(GO:0007521) |
| 1.9 |
1.9 |
GO:0060032 |
notochord regression(GO:0060032) |
| 1.9 |
5.7 |
GO:0006601 |
creatine biosynthetic process(GO:0006601) |
| 1.9 |
7.6 |
GO:2000427 |
positive regulation of apoptotic cell clearance(GO:2000427) |
| 1.9 |
5.7 |
GO:0030827 |
negative regulation of cGMP metabolic process(GO:0030824) negative regulation of cGMP biosynthetic process(GO:0030827) negative regulation of guanylate cyclase activity(GO:0031283) |
| 1.9 |
7.4 |
GO:1903977 |
positive regulation of glial cell migration(GO:1903977) |
| 1.8 |
1.8 |
GO:0071880 |
adenylate cyclase-activating adrenergic receptor signaling pathway(GO:0071880) |
| 1.8 |
5.5 |
GO:0061153 |
trachea submucosa development(GO:0061152) trachea gland development(GO:0061153) |
| 1.8 |
1.8 |
GO:0070278 |
extracellular matrix constituent secretion(GO:0070278) |
| 1.8 |
7.3 |
GO:0006867 |
asparagine transport(GO:0006867) glutamine transport(GO:0006868) |
| 1.8 |
8.9 |
GO:0060178 |
regulation of exocyst localization(GO:0060178) |
| 1.8 |
8.8 |
GO:0042997 |
negative regulation of Golgi to plasma membrane protein transport(GO:0042997) |
| 1.8 |
1.8 |
GO:0090191 |
negative regulation of branching involved in ureteric bud morphogenesis(GO:0090191) |
| 1.7 |
5.2 |
GO:0032513 |
negative regulation of protein phosphatase type 2B activity(GO:0032513) |
| 1.7 |
5.2 |
GO:0003349 |
epicardium-derived cardiac endothelial cell differentiation(GO:0003349) |
| 1.7 |
1.7 |
GO:0090083 |
regulation of inclusion body assembly(GO:0090083) |
| 1.7 |
1.7 |
GO:0060948 |
cardiac vascular smooth muscle cell development(GO:0060948) |
| 1.7 |
5.2 |
GO:0036091 |
positive regulation of transcription from RNA polymerase II promoter in response to oxidative stress(GO:0036091) |
| 1.7 |
5.2 |
GO:0038165 |
oncostatin-M-mediated signaling pathway(GO:0038165) |
| 1.7 |
5.1 |
GO:0046881 |
positive regulation of follicle-stimulating hormone secretion(GO:0046881) |
| 1.7 |
13.7 |
GO:0016338 |
calcium-independent cell-cell adhesion via plasma membrane cell-adhesion molecules(GO:0016338) |
| 1.7 |
3.4 |
GO:0003289 |
atrial septum primum morphogenesis(GO:0003289) |
| 1.7 |
5.1 |
GO:0003357 |
noradrenergic neuron differentiation(GO:0003357) |
| 1.7 |
8.3 |
GO:1900170 |
negative regulation of glucocorticoid mediated signaling pathway(GO:1900170) |
| 1.6 |
6.6 |
GO:0036006 |
response to macrophage colony-stimulating factor(GO:0036005) cellular response to macrophage colony-stimulating factor stimulus(GO:0036006) |
| 1.6 |
4.9 |
GO:0090271 |
positive regulation of fibroblast growth factor production(GO:0090271) |
| 1.6 |
9.8 |
GO:0003383 |
apical constriction(GO:0003383) |
| 1.6 |
6.4 |
GO:1904398 |
positive regulation of neuromuscular junction development(GO:1904398) |
| 1.6 |
1.6 |
GO:0042420 |
dopamine catabolic process(GO:0042420) |
| 1.6 |
6.3 |
GO:2000048 |
negative regulation of cell-cell adhesion mediated by cadherin(GO:2000048) |
| 1.6 |
3.2 |
GO:0034380 |
high-density lipoprotein particle assembly(GO:0034380) |
| 1.6 |
4.7 |
GO:0014809 |
regulation of skeletal muscle contraction by regulation of release of sequestered calcium ion(GO:0014809) |
| 1.6 |
7.8 |
GO:0070327 |
thyroid hormone transport(GO:0070327) |
| 1.6 |
4.7 |
GO:0001951 |
intestinal D-glucose absorption(GO:0001951) terminal web assembly(GO:1902896) |
| 1.6 |
24.8 |
GO:0021902 |
commitment of neuronal cell to specific neuron type in forebrain(GO:0021902) |
| 1.5 |
12.3 |
GO:0038028 |
insulin receptor signaling pathway via phosphatidylinositol 3-kinase(GO:0038028) |
| 1.5 |
9.1 |
GO:0048934 |
peripheral nervous system neuron differentiation(GO:0048934) peripheral nervous system neuron development(GO:0048935) |
| 1.5 |
4.6 |
GO:0032808 |
lacrimal gland development(GO:0032808) |
| 1.5 |
9.1 |
GO:0046549 |
retinal cone cell development(GO:0046549) |
| 1.5 |
4.5 |
GO:0046168 |
glycerol-3-phosphate catabolic process(GO:0046168) |
| 1.5 |
1.5 |
GO:0060129 |
thyroid-stimulating hormone-secreting cell differentiation(GO:0060129) |
| 1.5 |
7.4 |
GO:0010668 |
ectodermal cell differentiation(GO:0010668) |
| 1.5 |
1.5 |
GO:0035413 |
positive regulation of catenin import into nucleus(GO:0035413) |
| 1.5 |
4.5 |
GO:0051933 |
amino acid neurotransmitter reuptake(GO:0051933) glutamate reuptake(GO:0051935) |
| 1.5 |
1.5 |
GO:0070094 |
positive regulation of glucagon secretion(GO:0070094) |
| 1.5 |
13.3 |
GO:0042118 |
endothelial cell activation(GO:0042118) |
| 1.5 |
5.9 |
GO:1903416 |
response to glycoside(GO:1903416) |
| 1.5 |
17.7 |
GO:0055003 |
cardiac myofibril assembly(GO:0055003) |
| 1.5 |
2.9 |
GO:0045607 |
regulation of auditory receptor cell differentiation(GO:0045607) regulation of mechanoreceptor differentiation(GO:0045631) regulation of inner ear receptor cell differentiation(GO:2000980) |
| 1.5 |
7.3 |
GO:0007021 |
tubulin complex assembly(GO:0007021) |
| 1.5 |
7.3 |
GO:0034441 |
plasma lipoprotein particle oxidation(GO:0034441) |
| 1.5 |
5.8 |
GO:0070384 |
Harderian gland development(GO:0070384) |
| 1.4 |
5.8 |
GO:1904936 |
cerebral cortex GABAergic interneuron migration(GO:0021853) interneuron migration(GO:1904936) |
| 1.4 |
4.3 |
GO:1902837 |
amino acid import into cell(GO:1902837) |
| 1.4 |
7.2 |
GO:0048549 |
positive regulation of pinocytosis(GO:0048549) |
| 1.4 |
10.0 |
GO:1902669 |
positive regulation of axon extension involved in axon guidance(GO:0048842) positive regulation of axon guidance(GO:1902669) |
| 1.4 |
5.7 |
GO:0021564 |
glossopharyngeal nerve development(GO:0021563) vagus nerve development(GO:0021564) |
| 1.4 |
5.7 |
GO:0031581 |
hemidesmosome assembly(GO:0031581) |
| 1.4 |
10.0 |
GO:0071699 |
olfactory placode formation(GO:0030910) olfactory placode development(GO:0071698) olfactory placode morphogenesis(GO:0071699) |
| 1.4 |
4.3 |
GO:0051542 |
elastin biosynthetic process(GO:0051542) |
| 1.4 |
5.6 |
GO:0035989 |
tendon development(GO:0035989) |
| 1.4 |
4.2 |
GO:0002447 |
eosinophil activation involved in immune response(GO:0002278) eosinophil mediated immunity(GO:0002447) eosinophil degranulation(GO:0043308) |
| 1.4 |
1.4 |
GO:0001941 |
postsynaptic membrane organization(GO:0001941) |
| 1.4 |
5.6 |
GO:0097298 |
regulation of nucleus size(GO:0097298) |
| 1.4 |
4.2 |
GO:1902460 |
regulation of mesenchymal stem cell proliferation(GO:1902460) positive regulation of mesenchymal stem cell proliferation(GO:1902462) |
| 1.4 |
4.2 |
GO:1902083 |
negative regulation of peptidyl-cysteine S-nitrosylation(GO:1902083) |
| 1.4 |
4.1 |
GO:0048382 |
neural plate mediolateral regionalization(GO:0021998) mesoderm structural organization(GO:0048338) paraxial mesoderm structural organization(GO:0048352) lateral mesodermal cell fate commitment(GO:0048372) lateral mesodermal cell fate specification(GO:0048377) regulation of lateral mesodermal cell fate specification(GO:0048378) mesendoderm development(GO:0048382) |
| 1.4 |
5.5 |
GO:0007066 |
female meiosis sister chromatid cohesion(GO:0007066) |
| 1.4 |
4.1 |
GO:1904177 |
regulation of adipose tissue development(GO:1904177) |
| 1.4 |
1.4 |
GO:0032570 |
response to progesterone(GO:0032570) |
| 1.4 |
8.2 |
GO:0003273 |
cell migration involved in endocardial cushion formation(GO:0003273) |
| 1.4 |
8.2 |
GO:0036444 |
calcium ion transmembrane import into mitochondrion(GO:0036444) |
| 1.3 |
2.7 |
GO:0098528 |
skeletal muscle fiber differentiation(GO:0098528) |
| 1.3 |
1.3 |
GO:0042160 |
lipoprotein modification(GO:0042160) lipoprotein oxidation(GO:0042161) |
| 1.3 |
5.3 |
GO:0009597 |
detection of virus(GO:0009597) |
| 1.3 |
2.7 |
GO:0042908 |
xenobiotic transport(GO:0042908) |
| 1.3 |
6.6 |
GO:0030205 |
dermatan sulfate metabolic process(GO:0030205) |
| 1.3 |
6.6 |
GO:0030643 |
cellular phosphate ion homeostasis(GO:0030643) cellular trivalent inorganic anion homeostasis(GO:0072502) |
| 1.3 |
5.3 |
GO:0007039 |
protein catabolic process in the vacuole(GO:0007039) |
| 1.3 |
11.7 |
GO:0031339 |
negative regulation of vesicle fusion(GO:0031339) |
| 1.3 |
1.3 |
GO:0044340 |
canonical Wnt signaling pathway involved in regulation of cell proliferation(GO:0044340) |
| 1.3 |
3.9 |
GO:0019074 |
viral genome packaging(GO:0019072) viral RNA genome packaging(GO:0019074) |
| 1.3 |
5.2 |
GO:2000795 |
negative regulation of epithelial cell proliferation involved in lung morphogenesis(GO:2000795) |
| 1.3 |
1.3 |
GO:0043465 |
regulation of fermentation(GO:0043465) negative regulation of fermentation(GO:1901003) |
| 1.3 |
3.9 |
GO:0018214 |
peptidyl-glutamic acid carboxylation(GO:0017187) protein carboxylation(GO:0018214) |
| 1.3 |
2.5 |
GO:0021814 |
cell motility involved in cerebral cortex radial glia guided migration(GO:0021814) |
| 1.3 |
7.5 |
GO:0050861 |
positive regulation of B cell receptor signaling pathway(GO:0050861) |
| 1.2 |
7.5 |
GO:0032483 |
regulation of Rab protein signal transduction(GO:0032483) |
| 1.2 |
6.2 |
GO:0070305 |
response to cGMP(GO:0070305) cellular response to cGMP(GO:0071321) |
| 1.2 |
3.7 |
GO:2000598 |
regulation of cyclin catabolic process(GO:2000598) negative regulation of cyclin catabolic process(GO:2000599) |
| 1.2 |
6.1 |
GO:0051684 |
maintenance of Golgi location(GO:0051684) |
| 1.2 |
4.9 |
GO:1903288 |
regulation of potassium ion import(GO:1903286) positive regulation of potassium ion import(GO:1903288) |
| 1.2 |
7.3 |
GO:0001542 |
ovulation from ovarian follicle(GO:0001542) |
| 1.2 |
8.5 |
GO:0060638 |
mesenchymal-epithelial cell signaling(GO:0060638) |
| 1.2 |
1.2 |
GO:0048597 |
post-embryonic camera-type eye morphogenesis(GO:0048597) |
| 1.2 |
3.6 |
GO:0000710 |
meiotic mismatch repair(GO:0000710) |
| 1.2 |
3.6 |
GO:0021893 |
cerebral cortex GABAergic interneuron fate commitment(GO:0021893) |
| 1.2 |
4.8 |
GO:0071475 |
cellular hyperosmotic salinity response(GO:0071475) |
| 1.2 |
1.2 |
GO:0061054 |
dermatome development(GO:0061054) regulation of dermatome development(GO:0061183) |
| 1.2 |
4.7 |
GO:0045054 |
constitutive secretory pathway(GO:0045054) |
| 1.2 |
4.7 |
GO:1902894 |
negative regulation of pri-miRNA transcription from RNA polymerase II promoter(GO:1902894) |
| 1.2 |
3.5 |
GO:0007210 |
serotonin receptor signaling pathway(GO:0007210) |
| 1.2 |
3.5 |
GO:0060854 |
patterning of lymph vessels(GO:0060854) |
| 1.2 |
16.4 |
GO:0032793 |
positive regulation of CREB transcription factor activity(GO:0032793) |
| 1.2 |
7.0 |
GO:0044331 |
cell-cell adhesion mediated by cadherin(GO:0044331) |
| 1.2 |
5.8 |
GO:0070100 |
negative regulation of chemokine-mediated signaling pathway(GO:0070100) |
| 1.2 |
3.5 |
GO:0034162 |
toll-like receptor 9 signaling pathway(GO:0034162) |
| 1.1 |
4.5 |
GO:2000054 |
negative regulation of Wnt signaling pathway involved in dorsal/ventral axis specification(GO:2000054) |
| 1.1 |
3.4 |
GO:0010701 |
positive regulation of norepinephrine secretion(GO:0010701) |
| 1.1 |
3.4 |
GO:0090403 |
oxidative stress-induced premature senescence(GO:0090403) positive regulation of skeletal muscle cell differentiation(GO:2001016) |
| 1.1 |
7.9 |
GO:0007342 |
fusion of sperm to egg plasma membrane(GO:0007342) |
| 1.1 |
3.4 |
GO:0050925 |
negative regulation of negative chemotaxis(GO:0050925) |
| 1.1 |
7.9 |
GO:0016480 |
negative regulation of transcription from RNA polymerase III promoter(GO:0016480) |
| 1.1 |
5.5 |
GO:0007256 |
activation of JNKK activity(GO:0007256) |
| 1.1 |
2.2 |
GO:1902263 |
apoptotic process involved in embryonic digit morphogenesis(GO:1902263) |
| 1.1 |
1.1 |
GO:1901897 |
regulation of relaxation of cardiac muscle(GO:1901897) |
| 1.1 |
15.4 |
GO:0009437 |
carnitine metabolic process(GO:0009437) |
| 1.1 |
7.7 |
GO:0021775 |
smoothened signaling pathway involved in ventral spinal cord interneuron specification(GO:0021775) smoothened signaling pathway involved in spinal cord motor neuron cell fate specification(GO:0021776) |
| 1.1 |
5.5 |
GO:0071285 |
cellular response to lithium ion(GO:0071285) |
| 1.1 |
1.1 |
GO:0021523 |
somatic motor neuron differentiation(GO:0021523) |
| 1.1 |
12.0 |
GO:1902459 |
positive regulation of stem cell population maintenance(GO:1902459) |
| 1.1 |
6.5 |
GO:0038089 |
positive regulation of cell migration by vascular endothelial growth factor signaling pathway(GO:0038089) |
| 1.1 |
1.1 |
GO:0035672 |
oligopeptide transmembrane transport(GO:0035672) |
| 1.1 |
6.5 |
GO:0035743 |
CD4-positive, alpha-beta T cell cytokine production(GO:0035743) T-helper 2 cell cytokine production(GO:0035745) |
| 1.1 |
5.3 |
GO:0032911 |
negative regulation of transforming growth factor beta1 production(GO:0032911) |
| 1.1 |
3.2 |
GO:0019482 |
beta-alanine metabolic process(GO:0019482) |
| 1.1 |
7.4 |
GO:0007195 |
adenylate cyclase-inhibiting dopamine receptor signaling pathway(GO:0007195) |
| 1.0 |
1.0 |
GO:0006478 |
peptidyl-tyrosine sulfation(GO:0006478) |
| 1.0 |
3.1 |
GO:1902528 |
regulation of protein linear polyubiquitination(GO:1902528) positive regulation of protein linear polyubiquitination(GO:1902530) |
| 1.0 |
5.1 |
GO:0046208 |
spermine catabolic process(GO:0046208) |
| 1.0 |
3.1 |
GO:0051045 |
negative regulation of membrane protein ectodomain proteolysis(GO:0051045) |
| 1.0 |
2.0 |
GO:0036515 |
serotonergic neuron axon guidance(GO:0036515) |
| 1.0 |
3.0 |
GO:0061743 |
motor learning(GO:0061743) |
| 1.0 |
6.0 |
GO:0042756 |
drinking behavior(GO:0042756) |
| 1.0 |
8.8 |
GO:0021869 |
forebrain ventricular zone progenitor cell division(GO:0021869) |
| 1.0 |
2.9 |
GO:0060489 |
establishment of body hair or bristle planar orientation(GO:0048104) establishment of body hair planar orientation(GO:0048105) orthogonal dichotomous subdivision of terminal units involved in lung branching morphogenesis(GO:0060488) planar dichotomous subdivision of terminal units involved in lung branching morphogenesis(GO:0060489) lateral sprouting involved in lung morphogenesis(GO:0060490) |
| 1.0 |
2.9 |
GO:0034447 |
very-low-density lipoprotein particle clearance(GO:0034447) |
| 1.0 |
1.0 |
GO:0003278 |
apoptotic process involved in heart morphogenesis(GO:0003278) |
| 1.0 |
6.7 |
GO:0072321 |
chaperone-mediated protein transport(GO:0072321) |
| 1.0 |
6.7 |
GO:0016127 |
cholesterol catabolic process(GO:0006707) sterol catabolic process(GO:0016127) |
| 0.9 |
4.7 |
GO:0051182 |
coenzyme transport(GO:0051182) |
| 0.9 |
6.6 |
GO:0014053 |
negative regulation of gamma-aminobutyric acid secretion(GO:0014053) |
| 0.9 |
3.8 |
GO:0071449 |
cellular response to lipid hydroperoxide(GO:0071449) |
| 0.9 |
2.8 |
GO:0035641 |
locomotory exploration behavior(GO:0035641) |
| 0.9 |
1.9 |
GO:1905005 |
regulation of epithelial to mesenchymal transition involved in endocardial cushion formation(GO:1905005) |
| 0.9 |
4.6 |
GO:0034183 |
negative regulation of maintenance of sister chromatid cohesion(GO:0034092) negative regulation of maintenance of mitotic sister chromatid cohesion(GO:0034183) maintenance of mitotic sister chromatid cohesion, telomeric(GO:0099403) mitotic sister chromatid cohesion, telomeric(GO:0099404) regulation of maintenance of mitotic sister chromatid cohesion, telomeric(GO:1904907) negative regulation of maintenance of mitotic sister chromatid cohesion, telomeric(GO:1904908) |
| 0.9 |
6.4 |
GO:0035881 |
amacrine cell differentiation(GO:0035881) |
| 0.9 |
6.4 |
GO:0015862 |
uridine transport(GO:0015862) |
| 0.9 |
5.5 |
GO:0043383 |
negative T cell selection(GO:0043383) negative thymic T cell selection(GO:0045060) |
| 0.9 |
0.9 |
GO:0035234 |
ectopic germ cell programmed cell death(GO:0035234) |
| 0.9 |
2.7 |
GO:0035928 |
rRNA import into mitochondrion(GO:0035928) |
| 0.9 |
11.9 |
GO:0034497 |
protein localization to pre-autophagosomal structure(GO:0034497) |
| 0.9 |
1.8 |
GO:0048341 |
paraxial mesoderm formation(GO:0048341) |
| 0.9 |
9.1 |
GO:1900103 |
positive regulation of endoplasmic reticulum unfolded protein response(GO:1900103) |
| 0.9 |
7.3 |
GO:0015812 |
gamma-aminobutyric acid transport(GO:0015812) |
| 0.9 |
2.7 |
GO:0072425 |
signal transduction involved in G2 DNA damage checkpoint(GO:0072425) signal transduction involved in mitotic G2 DNA damage checkpoint(GO:0072434) |
| 0.9 |
9.9 |
GO:0032967 |
positive regulation of collagen biosynthetic process(GO:0032967) |
| 0.9 |
3.6 |
GO:0010891 |
negative regulation of sequestering of triglyceride(GO:0010891) |
| 0.9 |
8.1 |
GO:0060059 |
embryonic retina morphogenesis in camera-type eye(GO:0060059) |
| 0.9 |
4.5 |
GO:0031022 |
nuclear migration along microfilament(GO:0031022) |
| 0.9 |
3.6 |
GO:0051964 |
negative regulation of synapse assembly(GO:0051964) |
| 0.9 |
1.8 |
GO:0072337 |
modified amino acid transport(GO:0072337) |
| 0.9 |
0.9 |
GO:0048861 |
leukemia inhibitory factor signaling pathway(GO:0048861) |
| 0.9 |
2.7 |
GO:0006931 |
substrate-dependent cell migration, cell attachment to substrate(GO:0006931) |
| 0.9 |
18.6 |
GO:0046033 |
AMP metabolic process(GO:0046033) |
| 0.9 |
12.4 |
GO:0021859 |
pyramidal neuron differentiation(GO:0021859) |
| 0.9 |
0.9 |
GO:0039536 |
negative regulation of RIG-I signaling pathway(GO:0039536) |
| 0.9 |
1.8 |
GO:0070602 |
positive regulation of branching involved in lung morphogenesis(GO:0061047) regulation of centromeric sister chromatid cohesion(GO:0070602) |
| 0.9 |
0.9 |
GO:0035934 |
corticosterone secretion(GO:0035934) |
| 0.9 |
1.7 |
GO:0071677 |
positive regulation of mononuclear cell migration(GO:0071677) |
| 0.9 |
1.7 |
GO:0060872 |
semicircular canal development(GO:0060872) |
| 0.9 |
1.7 |
GO:0060971 |
embryonic heart tube left/right pattern formation(GO:0060971) |
| 0.9 |
2.6 |
GO:0019433 |
triglyceride catabolic process(GO:0019433) |
| 0.9 |
4.3 |
GO:0072368 |
regulation of lipid transport by negative regulation of transcription from RNA polymerase II promoter(GO:0072368) |
| 0.9 |
0.9 |
GO:0099515 |
actin filament-based transport(GO:0099515) |
| 0.9 |
0.9 |
GO:0039519 |
modulation by virus of host autophagy(GO:0039519) |
| 0.8 |
3.4 |
GO:0014866 |
skeletal myofibril assembly(GO:0014866) |
| 0.8 |
2.5 |
GO:0060708 |
spongiotrophoblast differentiation(GO:0060708) |
| 0.8 |
2.5 |
GO:0061043 |
regulation of vascular wound healing(GO:0061043) |
| 0.8 |
3.4 |
GO:0000255 |
allantoin metabolic process(GO:0000255) |
| 0.8 |
2.5 |
GO:0045084 |
positive regulation of interleukin-12 biosynthetic process(GO:0045084) |
| 0.8 |
3.3 |
GO:0036015 |
response to interleukin-3(GO:0036015) cellular response to interleukin-3(GO:0036016) |
| 0.8 |
3.3 |
GO:0030202 |
heparin metabolic process(GO:0030202) |
| 0.8 |
3.3 |
GO:0035609 |
C-terminal protein deglutamylation(GO:0035609) |
| 0.8 |
4.2 |
GO:0015803 |
branched-chain amino acid transport(GO:0015803) leucine transport(GO:0015820) |
| 0.8 |
4.2 |
GO:0038032 |
termination of G-protein coupled receptor signaling pathway(GO:0038032) |
| 0.8 |
2.5 |
GO:0060712 |
spongiotrophoblast layer development(GO:0060712) |
| 0.8 |
4.9 |
GO:0010624 |
regulation of Schwann cell proliferation(GO:0010624) |
| 0.8 |
2.5 |
GO:0021546 |
rhombomere development(GO:0021546) |
| 0.8 |
4.1 |
GO:2000680 |
regulation of rubidium ion transport(GO:2000680) |
| 0.8 |
13.0 |
GO:0009950 |
dorsal/ventral axis specification(GO:0009950) |
| 0.8 |
2.4 |
GO:0046340 |
diacylglycerol catabolic process(GO:0046340) |
| 0.8 |
8.1 |
GO:0032000 |
positive regulation of fatty acid beta-oxidation(GO:0032000) |
| 0.8 |
0.8 |
GO:0051823 |
regulation of synapse structural plasticity(GO:0051823) |
| 0.8 |
4.8 |
GO:1903056 |
regulation of lens fiber cell differentiation(GO:1902746) positive regulation of lens fiber cell differentiation(GO:1902748) regulation of melanosome organization(GO:1903056) |
| 0.8 |
2.4 |
GO:0051342 |
regulation of cyclic-nucleotide phosphodiesterase activity(GO:0051342) negative regulation of cyclic-nucleotide phosphodiesterase activity(GO:0051344) |
| 0.8 |
0.8 |
GO:0061113 |
pancreas morphogenesis(GO:0061113) |
| 0.8 |
8.0 |
GO:1901339 |
regulation of store-operated calcium channel activity(GO:1901339) |
| 0.8 |
4.0 |
GO:0097343 |
ripoptosome assembly(GO:0097343) ripoptosome assembly involved in necroptotic process(GO:1901026) |
| 0.8 |
5.5 |
GO:0061092 |
regulation of phospholipid translocation(GO:0061091) positive regulation of phospholipid translocation(GO:0061092) |
| 0.8 |
3.1 |
GO:0070257 |
positive regulation of mucus secretion(GO:0070257) |
| 0.8 |
3.1 |
GO:0040015 |
negative regulation of multicellular organism growth(GO:0040015) |
| 0.8 |
3.9 |
GO:0046598 |
positive regulation of viral entry into host cell(GO:0046598) |
| 0.8 |
3.9 |
GO:0070417 |
cellular response to cold(GO:0070417) |
| 0.8 |
0.8 |
GO:0006642 |
triglyceride mobilization(GO:0006642) |
| 0.8 |
3.9 |
GO:0070164 |
negative regulation of adiponectin secretion(GO:0070164) |
| 0.8 |
0.8 |
GO:1904192 |
cholangiocyte apoptotic process(GO:1902488) regulation of cholangiocyte apoptotic process(GO:1904192) negative regulation of cholangiocyte apoptotic process(GO:1904193) |
| 0.8 |
3.0 |
GO:0071499 |
response to laminar fluid shear stress(GO:0034616) cellular response to laminar fluid shear stress(GO:0071499) |
| 0.7 |
12.6 |
GO:0032933 |
response to sterol depletion(GO:0006991) SREBP signaling pathway(GO:0032933) cellular response to sterol depletion(GO:0071501) |
| 0.7 |
5.9 |
GO:0071455 |
cellular response to increased oxygen levels(GO:0036295) cellular response to hyperoxia(GO:0071455) |
| 0.7 |
2.2 |
GO:0019336 |
phenol-containing compound catabolic process(GO:0019336) |
| 0.7 |
3.7 |
GO:1900086 |
regulation of peptidyl-tyrosine autophosphorylation(GO:1900084) positive regulation of peptidyl-tyrosine autophosphorylation(GO:1900086) |
| 0.7 |
0.7 |
GO:0032227 |
negative regulation of synaptic transmission, dopaminergic(GO:0032227) |
| 0.7 |
2.2 |
GO:0014043 |
negative regulation of neuron maturation(GO:0014043) |
| 0.7 |
2.9 |
GO:1904426 |
positive regulation of GTP binding(GO:1904426) |
| 0.7 |
2.9 |
GO:1901524 |
regulation of macromitophagy(GO:1901524) negative regulation of macromitophagy(GO:1901525) |
| 0.7 |
0.7 |
GO:0071481 |
cellular response to X-ray(GO:0071481) |
| 0.7 |
7.9 |
GO:0021684 |
cerebellar granular layer formation(GO:0021684) cerebellar granule cell differentiation(GO:0021707) |
| 0.7 |
0.7 |
GO:0043619 |
regulation of transcription from RNA polymerase II promoter in response to oxidative stress(GO:0043619) |
| 0.7 |
5.0 |
GO:2000051 |
negative regulation of non-canonical Wnt signaling pathway(GO:2000051) |
| 0.7 |
3.6 |
GO:0021910 |
smoothened signaling pathway involved in ventral spinal cord patterning(GO:0021910) |
| 0.7 |
7.8 |
GO:0043011 |
myeloid dendritic cell differentiation(GO:0043011) |
| 0.7 |
0.7 |
GO:0016080 |
synaptic vesicle targeting(GO:0016080) |
| 0.7 |
0.7 |
GO:0097151 |
positive regulation of inhibitory postsynaptic potential(GO:0097151) |
| 0.7 |
1.4 |
GO:0061502 |
early endosome to recycling endosome transport(GO:0061502) |
| 0.7 |
2.1 |
GO:2000819 |
regulation of nucleotide-excision repair(GO:2000819) |
| 0.7 |
4.2 |
GO:0006384 |
transcription initiation from RNA polymerase III promoter(GO:0006384) |
| 0.7 |
2.1 |
GO:0035621 |
ER to Golgi ceramide transport(GO:0035621) ceramide transport(GO:0035627) |
| 0.7 |
2.1 |
GO:0051151 |
negative regulation of smooth muscle cell differentiation(GO:0051151) |
| 0.7 |
2.1 |
GO:0006507 |
GPI anchor release(GO:0006507) |
| 0.7 |
2.1 |
GO:0033364 |
mast cell secretory granule organization(GO:0033364) |
| 0.7 |
2.8 |
GO:0042985 |
negative regulation of amyloid precursor protein biosynthetic process(GO:0042985) |
| 0.7 |
2.1 |
GO:0003245 |
cardiac muscle tissue growth involved in heart morphogenesis(GO:0003245) |
| 0.7 |
1.4 |
GO:0002538 |
arachidonic acid metabolite production involved in inflammatory response(GO:0002538) |
| 0.7 |
6.9 |
GO:0016322 |
neuron remodeling(GO:0016322) |
| 0.7 |
0.7 |
GO:0033092 |
positive regulation of immature T cell proliferation in thymus(GO:0033092) |
| 0.7 |
1.4 |
GO:0021506 |
anterior neuropore closure(GO:0021506) neuropore closure(GO:0021995) |
| 0.7 |
5.4 |
GO:0014824 |
artery smooth muscle contraction(GO:0014824) |
| 0.7 |
2.7 |
GO:0042276 |
error-prone translesion synthesis(GO:0042276) |
| 0.7 |
10.1 |
GO:0033234 |
negative regulation of protein sumoylation(GO:0033234) |
| 0.7 |
2.7 |
GO:0051176 |
positive regulation of sulfur metabolic process(GO:0051176) |
| 0.7 |
2.7 |
GO:0030382 |
sperm mitochondrion organization(GO:0030382) |
| 0.7 |
2.0 |
GO:2000170 |
positive regulation of peptidyl-cysteine S-nitrosylation(GO:2000170) |
| 0.7 |
0.7 |
GO:0010878 |
cholesterol storage(GO:0010878) |
| 0.7 |
1.3 |
GO:0048199 |
vesicle targeting, to, from or within Golgi(GO:0048199) |
| 0.7 |
2.7 |
GO:0071415 |
cellular response to caffeine(GO:0071313) cellular response to purine-containing compound(GO:0071415) |
| 0.7 |
2.6 |
GO:0061304 |
retinal blood vessel morphogenesis(GO:0061304) |
| 0.7 |
1.3 |
GO:0007227 |
signal transduction downstream of smoothened(GO:0007227) positive regulation of hh target transcription factor activity(GO:0007228) |
| 0.7 |
1.3 |
GO:0048149 |
behavioral response to ethanol(GO:0048149) |
| 0.7 |
4.6 |
GO:0002488 |
antigen processing and presentation of endogenous peptide antigen via MHC class Ib via ER pathway(GO:0002488) antigen processing and presentation of endogenous peptide antigen via MHC class Ib via ER pathway, TAP-dependent(GO:0002489) |
| 0.6 |
1.9 |
GO:0007158 |
neuron cell-cell adhesion(GO:0007158) |
| 0.6 |
1.9 |
GO:0051365 |
cellular response to potassium ion starvation(GO:0051365) |
| 0.6 |
1.3 |
GO:0035826 |
rubidium ion transport(GO:0035826) |
| 0.6 |
2.6 |
GO:0014067 |
negative regulation of phosphatidylinositol 3-kinase signaling(GO:0014067) |
| 0.6 |
1.9 |
GO:0006285 |
base-excision repair, AP site formation(GO:0006285) |
| 0.6 |
2.6 |
GO:0071692 |
protein localization to extracellular region(GO:0071692) maintenance of protein location in extracellular region(GO:0071694) |
| 0.6 |
3.2 |
GO:2000465 |
regulation of glycogen (starch) synthase activity(GO:2000465) |
| 0.6 |
2.6 |
GO:0072602 |
interleukin-4 secretion(GO:0072602) |
| 0.6 |
1.9 |
GO:0097503 |
sialylation(GO:0097503) protein sialylation(GO:1990743) |
| 0.6 |
1.9 |
GO:0048703 |
embryonic viscerocranium morphogenesis(GO:0048703) |
| 0.6 |
12.5 |
GO:0001574 |
ganglioside biosynthetic process(GO:0001574) |
| 0.6 |
0.6 |
GO:0034384 |
high-density lipoprotein particle clearance(GO:0034384) |
| 0.6 |
11.8 |
GO:0015701 |
bicarbonate transport(GO:0015701) |
| 0.6 |
1.2 |
GO:0097178 |
ruffle assembly(GO:0097178) |
| 0.6 |
1.9 |
GO:0072257 |
metanephric nephron tubule epithelial cell differentiation(GO:0072257) regulation of metanephric nephron tubule epithelial cell differentiation(GO:0072307) |
| 0.6 |
1.9 |
GO:0043379 |
memory T cell differentiation(GO:0043379) |
| 0.6 |
2.5 |
GO:0060576 |
intestinal epithelial cell development(GO:0060576) |
| 0.6 |
1.2 |
GO:0060355 |
positive regulation of cell adhesion molecule production(GO:0060355) |
| 0.6 |
0.6 |
GO:0060994 |
regulation of transcription from RNA polymerase II promoter involved in kidney development(GO:0060994) |
| 0.6 |
2.5 |
GO:0035878 |
nail development(GO:0035878) |
| 0.6 |
2.5 |
GO:2000211 |
regulation of glutamate metabolic process(GO:2000211) |
| 0.6 |
6.7 |
GO:0097049 |
motor neuron apoptotic process(GO:0097049) |
| 0.6 |
5.5 |
GO:0031659 |
positive regulation of cyclin-dependent protein serine/threonine kinase activity involved in G1/S transition of mitotic cell cycle(GO:0031659) |
| 0.6 |
1.2 |
GO:0006116 |
NADH oxidation(GO:0006116) |
| 0.6 |
3.6 |
GO:0060539 |
diaphragm development(GO:0060539) |
| 0.6 |
3.0 |
GO:0019882 |
antigen processing and presentation(GO:0019882) |
| 0.6 |
1.8 |
GO:0010961 |
cellular magnesium ion homeostasis(GO:0010961) |
| 0.6 |
2.4 |
GO:0038163 |
thrombopoietin-mediated signaling pathway(GO:0038163) |
| 0.6 |
1.2 |
GO:0030321 |
transepithelial chloride transport(GO:0030321) |
| 0.6 |
1.8 |
GO:0010694 |
positive regulation of alkaline phosphatase activity(GO:0010694) |
| 0.6 |
1.8 |
GO:0001978 |
regulation of systemic arterial blood pressure by carotid sinus baroreceptor feedback(GO:0001978) |
| 0.6 |
1.8 |
GO:0036500 |
ATF6-mediated unfolded protein response(GO:0036500) |
| 0.6 |
1.2 |
GO:0006072 |
glycerol-3-phosphate metabolic process(GO:0006072) |
| 0.6 |
1.8 |
GO:0051004 |
regulation of lipoprotein lipase activity(GO:0051004) |
| 0.6 |
1.2 |
GO:0032242 |
regulation of nucleoside transport(GO:0032242) |
| 0.6 |
7.6 |
GO:0007252 |
I-kappaB phosphorylation(GO:0007252) |
| 0.6 |
2.9 |
GO:0042167 |
heme catabolic process(GO:0042167) pigment catabolic process(GO:0046149) |
| 0.6 |
2.9 |
GO:0048312 |
intracellular distribution of mitochondria(GO:0048312) |
| 0.6 |
1.7 |
GO:0060054 |
positive regulation of epithelial cell proliferation involved in wound healing(GO:0060054) |
| 0.6 |
3.5 |
GO:0097368 |
establishment of Sertoli cell barrier(GO:0097368) |
| 0.6 |
4.6 |
GO:0032020 |
ISG15-protein conjugation(GO:0032020) |
| 0.6 |
3.4 |
GO:0006290 |
pyrimidine dimer repair(GO:0006290) |
| 0.6 |
1.7 |
GO:0009644 |
response to high light intensity(GO:0009644) |
| 0.6 |
10.1 |
GO:0014047 |
glutamate secretion(GO:0014047) |
| 0.6 |
1.7 |
GO:0002726 |
positive regulation of T cell cytokine production(GO:0002726) |
| 0.6 |
6.1 |
GO:1901629 |
regulation of presynaptic membrane organization(GO:1901629) |
| 0.6 |
1.7 |
GO:2001185 |
regulation of CD8-positive, alpha-beta T cell activation(GO:2001185) |
| 0.6 |
2.2 |
GO:0006883 |
cellular sodium ion homeostasis(GO:0006883) |
| 0.6 |
1.7 |
GO:0046880 |
regulation of follicle-stimulating hormone secretion(GO:0046880) follicle-stimulating hormone secretion(GO:0046884) |
| 0.6 |
2.2 |
GO:0007406 |
negative regulation of neuroblast proliferation(GO:0007406) |
| 0.6 |
1.1 |
GO:0044034 |
negative stranded viral RNA replication(GO:0039689) multi-organism biosynthetic process(GO:0044034) |
| 0.5 |
1.1 |
GO:0002484 |
antigen processing and presentation of endogenous peptide antigen via MHC class I via ER pathway(GO:0002484) antigen processing and presentation of endogenous peptide antigen via MHC class I via ER pathway, TAP-dependent(GO:0002485) |
| 0.5 |
4.9 |
GO:0042572 |
retinol metabolic process(GO:0042572) |
| 0.5 |
0.5 |
GO:0071286 |
cellular response to magnesium ion(GO:0071286) |
| 0.5 |
2.7 |
GO:0051611 |
negative regulation of neurotransmitter uptake(GO:0051581) serotonin uptake(GO:0051610) regulation of serotonin uptake(GO:0051611) negative regulation of serotonin uptake(GO:0051612) |
| 0.5 |
0.5 |
GO:0034122 |
negative regulation of toll-like receptor signaling pathway(GO:0034122) |
| 0.5 |
3.8 |
GO:1990118 |
sodium ion import across plasma membrane(GO:0098719) sodium ion import into cell(GO:1990118) |
| 0.5 |
2.7 |
GO:0021819 |
layer formation in cerebral cortex(GO:0021819) |
| 0.5 |
1.6 |
GO:0061687 |
detoxification of inorganic compound(GO:0061687) |
| 0.5 |
1.1 |
GO:0045075 |
interleukin-12 biosynthetic process(GO:0042090) regulation of interleukin-12 biosynthetic process(GO:0045075) |
| 0.5 |
1.1 |
GO:0036292 |
DNA rewinding(GO:0036292) |
| 0.5 |
3.2 |
GO:0035405 |
histone-threonine phosphorylation(GO:0035405) |
| 0.5 |
3.2 |
GO:0070102 |
interleukin-6-mediated signaling pathway(GO:0070102) |
| 0.5 |
17.1 |
GO:0007157 |
heterophilic cell-cell adhesion via plasma membrane cell adhesion molecules(GO:0007157) |
| 0.5 |
1.1 |
GO:0060644 |
mammary gland epithelial cell differentiation(GO:0060644) |
| 0.5 |
2.1 |
GO:0006049 |
UDP-N-acetylglucosamine catabolic process(GO:0006049) |
| 0.5 |
1.6 |
GO:0051541 |
elastin metabolic process(GO:0051541) |
| 0.5 |
1.1 |
GO:0033484 |
nitric oxide homeostasis(GO:0033484) |
| 0.5 |
3.2 |
GO:0034393 |
positive regulation of smooth muscle cell apoptotic process(GO:0034393) |
| 0.5 |
1.0 |
GO:0014889 |
muscle atrophy(GO:0014889) |
| 0.5 |
7.3 |
GO:0048240 |
sperm capacitation(GO:0048240) |
| 0.5 |
0.5 |
GO:0031117 |
positive regulation of microtubule depolymerization(GO:0031117) |
| 0.5 |
0.5 |
GO:0003162 |
atrioventricular node development(GO:0003162) |
| 0.5 |
1.6 |
GO:0018008 |
N-terminal peptidyl-glycine N-myristoylation(GO:0018008) peptidyl-glycine modification(GO:0018201) |
| 0.5 |
0.5 |
GO:0033239 |
negative regulation of cellular amine metabolic process(GO:0033239) |
| 0.5 |
1.0 |
GO:0072160 |
nephron tubule epithelial cell differentiation(GO:0072160) |
| 0.5 |
1.0 |
GO:0006002 |
fructose 6-phosphate metabolic process(GO:0006002) |
| 0.5 |
2.1 |
GO:1900220 |
semaphorin-plexin signaling pathway involved in bone trabecula morphogenesis(GO:1900220) |
| 0.5 |
2.1 |
GO:0010735 |
positive regulation of transcription via serum response element binding(GO:0010735) |
| 0.5 |
4.1 |
GO:0031937 |
positive regulation of chromatin silencing(GO:0031937) |
| 0.5 |
1.5 |
GO:0071544 |
diphosphoinositol polyphosphate metabolic process(GO:0071543) diphosphoinositol polyphosphate catabolic process(GO:0071544) |
| 0.5 |
1.5 |
GO:0097274 |
urea homeostasis(GO:0097274) |
| 0.5 |
1.0 |
GO:1903147 |
negative regulation of mitophagy(GO:1903147) |
| 0.5 |
1.5 |
GO:0045041 |
protein import into mitochondrial intermembrane space(GO:0045041) |
| 0.5 |
2.0 |
GO:0072365 |
regulation of cellular ketone metabolic process by negative regulation of transcription from RNA polymerase II promoter(GO:0072365) |
| 0.5 |
0.5 |
GO:2000017 |
positive regulation of determination of dorsal identity(GO:2000017) |
| 0.5 |
1.0 |
GO:0042373 |
vitamin K metabolic process(GO:0042373) |
| 0.5 |
1.5 |
GO:0060027 |
convergent extension involved in gastrulation(GO:0060027) |
| 0.5 |
2.5 |
GO:0001878 |
response to yeast(GO:0001878) |
| 0.5 |
2.9 |
GO:0098838 |
reduced folate transmembrane transport(GO:0098838) |
| 0.5 |
1.5 |
GO:2000983 |
regulation of ATP citrate synthase activity(GO:2000983) negative regulation of ATP citrate synthase activity(GO:2000984) |
| 0.5 |
2.0 |
GO:0008355 |
olfactory learning(GO:0008355) |
| 0.5 |
1.0 |
GO:2000987 |
positive regulation of fear response(GO:1903367) positive regulation of behavioral fear response(GO:2000987) |
| 0.5 |
3.9 |
GO:0045721 |
negative regulation of gluconeogenesis(GO:0045721) |
| 0.5 |
4.9 |
GO:0045907 |
positive regulation of vasoconstriction(GO:0045907) |
| 0.5 |
1.5 |
GO:0006706 |
steroid catabolic process(GO:0006706) |
| 0.5 |
1.0 |
GO:0032380 |
regulation of intracellular lipid transport(GO:0032377) regulation of intracellular sterol transport(GO:0032380) regulation of intracellular cholesterol transport(GO:0032383) |
| 0.5 |
4.4 |
GO:0019800 |
peptide cross-linking via chondroitin 4-sulfate glycosaminoglycan(GO:0019800) |
| 0.5 |
0.5 |
GO:1904995 |
negative regulation of leukocyte adhesion to vascular endothelial cell(GO:1904995) |
| 0.5 |
3.9 |
GO:0007042 |
lysosomal lumen acidification(GO:0007042) |
| 0.5 |
0.5 |
GO:0035973 |
aggrephagy(GO:0035973) |
| 0.5 |
4.3 |
GO:0035493 |
SNARE complex assembly(GO:0035493) |
| 0.5 |
2.4 |
GO:0032482 |
Rab protein signal transduction(GO:0032482) |
| 0.5 |
1.4 |
GO:0043416 |
regulation of skeletal muscle tissue regeneration(GO:0043416) |
| 0.5 |
2.4 |
GO:0048520 |
positive regulation of behavior(GO:0048520) |
| 0.5 |
1.0 |
GO:0008626 |
granzyme-mediated apoptotic signaling pathway(GO:0008626) |
| 0.5 |
0.5 |
GO:0046888 |
negative regulation of hormone secretion(GO:0046888) |
| 0.5 |
1.0 |
GO:1902498 |
regulation of protein autoubiquitination(GO:1902498) |
| 0.5 |
0.5 |
GO:0021882 |
regulation of transcription from RNA polymerase II promoter involved in forebrain neuron fate commitment(GO:0021882) commitment of multipotent stem cells to neuronal lineage in forebrain(GO:0021898) |
| 0.5 |
2.8 |
GO:0051534 |
negative regulation of NFAT protein import into nucleus(GO:0051534) |
| 0.5 |
1.9 |
GO:1901165 |
positive regulation of trophoblast cell migration(GO:1901165) |
| 0.5 |
0.9 |
GO:0032488 |
Cdc42 protein signal transduction(GO:0032488) |
| 0.5 |
4.7 |
GO:1900112 |
regulation of histone H3-K9 trimethylation(GO:1900112) negative regulation of histone H3-K9 trimethylation(GO:1900113) |
| 0.5 |
1.4 |
GO:0045014 |
carbon catabolite repression of transcription(GO:0045013) negative regulation of transcription by glucose(GO:0045014) |
| 0.5 |
2.3 |
GO:0006741 |
NADP biosynthetic process(GO:0006741) |
| 0.5 |
1.4 |
GO:0006558 |
L-phenylalanine metabolic process(GO:0006558) erythrose 4-phosphate/phosphoenolpyruvate family amino acid metabolic process(GO:1902221) |
| 0.5 |
0.9 |
GO:0002681 |
somatic diversification of T cell receptor genes(GO:0002568) somatic recombination of T cell receptor gene segments(GO:0002681) T cell receptor V(D)J recombination(GO:0033153) |
| 0.5 |
1.9 |
GO:0090219 |
negative regulation of lipid kinase activity(GO:0090219) |
| 0.5 |
3.7 |
GO:0006013 |
mannose metabolic process(GO:0006013) |
| 0.5 |
0.9 |
GO:1903054 |
negative regulation of extracellular matrix organization(GO:1903054) |
| 0.5 |
0.9 |
GO:0072718 |
response to cisplatin(GO:0072718) |
| 0.5 |
2.3 |
GO:0048069 |
eye pigmentation(GO:0048069) |
| 0.5 |
1.8 |
GO:0010387 |
COP9 signalosome assembly(GO:0010387) |
| 0.5 |
1.8 |
GO:0008054 |
negative regulation of cyclin-dependent protein serine/threonine kinase by cyclin degradation(GO:0008054) |
| 0.5 |
0.5 |
GO:1902714 |
negative regulation of interferon-gamma secretion(GO:1902714) |
| 0.5 |
1.8 |
GO:0019276 |
UDP-N-acetylgalactosamine metabolic process(GO:0019276) |
| 0.5 |
2.3 |
GO:1901678 |
iron coordination entity transport(GO:1901678) |
| 0.5 |
5.0 |
GO:0009651 |
response to salt stress(GO:0009651) |
| 0.5 |
0.9 |
GO:1903519 |
apoptotic process involved in mammary gland involution(GO:0060057) positive regulation of apoptotic process involved in mammary gland involution(GO:0060058) positive regulation of apoptotic process involved in morphogenesis(GO:1902339) regulation of mammary gland involution(GO:1903519) positive regulation of mammary gland involution(GO:1903521) positive regulation of apoptotic process involved in development(GO:1904747) |
| 0.4 |
1.8 |
GO:0070127 |
tRNA aminoacylation for mitochondrial protein translation(GO:0070127) |
| 0.4 |
2.2 |
GO:0034058 |
endosomal vesicle fusion(GO:0034058) |
| 0.4 |
1.3 |
GO:0048311 |
mitochondrion distribution(GO:0048311) |
| 0.4 |
1.3 |
GO:0048289 |
isotype switching to IgE isotypes(GO:0048289) regulation of isotype switching to IgE isotypes(GO:0048293) |
| 0.4 |
0.4 |
GO:0006776 |
vitamin A metabolic process(GO:0006776) |
| 0.4 |
0.9 |
GO:2000418 |
positive regulation of eosinophil migration(GO:2000418) |
| 0.4 |
0.9 |
GO:0033088 |
negative regulation of immature T cell proliferation in thymus(GO:0033088) |
| 0.4 |
1.3 |
GO:0006001 |
fructose catabolic process(GO:0006001) fructose catabolic process to hydroxyacetone phosphate and glyceraldehyde-3-phosphate(GO:0061624) glycolytic process through fructose-1-phosphate(GO:0061625) |
| 0.4 |
1.8 |
GO:0060978 |
angiogenesis involved in coronary vascular morphogenesis(GO:0060978) |
| 0.4 |
4.9 |
GO:0071225 |
cellular response to muramyl dipeptide(GO:0071225) |
| 0.4 |
0.4 |
GO:0003338 |
metanephros morphogenesis(GO:0003338) |
| 0.4 |
3.1 |
GO:0048227 |
plasma membrane to endosome transport(GO:0048227) |
| 0.4 |
2.6 |
GO:1904217 |
regulation of CDP-diacylglycerol-serine O-phosphatidyltransferase activity(GO:1904217) positive regulation of CDP-diacylglycerol-serine O-phosphatidyltransferase activity(GO:1904219) regulation of serine C-palmitoyltransferase activity(GO:1904220) positive regulation of serine C-palmitoyltransferase activity(GO:1904222) |
| 0.4 |
5.3 |
GO:0071378 |
growth hormone receptor signaling pathway(GO:0060396) cellular response to growth hormone stimulus(GO:0071378) |
| 0.4 |
3.1 |
GO:0006621 |
protein retention in ER lumen(GO:0006621) |
| 0.4 |
2.6 |
GO:0060219 |
camera-type eye photoreceptor cell differentiation(GO:0060219) |
| 0.4 |
1.8 |
GO:1904354 |
negative regulation of telomere capping(GO:1904354) |
| 0.4 |
1.3 |
GO:1903774 |
positive regulation of viral budding via host ESCRT complex(GO:1903774) |
| 0.4 |
5.2 |
GO:0000059 |
protein import into nucleus, docking(GO:0000059) |
| 0.4 |
1.3 |
GO:0060800 |
regulation of cell differentiation involved in embryonic placenta development(GO:0060800) |
| 0.4 |
0.4 |
GO:0046851 |
negative regulation of bone remodeling(GO:0046851) |
| 0.4 |
3.0 |
GO:0001573 |
ganglioside metabolic process(GO:0001573) |
| 0.4 |
1.3 |
GO:0019043 |
establishment of viral latency(GO:0019043) |
| 0.4 |
2.2 |
GO:0032484 |
Ral protein signal transduction(GO:0032484) |
| 0.4 |
3.0 |
GO:0035994 |
response to muscle stretch(GO:0035994) |
| 0.4 |
0.4 |
GO:0045144 |
meiotic sister chromatid segregation(GO:0045144) meiotic sister chromatid cohesion(GO:0051177) |
| 0.4 |
0.4 |
GO:1900121 |
negative regulation of receptor binding(GO:1900121) |
| 0.4 |
3.0 |
GO:0035735 |
intraciliary transport involved in cilium morphogenesis(GO:0035735) |
| 0.4 |
0.4 |
GO:1901668 |
regulation of superoxide dismutase activity(GO:1901668) |
| 0.4 |
1.7 |
GO:0009449 |
gamma-aminobutyric acid biosynthetic process(GO:0009449) |
| 0.4 |
1.3 |
GO:0035864 |
response to potassium ion(GO:0035864) cellular response to potassium ion(GO:0035865) |
| 0.4 |
1.7 |
GO:0005513 |
detection of calcium ion(GO:0005513) |
| 0.4 |
5.4 |
GO:0006268 |
DNA unwinding involved in DNA replication(GO:0006268) |
| 0.4 |
1.3 |
GO:1990314 |
cellular response to insulin-like growth factor stimulus(GO:1990314) |
| 0.4 |
3.3 |
GO:0006620 |
posttranslational protein targeting to membrane(GO:0006620) |
| 0.4 |
11.3 |
GO:0009268 |
response to pH(GO:0009268) |
| 0.4 |
1.3 |
GO:0051561 |
positive regulation of mitochondrial calcium ion concentration(GO:0051561) |
| 0.4 |
4.2 |
GO:0090084 |
negative regulation of inclusion body assembly(GO:0090084) |
| 0.4 |
0.8 |
GO:0036092 |
phosphatidylinositol-3-phosphate biosynthetic process(GO:0036092) |
| 0.4 |
1.6 |
GO:0006842 |
tricarboxylic acid transport(GO:0006842) citrate transport(GO:0015746) |
| 0.4 |
2.5 |
GO:0051790 |
short-chain fatty acid biosynthetic process(GO:0051790) |
| 0.4 |
0.8 |
GO:0071873 |
response to norepinephrine(GO:0071873) |
| 0.4 |
0.4 |
GO:0036089 |
cleavage furrow formation(GO:0036089) |
| 0.4 |
2.0 |
GO:0090286 |
cytoskeletal anchoring at nuclear membrane(GO:0090286) |
| 0.4 |
3.3 |
GO:0009181 |
purine nucleoside diphosphate catabolic process(GO:0009137) purine ribonucleoside diphosphate catabolic process(GO:0009181) |
| 0.4 |
2.0 |
GO:0070886 |
positive regulation of calcineurin-NFAT signaling cascade(GO:0070886) |
| 0.4 |
0.8 |
GO:0019934 |
cGMP-mediated signaling(GO:0019934) |
| 0.4 |
4.1 |
GO:2001014 |
regulation of skeletal muscle cell differentiation(GO:2001014) |
| 0.4 |
2.0 |
GO:0060718 |
chorionic trophoblast cell differentiation(GO:0060718) |
| 0.4 |
0.4 |
GO:0035441 |
cell migration involved in vasculogenesis(GO:0035441) |
| 0.4 |
0.8 |
GO:0043323 |
natural killer cell degranulation(GO:0043320) regulation of natural killer cell degranulation(GO:0043321) positive regulation of natural killer cell degranulation(GO:0043323) |
| 0.4 |
2.4 |
GO:0016553 |
base conversion or substitution editing(GO:0016553) |
| 0.4 |
0.8 |
GO:0097094 |
craniofacial suture morphogenesis(GO:0097094) |
| 0.4 |
2.0 |
GO:0032007 |
negative regulation of TOR signaling(GO:0032007) |
| 0.4 |
1.6 |
GO:0045717 |
negative regulation of fatty acid biosynthetic process(GO:0045717) |
| 0.4 |
3.2 |
GO:0044144 |
regulation of growth of symbiont in host(GO:0044126) modulation of growth of symbiont involved in interaction with host(GO:0044144) |
| 0.4 |
1.2 |
GO:0071649 |
regulation of chemokine (C-C motif) ligand 5 production(GO:0071649) |
| 0.4 |
1.2 |
GO:0046959 |
habituation(GO:0046959) |
| 0.4 |
2.0 |
GO:0060004 |
reflex(GO:0060004) |
| 0.4 |
1.2 |
GO:0046900 |
tetrahydrofolylpolyglutamate metabolic process(GO:0046900) |
| 0.4 |
2.3 |
GO:0030206 |
chondroitin sulfate biosynthetic process(GO:0030206) |
| 0.4 |
1.2 |
GO:0033326 |
cerebrospinal fluid secretion(GO:0033326) |
| 0.4 |
2.3 |
GO:0033147 |
negative regulation of intracellular estrogen receptor signaling pathway(GO:0033147) |
| 0.4 |
1.5 |
GO:1904425 |
negative regulation of GTP binding(GO:1904425) |
| 0.4 |
0.4 |
GO:0072338 |
creatinine metabolic process(GO:0046449) cellular lactam metabolic process(GO:0072338) |
| 0.4 |
10.3 |
GO:0007520 |
myoblast fusion(GO:0007520) |
| 0.4 |
1.1 |
GO:0001193 |
maintenance of transcriptional fidelity during DNA-templated transcription elongation(GO:0001192) maintenance of transcriptional fidelity during DNA-templated transcription elongation from RNA polymerase II promoter(GO:0001193) |
| 0.4 |
1.9 |
GO:0014886 |
transition between slow and fast fiber(GO:0014886) |
| 0.4 |
1.5 |
GO:0006668 |
sphinganine-1-phosphate metabolic process(GO:0006668) |
| 0.4 |
1.5 |
GO:0021631 |
optic nerve morphogenesis(GO:0021631) |
| 0.4 |
1.5 |
GO:0019695 |
choline metabolic process(GO:0019695) |
| 0.4 |
1.9 |
GO:0015808 |
L-alanine transport(GO:0015808) |
| 0.4 |
2.6 |
GO:0006646 |
phosphatidylethanolamine biosynthetic process(GO:0006646) |
| 0.4 |
3.7 |
GO:0090557 |
establishment of endothelial intestinal barrier(GO:0090557) |
| 0.4 |
5.5 |
GO:0061029 |
eyelid development in camera-type eye(GO:0061029) |
| 0.4 |
0.7 |
GO:0035526 |
retrograde transport, plasma membrane to Golgi(GO:0035526) |
| 0.4 |
1.1 |
GO:2000344 |
positive regulation of acrosome reaction(GO:2000344) |
| 0.4 |
0.7 |
GO:0097205 |
renal filtration(GO:0097205) |
| 0.4 |
1.8 |
GO:0071894 |
histone H2B conserved C-terminal lysine ubiquitination(GO:0071894) |
| 0.4 |
0.4 |
GO:0090289 |
regulation of osteoclast proliferation(GO:0090289) |
| 0.4 |
1.8 |
GO:0006369 |
termination of RNA polymerase II transcription(GO:0006369) |
| 0.4 |
1.8 |
GO:0051775 |
response to redox state(GO:0051775) |
| 0.4 |
2.5 |
GO:0006686 |
sphingomyelin biosynthetic process(GO:0006686) |
| 0.4 |
1.1 |
GO:0051503 |
adenine nucleotide transport(GO:0051503) |
| 0.4 |
0.7 |
GO:2000620 |
regulation of histone H4-K16 acetylation(GO:2000618) positive regulation of histone H4-K16 acetylation(GO:2000620) |
| 0.4 |
1.8 |
GO:0052646 |
alditol phosphate metabolic process(GO:0052646) |
| 0.4 |
4.6 |
GO:0032957 |
inositol trisphosphate metabolic process(GO:0032957) |
| 0.4 |
0.7 |
GO:0021764 |
amygdala development(GO:0021764) |
| 0.4 |
0.7 |
GO:2001269 |
positive regulation of cysteine-type endopeptidase activity involved in apoptotic signaling pathway(GO:2001269) |
| 0.4 |
0.7 |
GO:2000015 |
regulation of determination of dorsal identity(GO:2000015) |
| 0.4 |
1.4 |
GO:0042448 |
progesterone metabolic process(GO:0042448) |
| 0.4 |
0.7 |
GO:0050703 |
interleukin-1 alpha production(GO:0032610) interleukin-1 alpha secretion(GO:0050703) |
| 0.4 |
0.4 |
GO:0050995 |
negative regulation of lipid catabolic process(GO:0050995) |
| 0.4 |
0.7 |
GO:0002347 |
response to tumor cell(GO:0002347) |
| 0.4 |
0.4 |
GO:0072282 |
metanephric nephron tubule morphogenesis(GO:0072282) |
| 0.4 |
1.8 |
GO:0050847 |
progesterone receptor signaling pathway(GO:0050847) |
| 0.4 |
2.5 |
GO:0034113 |
heterotypic cell-cell adhesion(GO:0034113) |
| 0.4 |
2.1 |
GO:0019240 |
citrulline biosynthetic process(GO:0019240) |
| 0.4 |
1.1 |
GO:0045204 |
MAPK export from nucleus(GO:0045204) |
| 0.4 |
5.3 |
GO:0071577 |
zinc II ion transmembrane transport(GO:0071577) |
| 0.3 |
1.0 |
GO:0042196 |
dichloromethane metabolic process(GO:0018900) chlorinated hydrocarbon metabolic process(GO:0042196) halogenated hydrocarbon metabolic process(GO:0042197) |
| 0.3 |
1.7 |
GO:0045072 |
regulation of interferon-gamma biosynthetic process(GO:0045072) positive regulation of interferon-gamma biosynthetic process(GO:0045078) |
| 0.3 |
2.8 |
GO:0061088 |
sequestering of zinc ion(GO:0032119) regulation of sequestering of zinc ion(GO:0061088) |
| 0.3 |
1.7 |
GO:0060509 |
Type I pneumocyte differentiation(GO:0060509) |
| 0.3 |
1.7 |
GO:0000480 |
endonucleolytic cleavage in 5'-ETS of tricistronic rRNA transcript (SSU-rRNA, 5.8S rRNA, LSU-rRNA)(GO:0000480) |
| 0.3 |
1.0 |
GO:0045898 |
regulation of RNA polymerase II transcriptional preinitiation complex assembly(GO:0045898) |
| 0.3 |
2.8 |
GO:0010839 |
negative regulation of keratinocyte proliferation(GO:0010839) |
| 0.3 |
4.5 |
GO:0038063 |
collagen-activated tyrosine kinase receptor signaling pathway(GO:0038063) collagen-activated signaling pathway(GO:0038065) |
| 0.3 |
1.0 |
GO:0070782 |
phosphatidylserine exposure on apoptotic cell surface(GO:0070782) |
| 0.3 |
1.0 |
GO:0016191 |
synaptic vesicle uncoating(GO:0016191) regulation of endosome organization(GO:1904978) positive regulation of endosome organization(GO:1904980) |
| 0.3 |
1.4 |
GO:0046339 |
diacylglycerol metabolic process(GO:0046339) |
| 0.3 |
1.0 |
GO:2000574 |
regulation of microtubule motor activity(GO:2000574) |
| 0.3 |
2.1 |
GO:0032731 |
positive regulation of interleukin-1 beta production(GO:0032731) |
| 0.3 |
1.7 |
GO:0010459 |
negative regulation of heart rate(GO:0010459) |
| 0.3 |
2.0 |
GO:0035092 |
sperm chromatin condensation(GO:0035092) |
| 0.3 |
0.3 |
GO:0061217 |
positive regulation of mesonephros development(GO:0061213) regulation of mesonephros development(GO:0061217) |
| 0.3 |
5.1 |
GO:0051044 |
positive regulation of membrane protein ectodomain proteolysis(GO:0051044) |
| 0.3 |
1.0 |
GO:0070166 |
enamel mineralization(GO:0070166) |
| 0.3 |
5.4 |
GO:0044243 |
multicellular organism catabolic process(GO:0044243) |
| 0.3 |
1.4 |
GO:0065001 |
negative regulation of histone H3-K36 methylation(GO:0000415) specification of axis polarity(GO:0065001) |
| 0.3 |
3.7 |
GO:2000480 |
negative regulation of cAMP-dependent protein kinase activity(GO:2000480) |
| 0.3 |
0.3 |
GO:0061140 |
lung secretory cell differentiation(GO:0061140) |
| 0.3 |
1.0 |
GO:0060527 |
prostate glandular acinus morphogenesis(GO:0060526) prostate epithelial cord arborization involved in prostate glandular acinus morphogenesis(GO:0060527) |
| 0.3 |
0.7 |
GO:0002361 |
CD4-positive, CD25-positive, alpha-beta regulatory T cell differentiation(GO:0002361) |
| 0.3 |
0.3 |
GO:2000823 |
regulation of androgen receptor activity(GO:2000823) |
| 0.3 |
0.3 |
GO:0015864 |
pyrimidine nucleoside transport(GO:0015864) |
| 0.3 |
3.0 |
GO:0031065 |
positive regulation of histone deacetylation(GO:0031065) |
| 0.3 |
1.0 |
GO:0032053 |
ciliary basal body organization(GO:0032053) |
| 0.3 |
4.0 |
GO:0000042 |
protein targeting to Golgi(GO:0000042) |
| 0.3 |
2.7 |
GO:0043615 |
astrocyte cell migration(GO:0043615) |
| 0.3 |
2.0 |
GO:0090074 |
negative regulation of protein homodimerization activity(GO:0090074) |
| 0.3 |
1.3 |
GO:0070072 |
vacuolar proton-transporting V-type ATPase complex assembly(GO:0070072) |
| 0.3 |
1.7 |
GO:0090656 |
t-circle formation(GO:0090656) |
| 0.3 |
1.0 |
GO:0003406 |
retinal pigment epithelium development(GO:0003406) |
| 0.3 |
2.0 |
GO:0000083 |
regulation of transcription involved in G1/S transition of mitotic cell cycle(GO:0000083) |
| 0.3 |
1.0 |
GO:0036438 |
maintenance of lens transparency(GO:0036438) |
| 0.3 |
0.3 |
GO:0010593 |
negative regulation of lamellipodium assembly(GO:0010593) |
| 0.3 |
1.3 |
GO:0019355 |
nicotinamide nucleotide biosynthetic process from aspartate(GO:0019355) 'de novo' NAD biosynthetic process(GO:0034627) 'de novo' NAD biosynthetic process from aspartate(GO:0034628) |
| 0.3 |
1.6 |
GO:0016557 |
peroxisome membrane biogenesis(GO:0016557) |
| 0.3 |
1.3 |
GO:0021794 |
thalamus development(GO:0021794) |
| 0.3 |
1.0 |
GO:0018199 |
peptidyl-glutamine modification(GO:0018199) |
| 0.3 |
0.7 |
GO:0071879 |
positive regulation of adrenergic receptor signaling pathway(GO:0071879) |
| 0.3 |
3.3 |
GO:1904262 |
negative regulation of TORC1 signaling(GO:1904262) |
| 0.3 |
1.3 |
GO:0038128 |
ERBB2 signaling pathway(GO:0038128) |
| 0.3 |
1.3 |
GO:1903012 |
positive regulation of bone development(GO:1903012) |
| 0.3 |
2.9 |
GO:0032456 |
endocytic recycling(GO:0032456) |
| 0.3 |
1.3 |
GO:0015909 |
long-chain fatty acid transport(GO:0015909) |
| 0.3 |
0.6 |
GO:0090370 |
negative regulation of cholesterol efflux(GO:0090370) |
| 0.3 |
1.0 |
GO:0051031 |
tRNA transport(GO:0051031) |
| 0.3 |
2.6 |
GO:0015816 |
glycine transport(GO:0015816) |
| 0.3 |
2.6 |
GO:0046686 |
response to cadmium ion(GO:0046686) |
| 0.3 |
1.3 |
GO:0021960 |
anterior commissure morphogenesis(GO:0021960) |
| 0.3 |
0.3 |
GO:1902358 |
sulfate transmembrane transport(GO:1902358) |
| 0.3 |
1.0 |
GO:0072675 |
multinuclear osteoclast differentiation(GO:0072674) osteoclast fusion(GO:0072675) |
| 0.3 |
3.2 |
GO:0071470 |
cellular response to osmotic stress(GO:0071470) |
| 0.3 |
4.7 |
GO:0009081 |
branched-chain amino acid metabolic process(GO:0009081) |
| 0.3 |
2.2 |
GO:0032757 |
positive regulation of interleukin-8 production(GO:0032757) |
| 0.3 |
2.2 |
GO:0006362 |
transcription elongation from RNA polymerase I promoter(GO:0006362) |
| 0.3 |
0.9 |
GO:0048702 |
embryonic neurocranium morphogenesis(GO:0048702) |
| 0.3 |
0.9 |
GO:0031953 |
negative regulation of protein autophosphorylation(GO:0031953) |
| 0.3 |
1.2 |
GO:0007214 |
gamma-aminobutyric acid signaling pathway(GO:0007214) |
| 0.3 |
0.9 |
GO:0070973 |
protein localization to endoplasmic reticulum exit site(GO:0070973) |
| 0.3 |
5.6 |
GO:0046039 |
GTP metabolic process(GO:0046039) |
| 0.3 |
0.9 |
GO:0045053 |
protein retention in Golgi apparatus(GO:0045053) |
| 0.3 |
0.9 |
GO:0034035 |
purine ribonucleoside bisphosphate metabolic process(GO:0034035) |
| 0.3 |
0.9 |
GO:0045909 |
positive regulation of vasodilation(GO:0045909) |
| 0.3 |
0.3 |
GO:0003139 |
secondary heart field specification(GO:0003139) |
| 0.3 |
2.8 |
GO:0090140 |
regulation of mitochondrial fission(GO:0090140) |
| 0.3 |
1.5 |
GO:0030828 |
positive regulation of cGMP biosynthetic process(GO:0030828) |
| 0.3 |
0.6 |
GO:1904468 |
negative regulation of tumor necrosis factor secretion(GO:1904468) |
| 0.3 |
0.9 |
GO:0001869 |
regulation of complement activation, lectin pathway(GO:0001868) negative regulation of complement activation, lectin pathway(GO:0001869) |
| 0.3 |
1.2 |
GO:0070779 |
D-aspartate transport(GO:0070777) D-aspartate import(GO:0070779) |
| 0.3 |
0.3 |
GO:0030167 |
proteoglycan catabolic process(GO:0030167) |
| 0.3 |
2.1 |
GO:0044090 |
positive regulation of vacuole organization(GO:0044090) |
| 0.3 |
1.2 |
GO:0006895 |
Golgi to endosome transport(GO:0006895) |
| 0.3 |
0.9 |
GO:0090037 |
positive regulation of protein kinase C signaling(GO:0090037) |
| 0.3 |
3.0 |
GO:0048172 |
regulation of short-term neuronal synaptic plasticity(GO:0048172) |
| 0.3 |
2.4 |
GO:0071569 |
protein ufmylation(GO:0071569) |
| 0.3 |
1.8 |
GO:0007296 |
vitellogenesis(GO:0007296) |
| 0.3 |
0.9 |
GO:0045006 |
DNA deamination(GO:0045006) |
| 0.3 |
2.1 |
GO:0044381 |
glucose import in response to insulin stimulus(GO:0044381) regulation of glucose import in response to insulin stimulus(GO:2001273) |
| 0.3 |
2.7 |
GO:0070932 |
histone H3 deacetylation(GO:0070932) |
| 0.3 |
0.9 |
GO:0019858 |
cytosine metabolic process(GO:0019858) |
| 0.3 |
1.2 |
GO:0071596 |
ubiquitin-dependent protein catabolic process via the N-end rule pathway(GO:0071596) |
| 0.3 |
0.9 |
GO:0042138 |
meiotic DNA double-strand break formation(GO:0042138) |
| 0.3 |
0.6 |
GO:0071672 |
negative regulation of smooth muscle cell chemotaxis(GO:0071672) |
| 0.3 |
0.6 |
GO:0090005 |
negative regulation of establishment of protein localization to plasma membrane(GO:0090005) |
| 0.3 |
0.6 |
GO:0051593 |
response to folic acid(GO:0051593) |
| 0.3 |
2.0 |
GO:0090004 |
positive regulation of establishment of protein localization to plasma membrane(GO:0090004) |
| 0.3 |
0.6 |
GO:0010726 |
positive regulation of hydrogen peroxide metabolic process(GO:0010726) |
| 0.3 |
0.6 |
GO:0038180 |
nerve growth factor signaling pathway(GO:0038180) |
| 0.3 |
2.0 |
GO:0019511 |
peptidyl-proline hydroxylation(GO:0019511) |
| 0.3 |
3.7 |
GO:0042246 |
tissue regeneration(GO:0042246) |
| 0.3 |
0.9 |
GO:0031860 |
telomeric 3' overhang formation(GO:0031860) |
| 0.3 |
3.4 |
GO:0034219 |
carbohydrate transmembrane transport(GO:0034219) |
| 0.3 |
0.9 |
GO:0055090 |
acylglycerol homeostasis(GO:0055090) triglyceride homeostasis(GO:0070328) |
| 0.3 |
0.9 |
GO:1903546 |
protein localization to photoreceptor outer segment(GO:1903546) |
| 0.3 |
4.3 |
GO:0061099 |
negative regulation of protein tyrosine kinase activity(GO:0061099) |
| 0.3 |
0.6 |
GO:2000347 |
positive regulation of hepatocyte proliferation(GO:2000347) |
| 0.3 |
1.4 |
GO:2000348 |
regulation of CD40 signaling pathway(GO:2000348) |
| 0.3 |
0.3 |
GO:0010040 |
response to iron(II) ion(GO:0010040) |
| 0.3 |
4.2 |
GO:0006613 |
cotranslational protein targeting to membrane(GO:0006613) |
| 0.3 |
0.6 |
GO:0010730 |
negative regulation of hydrogen peroxide metabolic process(GO:0010727) negative regulation of hydrogen peroxide biosynthetic process(GO:0010730) |
| 0.3 |
1.1 |
GO:0035507 |
regulation of myosin-light-chain-phosphatase activity(GO:0035507) |
| 0.3 |
1.7 |
GO:0061718 |
NADH regeneration(GO:0006735) canonical glycolysis(GO:0061621) glucose catabolic process to pyruvate(GO:0061718) |
| 0.3 |
1.1 |
GO:0010820 |
regulation of T cell chemotaxis(GO:0010819) positive regulation of T cell chemotaxis(GO:0010820) |
| 0.3 |
2.5 |
GO:0034498 |
early endosome to Golgi transport(GO:0034498) |
| 0.3 |
0.6 |
GO:0000052 |
citrulline metabolic process(GO:0000052) |
| 0.3 |
1.1 |
GO:0035608 |
protein deglutamylation(GO:0035608) |
| 0.3 |
1.1 |
GO:0034638 |
phosphatidylcholine catabolic process(GO:0034638) |
| 0.3 |
3.3 |
GO:0090161 |
Golgi ribbon formation(GO:0090161) |
| 0.3 |
1.6 |
GO:0006829 |
zinc II ion transport(GO:0006829) |
| 0.3 |
0.3 |
GO:0035434 |
copper ion transmembrane transport(GO:0035434) |
| 0.3 |
0.5 |
GO:0036394 |
amylase secretion(GO:0036394) |
| 0.3 |
3.8 |
GO:0030497 |
fatty acid elongation(GO:0030497) |
| 0.3 |
1.4 |
GO:0045650 |
negative regulation of macrophage differentiation(GO:0045650) |
| 0.3 |
2.7 |
GO:0035970 |
peptidyl-threonine dephosphorylation(GO:0035970) |
| 0.3 |
0.5 |
GO:0061042 |
vascular wound healing(GO:0061042) |
| 0.3 |
0.8 |
GO:1903903 |
regulation of establishment of T cell polarity(GO:1903903) |
| 0.3 |
1.9 |
GO:0006729 |
tetrahydrobiopterin biosynthetic process(GO:0006729) tetrahydrobiopterin metabolic process(GO:0046146) |
| 0.3 |
0.8 |
GO:1904861 |
excitatory synapse assembly(GO:1904861) |
| 0.3 |
2.7 |
GO:0042347 |
negative regulation of NF-kappaB import into nucleus(GO:0042347) |
| 0.3 |
1.6 |
GO:1902373 |
negative regulation of mRNA catabolic process(GO:1902373) |
| 0.3 |
0.8 |
GO:0071371 |
cellular response to gonadotropin stimulus(GO:0071371) |
| 0.3 |
0.3 |
GO:0048369 |
lateral mesoderm morphogenesis(GO:0048369) lateral mesoderm formation(GO:0048370) lateral mesodermal cell differentiation(GO:0048371) |
| 0.3 |
1.9 |
GO:0033184 |
positive regulation of histone ubiquitination(GO:0033184) |
| 0.3 |
3.2 |
GO:0030213 |
hyaluronan biosynthetic process(GO:0030213) |
| 0.3 |
0.8 |
GO:0001955 |
blood vessel maturation(GO:0001955) |
| 0.3 |
1.5 |
GO:0055089 |
fatty acid homeostasis(GO:0055089) |
| 0.3 |
0.5 |
GO:0060330 |
regulation of response to interferon-gamma(GO:0060330) |
| 0.3 |
0.5 |
GO:0015817 |
histidine transport(GO:0015817) |
| 0.3 |
1.0 |
GO:0021891 |
olfactory bulb interneuron development(GO:0021891) |
| 0.3 |
0.8 |
GO:0038003 |
opioid receptor signaling pathway(GO:0038003) regulation of opioid receptor signaling pathway(GO:2000474) |
| 0.3 |
0.8 |
GO:1904526 |
regulation of microtubule plus-end binding(GO:1903031) positive regulation of microtubule plus-end binding(GO:1903033) regulation of microtubule binding(GO:1904526) positive regulation of microtubule binding(GO:1904528) |
| 0.3 |
1.3 |
GO:0000289 |
nuclear-transcribed mRNA poly(A) tail shortening(GO:0000289) |
| 0.3 |
0.3 |
GO:0039530 |
MDA-5 signaling pathway(GO:0039530) |
| 0.3 |
1.3 |
GO:0039535 |
regulation of RIG-I signaling pathway(GO:0039535) positive regulation of RIG-I signaling pathway(GO:1900246) |
| 0.3 |
0.5 |
GO:0090343 |
positive regulation of cell aging(GO:0090343) positive regulation of cellular senescence(GO:2000774) |
| 0.3 |
0.8 |
GO:2001045 |
negative regulation of integrin-mediated signaling pathway(GO:2001045) |
| 0.2 |
1.2 |
GO:1903963 |
arachidonic acid secretion(GO:0050482) arachidonate transport(GO:1903963) |
| 0.2 |
2.0 |
GO:0035886 |
vascular smooth muscle cell differentiation(GO:0035886) |
| 0.2 |
1.2 |
GO:0097084 |
vascular smooth muscle cell development(GO:0097084) |
| 0.2 |
1.5 |
GO:0060081 |
membrane hyperpolarization(GO:0060081) |
| 0.2 |
0.5 |
GO:1902445 |
regulation of mitochondrial membrane permeability involved in programmed necrotic cell death(GO:1902445) |
| 0.2 |
1.7 |
GO:0045579 |
positive regulation of B cell differentiation(GO:0045579) |
| 0.2 |
3.7 |
GO:0031507 |
heterochromatin assembly(GO:0031507) |
| 0.2 |
1.5 |
GO:0030578 |
PML body organization(GO:0030578) |
| 0.2 |
1.2 |
GO:0061684 |
chaperone-mediated autophagy(GO:0061684) |
| 0.2 |
0.5 |
GO:0014010 |
Schwann cell proliferation(GO:0014010) |
| 0.2 |
0.5 |
GO:1900748 |
positive regulation of vascular endothelial growth factor signaling pathway(GO:1900748) |
| 0.2 |
0.2 |
GO:0038030 |
non-canonical Wnt signaling pathway via MAPK cascade(GO:0038030) |
| 0.2 |
1.0 |
GO:0043589 |
skin morphogenesis(GO:0043589) |
| 0.2 |
0.7 |
GO:0032755 |
positive regulation of interleukin-6 production(GO:0032755) |
| 0.2 |
3.6 |
GO:0034389 |
lipid particle organization(GO:0034389) |
| 0.2 |
0.7 |
GO:0046104 |
thymidine metabolic process(GO:0046104) |
| 0.2 |
1.2 |
GO:1990440 |
positive regulation of transcription from RNA polymerase II promoter in response to endoplasmic reticulum stress(GO:1990440) |
| 0.2 |
1.5 |
GO:0098789 |
pre-mRNA cleavage required for polyadenylation(GO:0098789) |
| 0.2 |
2.2 |
GO:0070475 |
rRNA base methylation(GO:0070475) |
| 0.2 |
1.7 |
GO:0018344 |
protein geranylgeranylation(GO:0018344) |
| 0.2 |
0.5 |
GO:0030862 |
regulation of polarized epithelial cell differentiation(GO:0030860) positive regulation of polarized epithelial cell differentiation(GO:0030862) |
| 0.2 |
2.1 |
GO:0019243 |
methylglyoxal catabolic process to D-lactate via S-lactoyl-glutathione(GO:0019243) methylglyoxal catabolic process(GO:0051596) methylglyoxal catabolic process to lactate(GO:0061727) |
| 0.2 |
1.4 |
GO:0035988 |
chondrocyte proliferation(GO:0035988) |
| 0.2 |
1.6 |
GO:0016139 |
glycoside catabolic process(GO:0016139) |
| 0.2 |
0.5 |
GO:1904742 |
regulation of telomeric DNA binding(GO:1904742) |
| 0.2 |
0.7 |
GO:0071947 |
protein deubiquitination involved in ubiquitin-dependent protein catabolic process(GO:0071947) |
| 0.2 |
1.2 |
GO:0006561 |
proline biosynthetic process(GO:0006561) |
| 0.2 |
0.7 |
GO:0032815 |
negative regulation of natural killer cell activation(GO:0032815) |
| 0.2 |
1.4 |
GO:0043551 |
regulation of phosphatidylinositol 3-kinase activity(GO:0043551) |
| 0.2 |
1.6 |
GO:0006703 |
estrogen biosynthetic process(GO:0006703) |
| 0.2 |
4.3 |
GO:0035162 |
embryonic hemopoiesis(GO:0035162) |
| 0.2 |
0.7 |
GO:0046459 |
short-chain fatty acid metabolic process(GO:0046459) |
| 0.2 |
0.9 |
GO:0070589 |
cell wall mannoprotein biosynthetic process(GO:0000032) mannoprotein metabolic process(GO:0006056) mannoprotein biosynthetic process(GO:0006057) cell wall glycoprotein biosynthetic process(GO:0031506) cell wall biogenesis(GO:0042546) cell wall macromolecule metabolic process(GO:0044036) cell wall macromolecule biosynthetic process(GO:0044038) chain elongation of O-linked mannose residue(GO:0044845) cellular component macromolecule biosynthetic process(GO:0070589) cell wall organization or biogenesis(GO:0071554) |
| 0.2 |
1.3 |
GO:0086064 |
cell communication by electrical coupling involved in cardiac conduction(GO:0086064) regulation of cell communication by electrical coupling involved in cardiac conduction(GO:1901844) |
| 0.2 |
0.9 |
GO:0035562 |
negative regulation of chromatin binding(GO:0035562) |
| 0.2 |
0.2 |
GO:0045541 |
negative regulation of cholesterol biosynthetic process(GO:0045541) negative regulation of cholesterol metabolic process(GO:0090206) |
| 0.2 |
0.4 |
GO:1901798 |
positive regulation of signal transduction by p53 class mediator(GO:1901798) |
| 0.2 |
0.2 |
GO:1902534 |
single-organism membrane invagination(GO:1902534) |
| 0.2 |
1.1 |
GO:0006363 |
termination of RNA polymerase I transcription(GO:0006363) |
| 0.2 |
0.2 |
GO:0010801 |
negative regulation of peptidyl-threonine phosphorylation(GO:0010801) |
| 0.2 |
0.4 |
GO:0016081 |
synaptic vesicle docking(GO:0016081) |
| 0.2 |
2.0 |
GO:0070995 |
NADPH oxidation(GO:0070995) |
| 0.2 |
0.2 |
GO:0010616 |
negative regulation of cardiac muscle adaptation(GO:0010616) |
| 0.2 |
1.5 |
GO:0017144 |
drug metabolic process(GO:0017144) |
| 0.2 |
0.9 |
GO:0016266 |
O-glycan processing(GO:0016266) |
| 0.2 |
2.4 |
GO:0050884 |
neuromuscular process controlling posture(GO:0050884) |
| 0.2 |
10.9 |
GO:0031338 |
regulation of vesicle fusion(GO:0031338) |
| 0.2 |
6.3 |
GO:0016578 |
histone deubiquitination(GO:0016578) |
| 0.2 |
0.9 |
GO:0071028 |
nuclear RNA surveillance(GO:0071027) nuclear mRNA surveillance(GO:0071028) |
| 0.2 |
0.2 |
GO:0045414 |
regulation of interleukin-8 biosynthetic process(GO:0045414) |
| 0.2 |
0.9 |
GO:0042256 |
mature ribosome assembly(GO:0042256) |
| 0.2 |
0.4 |
GO:0061511 |
centriole elongation(GO:0061511) |
| 0.2 |
1.3 |
GO:0007016 |
cytoskeletal anchoring at plasma membrane(GO:0007016) |
| 0.2 |
6.9 |
GO:0021515 |
cell differentiation in spinal cord(GO:0021515) |
| 0.2 |
0.6 |
GO:0035247 |
peptidyl-arginine omega-N-methylation(GO:0035247) |
| 0.2 |
0.6 |
GO:0042182 |
ketone catabolic process(GO:0042182) |
| 0.2 |
1.3 |
GO:0048680 |
positive regulation of axon regeneration(GO:0048680) positive regulation of neuron projection regeneration(GO:0070572) |
| 0.2 |
7.7 |
GO:2001238 |
positive regulation of extrinsic apoptotic signaling pathway(GO:2001238) |
| 0.2 |
0.6 |
GO:0003157 |
endocardium development(GO:0003157) |
| 0.2 |
0.8 |
GO:0000379 |
tRNA-type intron splice site recognition and cleavage(GO:0000379) |
| 0.2 |
0.4 |
GO:0002572 |
pro-T cell differentiation(GO:0002572) |
| 0.2 |
5.7 |
GO:0090162 |
establishment of epithelial cell polarity(GO:0090162) |
| 0.2 |
0.8 |
GO:1901660 |
calcium ion export(GO:1901660) |
| 0.2 |
0.2 |
GO:0048715 |
negative regulation of oligodendrocyte differentiation(GO:0048715) |
| 0.2 |
0.2 |
GO:0042726 |
flavin-containing compound metabolic process(GO:0042726) |
| 0.2 |
0.4 |
GO:1900368 |
regulation of RNA interference(GO:1900368) |
| 0.2 |
0.6 |
GO:0010832 |
negative regulation of myotube differentiation(GO:0010832) |
| 0.2 |
0.8 |
GO:0042796 |
snRNA transcription from RNA polymerase III promoter(GO:0042796) |
| 0.2 |
0.6 |
GO:0045743 |
positive regulation of fibroblast growth factor receptor signaling pathway(GO:0045743) |
| 0.2 |
0.6 |
GO:0010499 |
proteasomal ubiquitin-independent protein catabolic process(GO:0010499) |
| 0.2 |
0.6 |
GO:0045162 |
clustering of voltage-gated sodium channels(GO:0045162) |
| 0.2 |
1.4 |
GO:0032525 |
somite rostral/caudal axis specification(GO:0032525) |
| 0.2 |
0.4 |
GO:0035813 |
renal sodium excretion(GO:0035812) regulation of renal sodium excretion(GO:0035813) |
| 0.2 |
1.2 |
GO:0015015 |
heparan sulfate proteoglycan biosynthetic process, enzymatic modification(GO:0015015) |
| 0.2 |
1.2 |
GO:1902998 |
positive regulation of neurofibrillary tangle assembly(GO:1902998) |
| 0.2 |
2.6 |
GO:0042178 |
xenobiotic catabolic process(GO:0042178) |
| 0.2 |
0.6 |
GO:0006556 |
S-adenosylmethionine biosynthetic process(GO:0006556) |
| 0.2 |
0.6 |
GO:0042560 |
10-formyltetrahydrofolate catabolic process(GO:0009258) folic acid-containing compound catabolic process(GO:0009397) pteridine-containing compound catabolic process(GO:0042560) |
| 0.2 |
0.8 |
GO:0055071 |
cellular manganese ion homeostasis(GO:0030026) Golgi calcium ion homeostasis(GO:0032468) manganese ion homeostasis(GO:0055071) |
| 0.2 |
0.2 |
GO:0060125 |
negative regulation of growth hormone secretion(GO:0060125) |
| 0.2 |
0.4 |
GO:0045647 |
negative regulation of erythrocyte differentiation(GO:0045647) |
| 0.2 |
0.4 |
GO:2000409 |
positive regulation of T cell extravasation(GO:2000409) |
| 0.2 |
0.2 |
GO:0030859 |
polarized epithelial cell differentiation(GO:0030859) |
| 0.2 |
2.3 |
GO:0043982 |
histone H4-K5 acetylation(GO:0043981) histone H4-K8 acetylation(GO:0043982) |
| 0.2 |
0.6 |
GO:0070358 |
actin polymerization-dependent cell motility(GO:0070358) |
| 0.2 |
3.3 |
GO:0048266 |
behavioral response to pain(GO:0048266) |
| 0.2 |
0.4 |
GO:0035964 |
COPI-coated vesicle budding(GO:0035964) |
| 0.2 |
0.6 |
GO:0090069 |
regulation of ribosome biogenesis(GO:0090069) |
| 0.2 |
1.4 |
GO:0051386 |
regulation of neurotrophin TRK receptor signaling pathway(GO:0051386) |
| 0.2 |
2.7 |
GO:2000096 |
positive regulation of Wnt signaling pathway, planar cell polarity pathway(GO:2000096) |
| 0.2 |
3.3 |
GO:0033539 |
fatty acid beta-oxidation using acyl-CoA dehydrogenase(GO:0033539) |
| 0.2 |
0.8 |
GO:0036265 |
RNA (guanine-N7)-methylation(GO:0036265) |
| 0.2 |
0.8 |
GO:0002369 |
T cell cytokine production(GO:0002369) |
| 0.2 |
1.0 |
GO:0006353 |
DNA-templated transcription, termination(GO:0006353) |
| 0.2 |
1.3 |
GO:0060218 |
hematopoietic stem cell differentiation(GO:0060218) |
| 0.2 |
0.8 |
GO:0007258 |
JUN phosphorylation(GO:0007258) |
| 0.2 |
0.6 |
GO:0006436 |
tryptophanyl-tRNA aminoacylation(GO:0006436) |
| 0.2 |
0.6 |
GO:0044028 |
DNA hypomethylation(GO:0044028) hypomethylation of CpG island(GO:0044029) |
| 0.2 |
0.6 |
GO:0006166 |
purine ribonucleoside salvage(GO:0006166) |
| 0.2 |
0.4 |
GO:0042977 |
activation of JAK2 kinase activity(GO:0042977) |
| 0.2 |
1.3 |
GO:1903301 |
positive regulation of glucokinase activity(GO:0033133) positive regulation of hexokinase activity(GO:1903301) |
| 0.2 |
0.4 |
GO:0042940 |
D-amino acid transport(GO:0042940) |
| 0.2 |
0.4 |
GO:0060263 |
regulation of respiratory burst(GO:0060263) |
| 0.2 |
0.6 |
GO:1990046 |
positive regulation of mitochondrial DNA replication(GO:0090297) regulation of cardiolipin metabolic process(GO:1900208) positive regulation of cardiolipin metabolic process(GO:1900210) positive regulation of mitochondrial DNA metabolic process(GO:1901860) stress-induced mitochondrial fusion(GO:1990046) |
| 0.2 |
2.0 |
GO:0051103 |
DNA ligation involved in DNA repair(GO:0051103) |
| 0.2 |
0.4 |
GO:0090188 |
negative regulation of pancreatic juice secretion(GO:0090188) |
| 0.2 |
0.9 |
GO:0070828 |
heterochromatin organization(GO:0070828) |
| 0.2 |
0.4 |
GO:0042045 |
epithelial fluid transport(GO:0042045) |
| 0.2 |
0.7 |
GO:0006182 |
cGMP biosynthetic process(GO:0006182) |
| 0.2 |
2.0 |
GO:1901984 |
negative regulation of protein acetylation(GO:1901984) negative regulation of peptidyl-lysine acetylation(GO:2000757) |
| 0.2 |
0.4 |
GO:0008635 |
activation of cysteine-type endopeptidase activity involved in apoptotic process by cytochrome c(GO:0008635) |
| 0.2 |
2.3 |
GO:0002115 |
store-operated calcium entry(GO:0002115) |
| 0.2 |
4.5 |
GO:0071347 |
cellular response to interleukin-1(GO:0071347) |
| 0.2 |
1.1 |
GO:2000653 |
regulation of genetic imprinting(GO:2000653) |
| 0.2 |
0.7 |
GO:0045671 |
negative regulation of osteoclast differentiation(GO:0045671) |
| 0.2 |
1.1 |
GO:0036066 |
protein O-linked fucosylation(GO:0036066) |
| 0.2 |
3.8 |
GO:0061014 |
positive regulation of mRNA catabolic process(GO:0061014) |
| 0.2 |
1.0 |
GO:0050810 |
regulation of steroid biosynthetic process(GO:0050810) |
| 0.2 |
1.4 |
GO:0010574 |
regulation of vascular endothelial growth factor production(GO:0010574) |
| 0.2 |
0.9 |
GO:0042866 |
pyruvate biosynthetic process(GO:0042866) |
| 0.2 |
0.5 |
GO:0097461 |
ferric iron import(GO:0033216) ferric iron import into cell(GO:0097461) |
| 0.2 |
3.3 |
GO:0000266 |
mitochondrial fission(GO:0000266) |
| 0.2 |
1.2 |
GO:0006828 |
manganese ion transport(GO:0006828) |
| 0.2 |
0.7 |
GO:0000393 |
spliceosomal conformational changes to generate catalytic conformation(GO:0000393) |
| 0.2 |
0.7 |
GO:2000288 |
nuclear speck organization(GO:0035063) positive regulation of myoblast proliferation(GO:2000288) |
| 0.2 |
0.5 |
GO:0002036 |
regulation of L-glutamate transport(GO:0002036) |
| 0.2 |
0.7 |
GO:0071787 |
endoplasmic reticulum tubular network assembly(GO:0071787) |
| 0.2 |
0.7 |
GO:0032049 |
cardiolipin biosynthetic process(GO:0032049) |
| 0.2 |
0.8 |
GO:0010025 |
wax biosynthetic process(GO:0010025) wax metabolic process(GO:0010166) |
| 0.2 |
0.2 |
GO:0010835 |
regulation of protein ADP-ribosylation(GO:0010835) |
| 0.2 |
0.2 |
GO:0002934 |
desmosome organization(GO:0002934) |
| 0.2 |
0.8 |
GO:0010724 |
regulation of definitive erythrocyte differentiation(GO:0010724) |
| 0.2 |
2.7 |
GO:0006744 |
ubiquinone biosynthetic process(GO:0006744) quinone biosynthetic process(GO:1901663) |
| 0.2 |
10.8 |
GO:0006821 |
chloride transport(GO:0006821) |
| 0.2 |
1.3 |
GO:0071364 |
cellular response to epidermal growth factor stimulus(GO:0071364) |
| 0.2 |
0.3 |
GO:0046548 |
retinal rod cell development(GO:0046548) |
| 0.2 |
0.3 |
GO:0042663 |
regulation of endodermal cell fate specification(GO:0042663) |
| 0.2 |
0.7 |
GO:0002566 |
somatic diversification of immune receptors via somatic mutation(GO:0002566) somatic hypermutation of immunoglobulin genes(GO:0016446) |
| 0.2 |
0.5 |
GO:0060907 |
positive regulation of macrophage cytokine production(GO:0060907) |
| 0.2 |
1.1 |
GO:0040034 |
regulation of development, heterochronic(GO:0040034) |
| 0.2 |
2.8 |
GO:0048246 |
macrophage chemotaxis(GO:0048246) |
| 0.2 |
0.3 |
GO:0034729 |
histone H3-K79 methylation(GO:0034729) |
| 0.2 |
1.0 |
GO:0035635 |
entry of bacterium into host cell(GO:0035635) regulation of entry of bacterium into host cell(GO:2000535) |
| 0.2 |
0.3 |
GO:0006624 |
vacuolar protein processing(GO:0006624) |
| 0.2 |
0.8 |
GO:0034316 |
negative regulation of Arp2/3 complex-mediated actin nucleation(GO:0034316) negative regulation of actin nucleation(GO:0051126) |
| 0.2 |
0.5 |
GO:1902605 |
heterotrimeric G-protein complex assembly(GO:1902605) |
| 0.2 |
0.8 |
GO:0010640 |
regulation of platelet-derived growth factor receptor signaling pathway(GO:0010640) |
| 0.2 |
0.8 |
GO:0030969 |
mRNA splicing via endonucleolytic cleavage and ligation involved in unfolded protein response(GO:0030969) mRNA splicing, via endonucleolytic cleavage and ligation(GO:0070054) mRNA endonucleolytic cleavage involved in unfolded protein response(GO:0070055) |
| 0.2 |
0.2 |
GO:1903071 |
positive regulation of ER-associated ubiquitin-dependent protein catabolic process(GO:1903071) |
| 0.2 |
1.6 |
GO:0006490 |
oligosaccharide-lipid intermediate biosynthetic process(GO:0006490) |
| 0.2 |
2.2 |
GO:0000737 |
DNA catabolic process, endonucleolytic(GO:0000737) |
| 0.2 |
1.6 |
GO:0036342 |
post-anal tail morphogenesis(GO:0036342) |
| 0.2 |
1.0 |
GO:0006878 |
cellular copper ion homeostasis(GO:0006878) |
| 0.2 |
0.8 |
GO:0000727 |
double-strand break repair via break-induced replication(GO:0000727) |
| 0.2 |
0.8 |
GO:0016601 |
Rac protein signal transduction(GO:0016601) |
| 0.2 |
0.8 |
GO:0060736 |
prostate gland growth(GO:0060736) |
| 0.2 |
3.5 |
GO:0007218 |
neuropeptide signaling pathway(GO:0007218) |
| 0.2 |
0.5 |
GO:0061756 |
leukocyte tethering or rolling(GO:0050901) leukocyte adhesion to vascular endothelial cell(GO:0061756) |
| 0.2 |
1.4 |
GO:0045792 |
negative regulation of cell size(GO:0045792) |
| 0.2 |
0.5 |
GO:0006283 |
transcription-coupled nucleotide-excision repair(GO:0006283) |
| 0.2 |
0.3 |
GO:0002408 |
myeloid dendritic cell chemotaxis(GO:0002408) |
| 0.2 |
0.3 |
GO:1903772 |
regulation of viral budding via host ESCRT complex(GO:1903772) |
| 0.2 |
0.5 |
GO:0060749 |
mammary gland alveolus development(GO:0060749) mammary gland lobule development(GO:0061377) |
| 0.2 |
0.8 |
GO:0034227 |
tRNA thio-modification(GO:0034227) |
| 0.2 |
1.9 |
GO:0001731 |
formation of translation preinitiation complex(GO:0001731) |
| 0.2 |
0.3 |
GO:0015014 |
heparan sulfate proteoglycan biosynthetic process, polysaccharide chain biosynthetic process(GO:0015014) |
| 0.2 |
1.2 |
GO:0090385 |
phagosome-lysosome fusion(GO:0090385) |
| 0.2 |
0.5 |
GO:0000972 |
transcription-dependent tethering of RNA polymerase II gene DNA at nuclear periphery(GO:0000972) |
| 0.2 |
0.5 |
GO:0034182 |
regulation of maintenance of sister chromatid cohesion(GO:0034091) positive regulation of maintenance of sister chromatid cohesion(GO:0034093) regulation of maintenance of mitotic sister chromatid cohesion(GO:0034182) positive regulation of maintenance of mitotic sister chromatid cohesion(GO:0034184) positive regulation of sister chromatid cohesion(GO:0045876) |
| 0.2 |
1.4 |
GO:0032094 |
response to food(GO:0032094) |
| 0.1 |
0.1 |
GO:2001181 |
positive regulation of interleukin-10 secretion(GO:2001181) |
| 0.1 |
0.1 |
GO:0097154 |
GABAergic neuron differentiation(GO:0097154) |
| 0.1 |
1.5 |
GO:0060586 |
multicellular organismal iron ion homeostasis(GO:0060586) |
| 0.1 |
1.8 |
GO:0008053 |
mitochondrial fusion(GO:0008053) |
| 0.1 |
1.6 |
GO:0090503 |
RNA phosphodiester bond hydrolysis, exonucleolytic(GO:0090503) |
| 0.1 |
1.2 |
GO:0014898 |
muscle hypertrophy in response to stress(GO:0003299) cardiac muscle hypertrophy in response to stress(GO:0014898) |
| 0.1 |
0.9 |
GO:0051560 |
mitochondrial calcium ion homeostasis(GO:0051560) |
| 0.1 |
0.3 |
GO:0043504 |
mitochondrial DNA repair(GO:0043504) |
| 0.1 |
0.7 |
GO:0036337 |
Fas signaling pathway(GO:0036337) |
| 0.1 |
0.4 |
GO:0014003 |
oligodendrocyte development(GO:0014003) |
| 0.1 |
0.1 |
GO:0032365 |
intracellular lipid transport(GO:0032365) |
| 0.1 |
1.0 |
GO:0042126 |
nitrate metabolic process(GO:0042126) |
| 0.1 |
1.4 |
GO:0000394 |
RNA splicing, via endonucleolytic cleavage and ligation(GO:0000394) |
| 0.1 |
0.7 |
GO:2000772 |
regulation of cellular senescence(GO:2000772) |
| 0.1 |
0.6 |
GO:0045906 |
negative regulation of vasoconstriction(GO:0045906) |
| 0.1 |
0.1 |
GO:1901509 |
regulation of endothelial tube morphogenesis(GO:1901509) |
| 0.1 |
1.7 |
GO:0015693 |
magnesium ion transport(GO:0015693) |
| 0.1 |
0.6 |
GO:0042148 |
strand invasion(GO:0042148) |
| 0.1 |
0.3 |
GO:0050908 |
detection of light stimulus involved in visual perception(GO:0050908) detection of light stimulus involved in sensory perception(GO:0050962) |
| 0.1 |
0.4 |
GO:0034243 |
regulation of transcription elongation from RNA polymerase II promoter(GO:0034243) |
| 0.1 |
0.3 |
GO:0030997 |
regulation of centriole-centriole cohesion(GO:0030997) |
| 0.1 |
0.6 |
GO:0060768 |
epithelial cell proliferation involved in prostate gland development(GO:0060767) regulation of epithelial cell proliferation involved in prostate gland development(GO:0060768) negative regulation of epithelial cell proliferation involved in prostate gland development(GO:0060770) |
| 0.1 |
0.7 |
GO:0071260 |
cellular response to mechanical stimulus(GO:0071260) |
| 0.1 |
2.5 |
GO:0044342 |
type B pancreatic cell proliferation(GO:0044342) |
| 0.1 |
0.8 |
GO:0014823 |
response to activity(GO:0014823) |
| 0.1 |
2.2 |
GO:0060325 |
face morphogenesis(GO:0060325) |
| 0.1 |
1.2 |
GO:1990403 |
embryonic brain development(GO:1990403) |
| 0.1 |
0.3 |
GO:0071354 |
cellular response to interleukin-6(GO:0071354) |
| 0.1 |
0.3 |
GO:1903895 |
negative regulation of IRE1-mediated unfolded protein response(GO:1903895) |
| 0.1 |
0.9 |
GO:0098532 |
histone H3-K27 trimethylation(GO:0098532) |
| 0.1 |
1.1 |
GO:0071816 |
protein insertion into ER membrane(GO:0045048) tail-anchored membrane protein insertion into ER membrane(GO:0071816) |
| 0.1 |
0.4 |
GO:2000272 |
negative regulation of receptor activity(GO:2000272) |
| 0.1 |
1.2 |
GO:0018095 |
protein polyglutamylation(GO:0018095) |
| 0.1 |
2.5 |
GO:0015991 |
energy coupled proton transmembrane transport, against electrochemical gradient(GO:0015988) ATP hydrolysis coupled proton transport(GO:0015991) ATP hydrolysis coupled transmembrane transport(GO:0090662) |
| 0.1 |
0.7 |
GO:0006308 |
DNA catabolic process(GO:0006308) |
| 0.1 |
0.3 |
GO:0000965 |
mitochondrial RNA 3'-end processing(GO:0000965) |
| 0.1 |
0.1 |
GO:0006498 |
N-terminal protein lipidation(GO:0006498) |
| 0.1 |
0.3 |
GO:0061430 |
bone trabecula morphogenesis(GO:0061430) |
| 0.1 |
0.9 |
GO:0033683 |
nucleotide-excision repair, DNA incision(GO:0033683) |
| 0.1 |
0.3 |
GO:0006610 |
ribosomal protein import into nucleus(GO:0006610) |
| 0.1 |
1.8 |
GO:0000002 |
mitochondrial genome maintenance(GO:0000002) |
| 0.1 |
0.8 |
GO:0061669 |
spontaneous neurotransmitter secretion(GO:0061669) spontaneous synaptic transmission(GO:0098814) |
| 0.1 |
0.3 |
GO:1903599 |
positive regulation of mitophagy(GO:1903599) |
| 0.1 |
0.4 |
GO:0006287 |
base-excision repair, gap-filling(GO:0006287) |
| 0.1 |
0.1 |
GO:1900026 |
positive regulation of substrate adhesion-dependent cell spreading(GO:1900026) |
| 0.1 |
0.4 |
GO:1900060 |
negative regulation of sphingolipid biosynthetic process(GO:0090155) cellular sphingolipid homeostasis(GO:0090156) negative regulation of ceramide biosynthetic process(GO:1900060) |
| 0.1 |
0.1 |
GO:2000468 |
negative regulation of nitric-oxide synthase biosynthetic process(GO:0051771) regulation of peroxidase activity(GO:2000468) |
| 0.1 |
0.2 |
GO:0071340 |
skeletal muscle acetylcholine-gated channel clustering(GO:0071340) |
| 0.1 |
0.2 |
GO:0034088 |
maintenance of sister chromatid cohesion(GO:0034086) maintenance of mitotic sister chromatid cohesion(GO:0034088) |
| 0.1 |
0.1 |
GO:0060413 |
atrial septum morphogenesis(GO:0060413) |
| 0.1 |
2.5 |
GO:0006491 |
N-glycan processing(GO:0006491) |
| 0.1 |
0.2 |
GO:0035948 |
positive regulation of gluconeogenesis by positive regulation of transcription from RNA polymerase II promoter(GO:0035948) regulation of cellular ketone metabolic process by positive regulation of transcription from RNA polymerase II promoter(GO:0072366) |
| 0.1 |
0.4 |
GO:0002716 |
negative regulation of natural killer cell mediated immunity(GO:0002716) negative regulation of natural killer cell mediated cytotoxicity(GO:0045953) |
| 0.1 |
0.4 |
GO:0019885 |
antigen processing and presentation of endogenous peptide antigen via MHC class I(GO:0019885) |
| 0.1 |
2.1 |
GO:0032981 |
NADH dehydrogenase complex assembly(GO:0010257) mitochondrial respiratory chain complex I assembly(GO:0032981) mitochondrial respiratory chain complex I biogenesis(GO:0097031) |
| 0.1 |
2.5 |
GO:0003333 |
amino acid transmembrane transport(GO:0003333) |
| 0.1 |
0.5 |
GO:0035511 |
oxidative DNA demethylation(GO:0035511) |
| 0.1 |
0.5 |
GO:0006622 |
protein targeting to lysosome(GO:0006622) |
| 0.1 |
2.3 |
GO:0007257 |
activation of JUN kinase activity(GO:0007257) |
| 0.1 |
0.1 |
GO:0071034 |
CUT catabolic process(GO:0071034) CUT metabolic process(GO:0071043) |
| 0.1 |
2.9 |
GO:0008333 |
endosome to lysosome transport(GO:0008333) |
| 0.1 |
0.5 |
GO:0048305 |
immunoglobulin secretion(GO:0048305) |
| 0.1 |
0.4 |
GO:0032530 |
regulation of microvillus organization(GO:0032530) |
| 0.1 |
0.8 |
GO:0045200 |
establishment or maintenance of neuroblast polarity(GO:0045196) establishment of neuroblast polarity(GO:0045200) |
| 0.1 |
0.2 |
GO:0014719 |
skeletal muscle satellite cell activation(GO:0014719) |
| 0.1 |
0.5 |
GO:0006041 |
glucosamine metabolic process(GO:0006041) |
| 0.1 |
1.4 |
GO:0016242 |
negative regulation of macroautophagy(GO:0016242) |
| 0.1 |
2.8 |
GO:0046854 |
phosphatidylinositol phosphorylation(GO:0046854) |
| 0.1 |
0.3 |
GO:0036228 |
protein targeting to nuclear inner membrane(GO:0036228) |
| 0.1 |
0.8 |
GO:0007041 |
lysosomal transport(GO:0007041) |
| 0.1 |
0.3 |
GO:0030539 |
male genitalia development(GO:0030539) |
| 0.1 |
0.3 |
GO:0046654 |
tetrahydrofolate biosynthetic process(GO:0046654) |
| 0.1 |
0.5 |
GO:0010606 |
positive regulation of cytoplasmic mRNA processing body assembly(GO:0010606) |
| 0.1 |
0.5 |
GO:0006003 |
fructose 2,6-bisphosphate metabolic process(GO:0006003) |
| 0.1 |
0.2 |
GO:0035106 |
operant conditioning(GO:0035106) |
| 0.1 |
0.4 |
GO:0046475 |
glycerophospholipid catabolic process(GO:0046475) |
| 0.1 |
0.3 |
GO:0019372 |
lipoxygenase pathway(GO:0019372) |
| 0.1 |
1.1 |
GO:0007097 |
nuclear migration(GO:0007097) |
| 0.1 |
0.3 |
GO:0008295 |
spermidine biosynthetic process(GO:0008295) |
| 0.1 |
0.1 |
GO:0002925 |
positive regulation of humoral immune response mediated by circulating immunoglobulin(GO:0002925) |
| 0.1 |
0.9 |
GO:0000301 |
retrograde transport, vesicle recycling within Golgi(GO:0000301) |
| 0.1 |
0.1 |
GO:1903847 |
regulation of aorta morphogenesis(GO:1903847) positive regulation of aorta morphogenesis(GO:1903849) |
| 0.1 |
4.1 |
GO:0006487 |
protein N-linked glycosylation(GO:0006487) |
| 0.1 |
0.4 |
GO:0010165 |
response to X-ray(GO:0010165) |
| 0.1 |
0.4 |
GO:0021904 |
dorsal/ventral neural tube patterning(GO:0021904) |
| 0.1 |
1.3 |
GO:0006044 |
N-acetylglucosamine metabolic process(GO:0006044) |
| 0.1 |
0.2 |
GO:0035590 |
purinergic nucleotide receptor signaling pathway(GO:0035590) |
| 0.1 |
0.3 |
GO:2001197 |
regulation of basement membrane assembly involved in embryonic body morphogenesis(GO:1904259) positive regulation of basement membrane assembly involved in embryonic body morphogenesis(GO:1904261) basement membrane assembly involved in embryonic body morphogenesis(GO:2001197) |
| 0.1 |
0.1 |
GO:1902893 |
regulation of pri-miRNA transcription from RNA polymerase II promoter(GO:1902893) |
| 0.1 |
0.6 |
GO:0016576 |
histone dephosphorylation(GO:0016576) |
| 0.1 |
1.5 |
GO:0007229 |
integrin-mediated signaling pathway(GO:0007229) |
| 0.1 |
0.6 |
GO:0031167 |
rRNA methylation(GO:0031167) |
| 0.1 |
0.3 |
GO:2000645 |
negative regulation of receptor catabolic process(GO:2000645) |
| 0.1 |
0.8 |
GO:0042059 |
negative regulation of epidermal growth factor receptor signaling pathway(GO:0042059) negative regulation of ERBB signaling pathway(GO:1901185) |
| 0.1 |
0.8 |
GO:0097300 |
programmed necrotic cell death(GO:0097300) |
| 0.1 |
0.4 |
GO:0033601 |
positive regulation of mammary gland epithelial cell proliferation(GO:0033601) |
| 0.1 |
1.2 |
GO:1902236 |
negative regulation of endoplasmic reticulum stress-induced intrinsic apoptotic signaling pathway(GO:1902236) |
| 0.1 |
2.9 |
GO:0051568 |
histone H3-K4 methylation(GO:0051568) |
| 0.1 |
0.5 |
GO:0043247 |
protection from non-homologous end joining at telomere(GO:0031848) interstrand cross-link repair(GO:0036297) telomere maintenance in response to DNA damage(GO:0043247) |
| 0.1 |
0.3 |
GO:1903525 |
regulation of membrane tubulation(GO:1903525) |
| 0.1 |
0.2 |
GO:1901491 |
negative regulation of lymphangiogenesis(GO:1901491) |
| 0.1 |
0.1 |
GO:0097070 |
ductus arteriosus closure(GO:0097070) |
| 0.1 |
0.1 |
GO:0001575 |
globoside metabolic process(GO:0001575) |
| 0.1 |
6.3 |
GO:0051965 |
positive regulation of synapse assembly(GO:0051965) |
| 0.1 |
0.4 |
GO:0090527 |
actin filament reorganization(GO:0090527) |
| 0.1 |
1.1 |
GO:2000060 |
positive regulation of protein ubiquitination involved in ubiquitin-dependent protein catabolic process(GO:2000060) |
| 0.1 |
0.6 |
GO:0009235 |
cobalamin metabolic process(GO:0009235) |
| 0.1 |
0.3 |
GO:0032026 |
response to magnesium ion(GO:0032026) |
| 0.1 |
0.9 |
GO:0032801 |
receptor catabolic process(GO:0032801) |
| 0.1 |
2.0 |
GO:0006890 |
retrograde vesicle-mediated transport, Golgi to ER(GO:0006890) |
| 0.1 |
1.0 |
GO:0010388 |
protein deneddylation(GO:0000338) cullin deneddylation(GO:0010388) |
| 0.1 |
1.0 |
GO:0034244 |
negative regulation of transcription elongation from RNA polymerase II promoter(GO:0034244) |
| 0.1 |
0.3 |
GO:0043312 |
neutrophil degranulation(GO:0043312) |
| 0.1 |
1.2 |
GO:0034315 |
regulation of Arp2/3 complex-mediated actin nucleation(GO:0034315) |
| 0.1 |
0.7 |
GO:0048251 |
elastic fiber assembly(GO:0048251) |
| 0.1 |
1.5 |
GO:0060193 |
positive regulation of lipase activity(GO:0060193) |
| 0.1 |
0.1 |
GO:0045448 |
regulation of mitotic cell cycle, embryonic(GO:0009794) mitotic cell cycle, embryonic(GO:0045448) |
| 0.1 |
0.9 |
GO:0070940 |
dephosphorylation of RNA polymerase II C-terminal domain(GO:0070940) |
| 0.1 |
0.9 |
GO:0090136 |
epithelial cell-cell adhesion(GO:0090136) |
| 0.1 |
0.2 |
GO:0032532 |
regulation of microvillus length(GO:0032532) |
| 0.1 |
0.7 |
GO:0000288 |
nuclear-transcribed mRNA catabolic process, deadenylation-dependent decay(GO:0000288) |
| 0.1 |
0.3 |
GO:0035065 |
regulation of histone acetylation(GO:0035065) |
| 0.1 |
0.2 |
GO:0021691 |
cerebellar Purkinje cell layer maturation(GO:0021691) |
| 0.1 |
0.3 |
GO:0015712 |
hexose phosphate transport(GO:0015712) glucose-6-phosphate transport(GO:0015760) |
| 0.1 |
1.1 |
GO:0033344 |
cholesterol efflux(GO:0033344) |
| 0.1 |
0.4 |
GO:0046135 |
pyrimidine ribonucleoside catabolic process(GO:0046133) pyrimidine nucleoside catabolic process(GO:0046135) |
| 0.1 |
0.2 |
GO:0072356 |
chromosome passenger complex localization to kinetochore(GO:0072356) |
| 0.1 |
0.2 |
GO:0070236 |
negative regulation of activation-induced cell death of T cells(GO:0070236) |
| 0.1 |
1.0 |
GO:0080171 |
lysosome organization(GO:0007040) lytic vacuole organization(GO:0080171) |
| 0.1 |
0.3 |
GO:0030950 |
establishment or maintenance of actin cytoskeleton polarity(GO:0030950) |
| 0.1 |
1.2 |
GO:0045879 |
negative regulation of smoothened signaling pathway(GO:0045879) |
| 0.1 |
1.3 |
GO:1902307 |
positive regulation of sodium ion transmembrane transport(GO:1902307) |
| 0.1 |
0.7 |
GO:0051382 |
kinetochore assembly(GO:0051382) |
| 0.1 |
0.2 |
GO:0043084 |
penile erection(GO:0043084) |
| 0.1 |
0.4 |
GO:0048563 |
post-embryonic organ morphogenesis(GO:0048563) |
| 0.1 |
0.4 |
GO:0070914 |
UV-damage excision repair(GO:0070914) |
| 0.1 |
0.5 |
GO:0010457 |
centriole-centriole cohesion(GO:0010457) |
| 0.1 |
1.1 |
GO:1903307 |
positive regulation of regulated secretory pathway(GO:1903307) |
| 0.1 |
1.1 |
GO:0035518 |
histone H2A monoubiquitination(GO:0035518) |
| 0.1 |
0.7 |
GO:0007000 |
nucleolus organization(GO:0007000) |
| 0.1 |
0.2 |
GO:0010884 |
positive regulation of lipid storage(GO:0010884) |
| 0.1 |
0.5 |
GO:0016255 |
attachment of GPI anchor to protein(GO:0016255) |
| 0.1 |
0.3 |
GO:0045217 |
cell-cell junction maintenance(GO:0045217) |
| 0.1 |
2.5 |
GO:0001881 |
receptor recycling(GO:0001881) |
| 0.1 |
0.4 |
GO:2001212 |
regulation of vasculogenesis(GO:2001212) |
| 0.1 |
0.2 |
GO:0044252 |
negative regulation of multicellular organismal metabolic process(GO:0044252) |
| 0.1 |
0.1 |
GO:0051956 |
negative regulation of amino acid transport(GO:0051956) |
| 0.1 |
1.3 |
GO:0070528 |
protein kinase C signaling(GO:0070528) |
| 0.1 |
0.3 |
GO:0003365 |
establishment of cell polarity involved in ameboidal cell migration(GO:0003365) |
| 0.1 |
1.9 |
GO:0006891 |
intra-Golgi vesicle-mediated transport(GO:0006891) |
| 0.1 |
0.2 |
GO:0070831 |
basement membrane assembly(GO:0070831) extracellular matrix assembly(GO:0085029) |
| 0.1 |
0.3 |
GO:0045646 |
regulation of erythrocyte differentiation(GO:0045646) |
| 0.1 |
2.3 |
GO:0034605 |
cellular response to heat(GO:0034605) |
| 0.1 |
0.6 |
GO:0032651 |
regulation of interleukin-1 beta production(GO:0032651) |
| 0.1 |
0.3 |
GO:0018149 |
peptide cross-linking(GO:0018149) |
| 0.1 |
1.0 |
GO:0033327 |
Leydig cell differentiation(GO:0033327) |
| 0.1 |
0.2 |
GO:1902109 |
negative regulation of mitochondrial membrane permeability involved in apoptotic process(GO:1902109) |
| 0.1 |
0.2 |
GO:0010800 |
positive regulation of peptidyl-threonine phosphorylation(GO:0010800) |
| 0.1 |
1.4 |
GO:0034340 |
response to type I interferon(GO:0034340) |
| 0.1 |
0.2 |
GO:0010453 |
regulation of cell fate commitment(GO:0010453) |
| 0.1 |
1.2 |
GO:0042632 |
cholesterol homeostasis(GO:0042632) sterol homeostasis(GO:0055092) |
| 0.1 |
1.0 |
GO:1901985 |
positive regulation of protein acetylation(GO:1901985) |
| 0.1 |
0.9 |
GO:0006111 |
regulation of gluconeogenesis(GO:0006111) |
| 0.1 |
0.4 |
GO:0031293 |
membrane protein intracellular domain proteolysis(GO:0031293) |
| 0.1 |
0.5 |
GO:0051220 |
cytoplasmic sequestering of protein(GO:0051220) |
| 0.1 |
0.2 |
GO:0046726 |
positive regulation by virus of viral protein levels in host cell(GO:0046726) |
| 0.1 |
0.9 |
GO:0051647 |
nucleus localization(GO:0051647) |
| 0.1 |
0.2 |
GO:0051084 |
'de novo' protein folding(GO:0006458) 'de novo' posttranslational protein folding(GO:0051084) chaperone mediated protein folding requiring cofactor(GO:0051085) |
| 0.1 |
1.8 |
GO:0018208 |
peptidyl-proline modification(GO:0018208) |
| 0.1 |
0.4 |
GO:0006123 |
mitochondrial electron transport, cytochrome c to oxygen(GO:0006123) |
| 0.1 |
0.2 |
GO:1902042 |
negative regulation of extrinsic apoptotic signaling pathway via death domain receptors(GO:1902042) |
| 0.1 |
0.3 |
GO:0010756 |
positive regulation of plasminogen activation(GO:0010756) |
| 0.1 |
0.2 |
GO:0060677 |
ureteric bud elongation(GO:0060677) |
| 0.1 |
0.4 |
GO:0051770 |
positive regulation of nitric-oxide synthase biosynthetic process(GO:0051770) |
| 0.1 |
0.2 |
GO:0042732 |
D-xylose metabolic process(GO:0042732) |
| 0.1 |
0.5 |
GO:0045604 |
regulation of epidermal cell differentiation(GO:0045604) |
| 0.1 |
0.5 |
GO:0042574 |
retinal metabolic process(GO:0042574) |
| 0.1 |
0.2 |
GO:1902255 |
positive regulation of intrinsic apoptotic signaling pathway by p53 class mediator(GO:1902255) |
| 0.1 |
0.2 |
GO:2000643 |
positive regulation of early endosome to late endosome transport(GO:2000643) |
| 0.1 |
0.2 |
GO:0015858 |
nucleoside transport(GO:0015858) |
| 0.1 |
0.5 |
GO:0060134 |
prepulse inhibition(GO:0060134) |
| 0.1 |
0.5 |
GO:0003215 |
cardiac right ventricle morphogenesis(GO:0003215) |
| 0.1 |
4.2 |
GO:0006402 |
mRNA catabolic process(GO:0006402) |
| 0.1 |
0.1 |
GO:0046329 |
negative regulation of JNK cascade(GO:0046329) |
| 0.1 |
0.1 |
GO:0042730 |
fibrinolysis(GO:0042730) |
| 0.1 |
0.8 |
GO:0046460 |
triglyceride biosynthetic process(GO:0019432) neutral lipid biosynthetic process(GO:0046460) acylglycerol biosynthetic process(GO:0046463) |
| 0.1 |
1.1 |
GO:0046069 |
cGMP catabolic process(GO:0046069) |
| 0.1 |
0.6 |
GO:0030388 |
fructose 1,6-bisphosphate metabolic process(GO:0030388) |
| 0.1 |
0.2 |
GO:0060385 |
axonogenesis involved in innervation(GO:0060385) |
| 0.1 |
1.0 |
GO:0006767 |
water-soluble vitamin metabolic process(GO:0006767) |
| 0.1 |
0.3 |
GO:0034551 |
respiratory chain complex III assembly(GO:0017062) mitochondrial respiratory chain complex III assembly(GO:0034551) mitochondrial respiratory chain complex III biogenesis(GO:0097033) |
| 0.1 |
1.2 |
GO:0043153 |
entrainment of circadian clock by photoperiod(GO:0043153) |
| 0.1 |
0.3 |
GO:0046697 |
decidualization(GO:0046697) |
| 0.1 |
0.4 |
GO:0070842 |
aggresome assembly(GO:0070842) |
| 0.1 |
0.5 |
GO:0007168 |
receptor guanylyl cyclase signaling pathway(GO:0007168) |
| 0.1 |
0.3 |
GO:0006884 |
cell volume homeostasis(GO:0006884) |
| 0.1 |
0.2 |
GO:1904491 |
protein localization to ciliary transition zone(GO:1904491) |
| 0.1 |
0.3 |
GO:0009212 |
dTTP biosynthetic process(GO:0006235) deoxyribonucleoside triphosphate biosynthetic process(GO:0009202) pyrimidine deoxyribonucleoside triphosphate biosynthetic process(GO:0009212) dTTP metabolic process(GO:0046075) |
| 0.1 |
1.5 |
GO:0021766 |
hippocampus development(GO:0021766) |
| 0.1 |
0.1 |
GO:0045176 |
asymmetric protein localization(GO:0008105) apical protein localization(GO:0045176) |
| 0.1 |
1.6 |
GO:0051973 |
positive regulation of telomerase activity(GO:0051973) |
| 0.1 |
0.6 |
GO:0009072 |
aromatic amino acid family metabolic process(GO:0009072) |
| 0.1 |
0.2 |
GO:0007217 |
tachykinin receptor signaling pathway(GO:0007217) |
| 0.1 |
0.1 |
GO:1902414 |
protein localization to cell junction(GO:1902414) |
| 0.1 |
0.1 |
GO:0046321 |
positive regulation of fatty acid oxidation(GO:0046321) |
| 0.1 |
0.2 |
GO:1903750 |
regulation of intrinsic apoptotic signaling pathway in response to hydrogen peroxide(GO:1903750) negative regulation of intrinsic apoptotic signaling pathway in response to hydrogen peroxide(GO:1903751) |
| 0.1 |
0.4 |
GO:0043482 |
pigment accumulation(GO:0043476) cellular pigment accumulation(GO:0043482) |
| 0.1 |
0.2 |
GO:0007398 |
ectoderm development(GO:0007398) |
| 0.1 |
0.2 |
GO:0045342 |
MHC class II biosynthetic process(GO:0045342) regulation of MHC class II biosynthetic process(GO:0045346) negative regulation of MHC class II biosynthetic process(GO:0045347) |
| 0.1 |
0.1 |
GO:0009313 |
oligosaccharide catabolic process(GO:0009313) |
| 0.1 |
0.4 |
GO:1900037 |
regulation of cellular response to hypoxia(GO:1900037) |
| 0.1 |
0.6 |
GO:0006636 |
unsaturated fatty acid biosynthetic process(GO:0006636) |
| 0.1 |
0.2 |
GO:0006428 |
isoleucyl-tRNA aminoacylation(GO:0006428) |
| 0.1 |
0.1 |
GO:0003433 |
chondrocyte development involved in endochondral bone morphogenesis(GO:0003433) |
| 0.1 |
0.3 |
GO:0001561 |
fatty acid alpha-oxidation(GO:0001561) |
| 0.1 |
0.2 |
GO:0031915 |
positive regulation of synaptic plasticity(GO:0031915) |
| 0.1 |
0.8 |
GO:0070536 |
protein K63-linked deubiquitination(GO:0070536) |
| 0.1 |
0.7 |
GO:0022617 |
extracellular matrix disassembly(GO:0022617) |
| 0.1 |
0.4 |
GO:0006516 |
glycoprotein catabolic process(GO:0006516) |
| 0.1 |
0.1 |
GO:0044339 |
canonical Wnt signaling pathway involved in osteoblast differentiation(GO:0044339) |
| 0.1 |
0.3 |
GO:0018200 |
peptidyl-glutamic acid modification(GO:0018200) |
| 0.1 |
0.1 |
GO:0060447 |
bud outgrowth involved in lung branching(GO:0060447) |
| 0.1 |
0.8 |
GO:0006734 |
NADH metabolic process(GO:0006734) |
| 0.1 |
0.2 |
GO:0035337 |
fatty-acyl-CoA metabolic process(GO:0035337) |
| 0.1 |
0.5 |
GO:0000244 |
spliceosomal tri-snRNP complex assembly(GO:0000244) |
| 0.1 |
0.1 |
GO:0090312 |
positive regulation of protein deacetylation(GO:0090312) |
| 0.1 |
0.3 |
GO:0097119 |
postsynaptic density protein 95 clustering(GO:0097119) |
| 0.1 |
0.5 |
GO:1901343 |
negative regulation of vasculature development(GO:1901343) |
| 0.1 |
4.9 |
GO:0035023 |
regulation of Rho protein signal transduction(GO:0035023) |
| 0.1 |
0.7 |
GO:0070584 |
mitochondrion morphogenesis(GO:0070584) |
| 0.1 |
0.4 |
GO:0006379 |
mRNA cleavage(GO:0006379) |
| 0.1 |
0.1 |
GO:0040016 |
embryonic cleavage(GO:0040016) |
| 0.1 |
0.9 |
GO:1900449 |
regulation of glutamate receptor signaling pathway(GO:1900449) |
| 0.1 |
0.1 |
GO:0010818 |
T cell chemotaxis(GO:0010818) |
| 0.1 |
0.5 |
GO:0048714 |
positive regulation of oligodendrocyte differentiation(GO:0048714) |
| 0.1 |
0.2 |
GO:0034975 |
protein folding in endoplasmic reticulum(GO:0034975) |
| 0.1 |
0.1 |
GO:0060075 |
regulation of resting membrane potential(GO:0060075) |
| 0.1 |
0.2 |
GO:2000210 |
positive regulation of anoikis(GO:2000210) |
| 0.1 |
1.0 |
GO:0035458 |
cellular response to interferon-beta(GO:0035458) |
| 0.0 |
0.2 |
GO:0008206 |
bile acid metabolic process(GO:0008206) |
| 0.0 |
0.1 |
GO:0051026 |
chiasma assembly(GO:0051026) |
| 0.0 |
0.1 |
GO:0007183 |
SMAD protein complex assembly(GO:0007183) |
| 0.0 |
0.3 |
GO:0035904 |
aorta development(GO:0035904) |
| 0.0 |
0.2 |
GO:0060666 |
dichotomous subdivision of terminal units involved in salivary gland branching(GO:0060666) |
| 0.0 |
0.6 |
GO:2000001 |
regulation of DNA damage checkpoint(GO:2000001) |
| 0.0 |
0.8 |
GO:0031532 |
actin cytoskeleton reorganization(GO:0031532) |
| 0.0 |
2.0 |
GO:0090090 |
negative regulation of canonical Wnt signaling pathway(GO:0090090) |
| 0.0 |
0.0 |
GO:0045687 |
positive regulation of glial cell differentiation(GO:0045687) |
| 0.0 |
0.3 |
GO:0042541 |
hemoglobin biosynthetic process(GO:0042541) |
| 0.0 |
0.1 |
GO:0033632 |
regulation of cell-cell adhesion mediated by integrin(GO:0033632) |
| 0.0 |
0.0 |
GO:0035426 |
extracellular matrix-cell signaling(GO:0035426) |
| 0.0 |
0.2 |
GO:0070813 |
hydrogen sulfide metabolic process(GO:0070813) |
| 0.0 |
1.5 |
GO:0045667 |
regulation of osteoblast differentiation(GO:0045667) |
| 0.0 |
0.3 |
GO:0031297 |
replication fork processing(GO:0031297) |
| 0.0 |
0.2 |
GO:0070126 |
mitochondrial translational termination(GO:0070126) |
| 0.0 |
0.3 |
GO:0070734 |
histone H3-K27 methylation(GO:0070734) |
| 0.0 |
0.2 |
GO:0006383 |
transcription from RNA polymerase III promoter(GO:0006383) |
| 0.0 |
0.1 |
GO:0015879 |
carnitine transport(GO:0015879) |
| 0.0 |
0.1 |
GO:1902260 |
negative regulation of delayed rectifier potassium channel activity(GO:1902260) negative regulation of voltage-gated potassium channel activity(GO:1903817) |
| 0.0 |
0.2 |
GO:0002098 |
tRNA wobble uridine modification(GO:0002098) |
| 0.0 |
0.2 |
GO:1902261 |
positive regulation of delayed rectifier potassium channel activity(GO:1902261) positive regulation of voltage-gated potassium channel activity(GO:1903818) |
| 0.0 |
0.1 |
GO:0035909 |
aorta morphogenesis(GO:0035909) |
| 0.0 |
0.3 |
GO:0000466 |
maturation of 5.8S rRNA from tricistronic rRNA transcript (SSU-rRNA, 5.8S rRNA, LSU-rRNA)(GO:0000466) |
| 0.0 |
0.1 |
GO:0071397 |
cellular response to cholesterol(GO:0071397) |
| 0.0 |
0.1 |
GO:0006359 |
regulation of transcription from RNA polymerase III promoter(GO:0006359) |
| 0.0 |
0.2 |
GO:0060976 |
coronary vasculature development(GO:0060976) |
| 0.0 |
0.4 |
GO:0046500 |
S-adenosylmethionine metabolic process(GO:0046500) |
| 0.0 |
0.1 |
GO:0009052 |
pentose-phosphate shunt, non-oxidative branch(GO:0009052) |
| 0.0 |
0.3 |
GO:0010603 |
regulation of cytoplasmic mRNA processing body assembly(GO:0010603) |
| 0.0 |
0.1 |
GO:0006451 |
selenocysteine incorporation(GO:0001514) translational readthrough(GO:0006451) |
| 0.0 |
0.3 |
GO:0000188 |
inactivation of MAPK activity(GO:0000188) |
| 0.0 |
0.4 |
GO:0060480 |
lung goblet cell differentiation(GO:0060480) regulation of lung goblet cell differentiation(GO:1901249) negative regulation of lung goblet cell differentiation(GO:1901250) |
| 0.0 |
0.2 |
GO:0001976 |
neurological system process involved in regulation of systemic arterial blood pressure(GO:0001976) |
| 0.0 |
0.2 |
GO:0060716 |
labyrinthine layer blood vessel development(GO:0060716) |
| 0.0 |
0.1 |
GO:0051601 |
exocyst localization(GO:0051601) |
| 0.0 |
0.2 |
GO:0001964 |
startle response(GO:0001964) |
| 0.0 |
0.2 |
GO:0032410 |
negative regulation of transporter activity(GO:0032410) |
| 0.0 |
0.5 |
GO:0001738 |
morphogenesis of a polarized epithelium(GO:0001738) |
| 0.0 |
0.1 |
GO:0006269 |
DNA replication, synthesis of RNA primer(GO:0006269) |
| 0.0 |
0.0 |
GO:2000812 |
regulation of barbed-end actin filament capping(GO:2000812) |
| 0.0 |
0.2 |
GO:0009311 |
oligosaccharide metabolic process(GO:0009311) |
| 0.0 |
0.4 |
GO:0016574 |
histone ubiquitination(GO:0016574) |
| 0.0 |
0.7 |
GO:0043113 |
receptor clustering(GO:0043113) |
| 0.0 |
0.2 |
GO:0070208 |
protein heterotrimerization(GO:0070208) |
| 0.0 |
0.5 |
GO:0032728 |
positive regulation of interferon-beta production(GO:0032728) |
| 0.0 |
0.2 |
GO:0000038 |
very long-chain fatty acid metabolic process(GO:0000038) |
| 0.0 |
0.1 |
GO:0051898 |
negative regulation of protein kinase B signaling(GO:0051898) |
| 0.0 |
0.1 |
GO:0007289 |
spermatid nucleus differentiation(GO:0007289) |
| 0.0 |
0.6 |
GO:0045773 |
positive regulation of axon extension(GO:0045773) |
| 0.0 |
0.1 |
GO:0019915 |
lipid storage(GO:0019915) |
| 0.0 |
1.0 |
GO:0050885 |
neuromuscular process controlling balance(GO:0050885) |
| 0.0 |
0.5 |
GO:0030968 |
endoplasmic reticulum unfolded protein response(GO:0030968) |
| 0.0 |
0.5 |
GO:0006635 |
fatty acid beta-oxidation(GO:0006635) |
| 0.0 |
0.0 |
GO:0070318 |
positive regulation of G0 to G1 transition(GO:0070318) |
| 0.0 |
0.1 |
GO:0034720 |
histone H3-K4 demethylation(GO:0034720) |
| 0.0 |
0.0 |
GO:0045040 |
outer mitochondrial membrane organization(GO:0007008) protein import into mitochondrial outer membrane(GO:0045040) |
| 0.0 |
0.0 |
GO:0001911 |
negative regulation of leukocyte mediated cytotoxicity(GO:0001911) |
| 0.0 |
0.0 |
GO:0006089 |
lactate metabolic process(GO:0006089) |
| 0.0 |
0.1 |
GO:0030449 |
regulation of complement activation(GO:0030449) regulation of protein activation cascade(GO:2000257) |
| 0.0 |
0.3 |
GO:0060765 |
regulation of androgen receptor signaling pathway(GO:0060765) |
| 0.0 |
0.1 |
GO:0009992 |
cellular water homeostasis(GO:0009992) |
| 0.0 |
0.1 |
GO:1901475 |
pyruvate transmembrane transport(GO:1901475) |
| 0.0 |
0.2 |
GO:0005980 |
polysaccharide catabolic process(GO:0000272) glycogen catabolic process(GO:0005980) glucan catabolic process(GO:0009251) cellular polysaccharide catabolic process(GO:0044247) |
| 0.0 |
0.1 |
GO:1902775 |
mitochondrial large ribosomal subunit assembly(GO:1902775) |
| 0.0 |
0.1 |
GO:0000012 |
single strand break repair(GO:0000012) |
| 0.0 |
0.3 |
GO:0042733 |
embryonic digit morphogenesis(GO:0042733) |
| 0.0 |
0.1 |
GO:0032722 |
positive regulation of chemokine production(GO:0032722) |
| 0.0 |
0.1 |
GO:0006390 |
transcription from mitochondrial promoter(GO:0006390) |
| 0.0 |
0.1 |
GO:0006420 |
arginyl-tRNA aminoacylation(GO:0006420) |
| 0.0 |
0.1 |
GO:0030212 |
hyaluronan metabolic process(GO:0030212) |
| 0.0 |
0.1 |
GO:0071361 |
cellular response to ethanol(GO:0071361) |
| 0.0 |
0.1 |
GO:0034982 |
mitochondrial protein processing(GO:0034982) |
| 0.0 |
0.1 |
GO:0009143 |
nucleoside triphosphate catabolic process(GO:0009143) |
| 0.0 |
0.0 |
GO:0071637 |
monocyte chemotactic protein-1 production(GO:0071605) regulation of monocyte chemotactic protein-1 production(GO:0071637) |
| 0.0 |
0.0 |
GO:0046368 |
GDP-L-fucose metabolic process(GO:0046368) |
| 0.0 |
0.0 |
GO:0009404 |
toxin metabolic process(GO:0009404) |
| 0.0 |
0.2 |
GO:0006730 |
one-carbon metabolic process(GO:0006730) |
| 0.0 |
0.0 |
GO:0071985 |
multivesicular body sorting pathway(GO:0071985) |
| 0.0 |
0.1 |
GO:0071459 |
protein localization to kinetochore(GO:0034501) protein localization to chromosome, centromeric region(GO:0071459) |
| 0.0 |
0.1 |
GO:0036158 |
outer dynein arm assembly(GO:0036158) |
| 0.0 |
0.0 |
GO:0009051 |
pentose-phosphate shunt, oxidative branch(GO:0009051) |
| 0.0 |
0.1 |
GO:0061050 |
regulation of cell growth involved in cardiac muscle cell development(GO:0061050) |
| 0.0 |
0.0 |
GO:0034436 |
glycoprotein transport(GO:0034436) |
| 0.0 |
0.1 |
GO:0006656 |
phosphatidylcholine biosynthetic process(GO:0006656) |
| 0.0 |
0.0 |
GO:0090501 |
RNA phosphodiester bond hydrolysis(GO:0090501) |
| 0.0 |
0.1 |
GO:0019363 |
pyridine nucleotide biosynthetic process(GO:0019363) |
| 0.0 |
0.0 |
GO:0050691 |
regulation of defense response to virus by host(GO:0050691) |
| 0.0 |
0.0 |
GO:0097012 |
response to granulocyte macrophage colony-stimulating factor(GO:0097012) |
| 0.0 |
0.0 |
GO:0002701 |
negative regulation of production of molecular mediator of immune response(GO:0002701) |
| 0.0 |
0.1 |
GO:0098904 |
regulation of AV node cell action potential(GO:0098904) |
| 0.0 |
0.0 |
GO:0015959 |
diadenosine polyphosphate metabolic process(GO:0015959) |
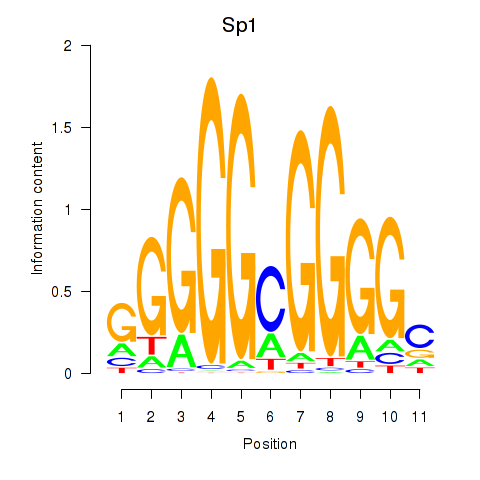
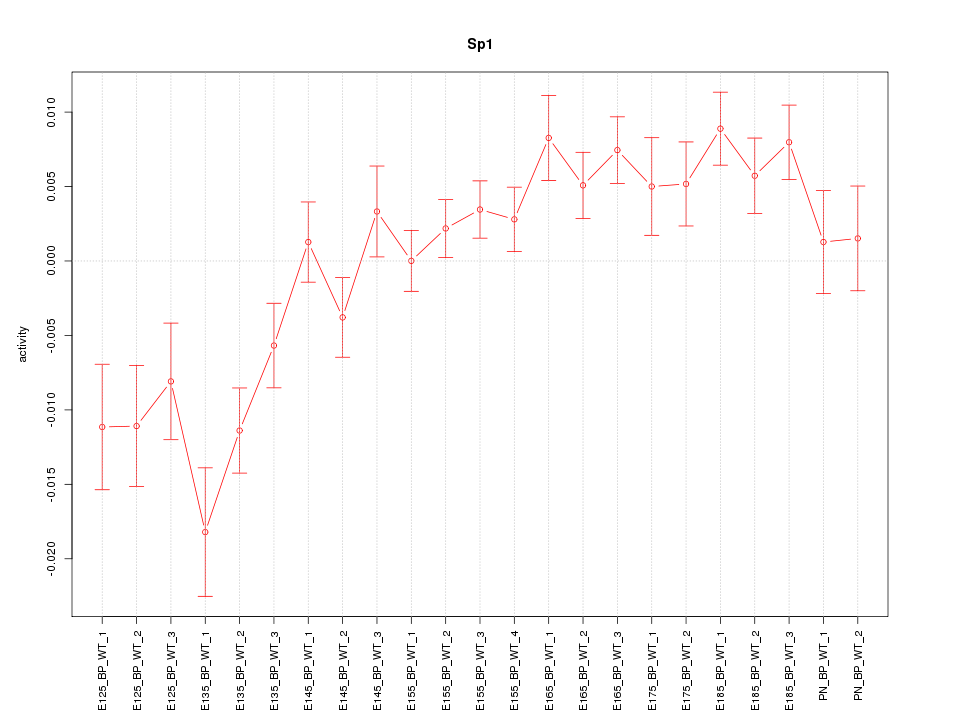
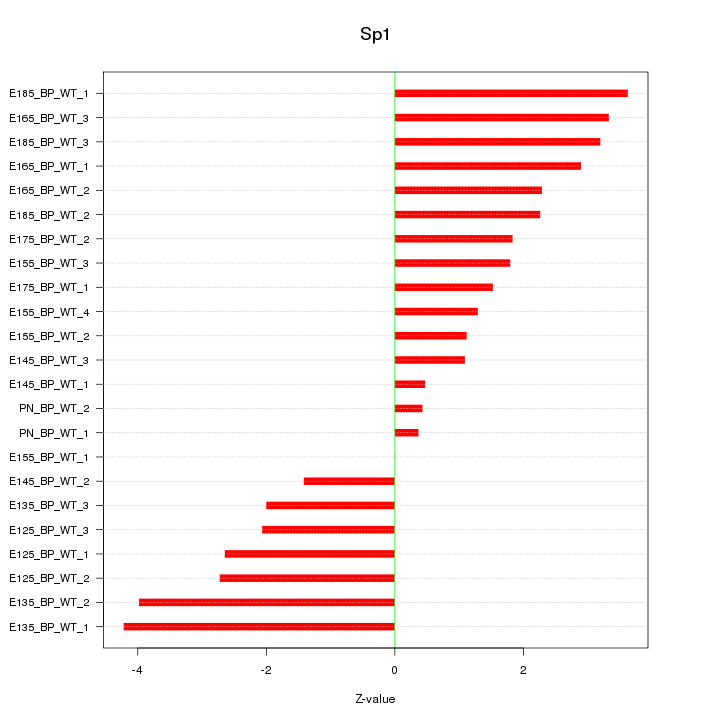

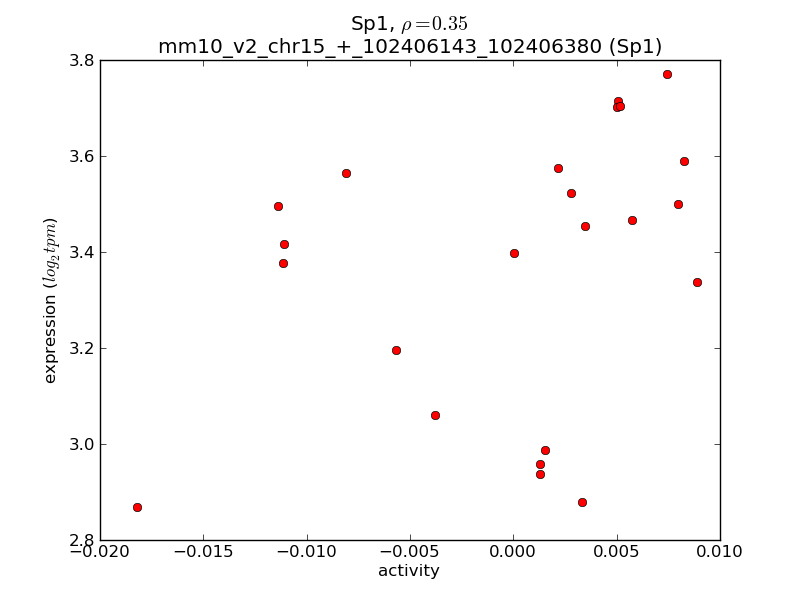
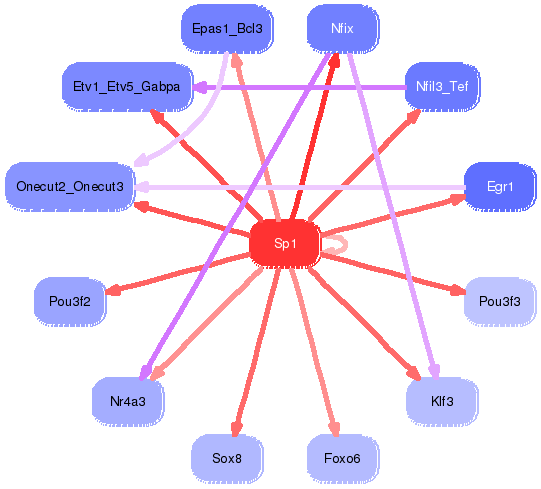