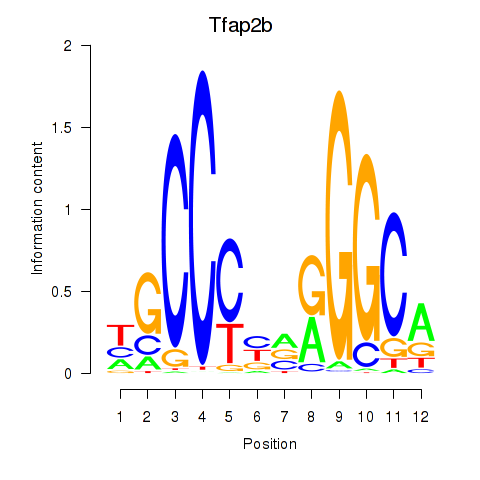
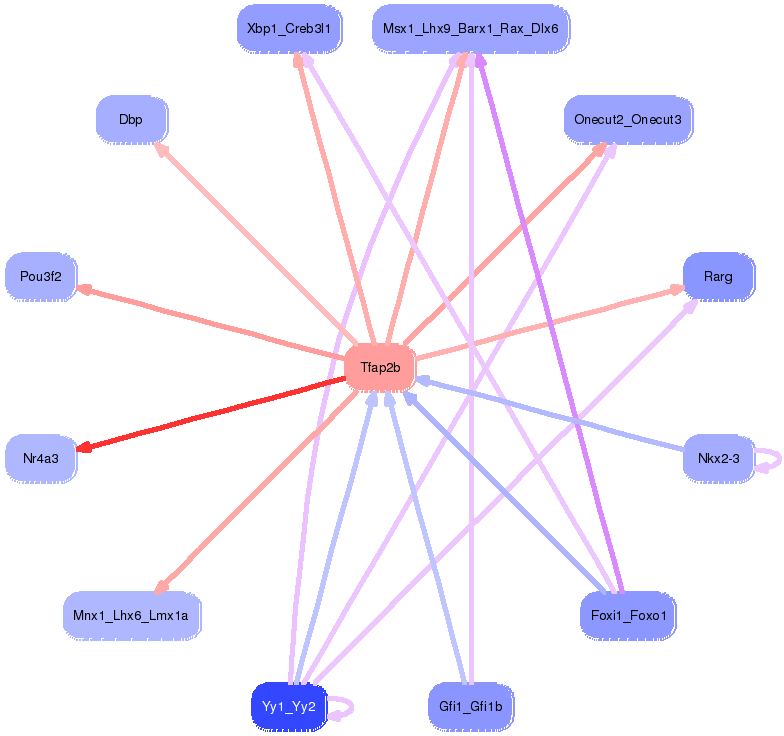
Motif ID: Tfap2b
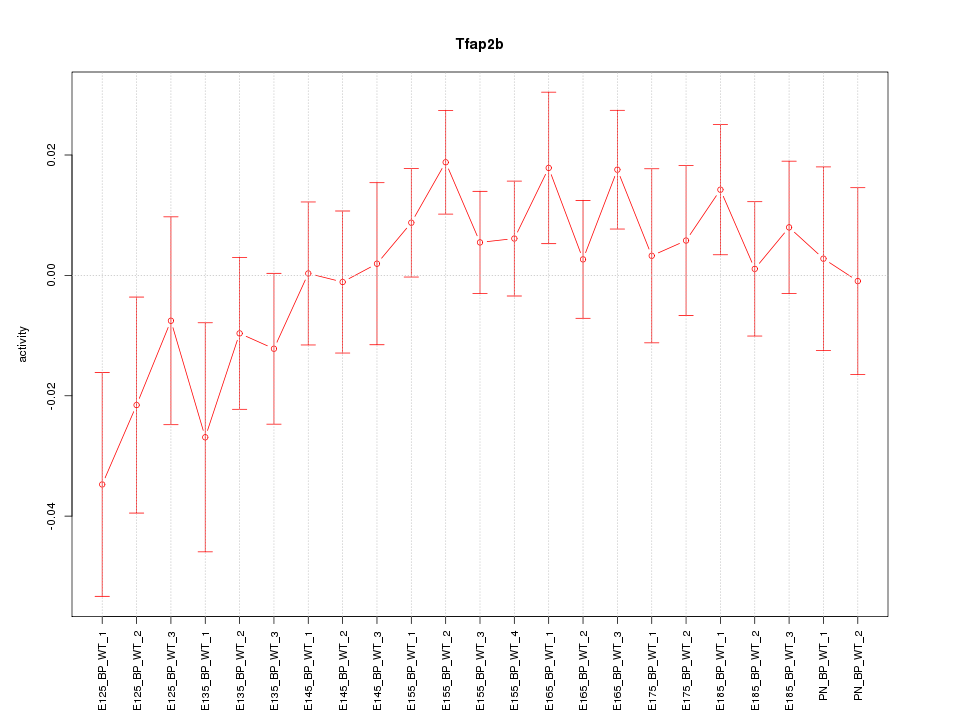
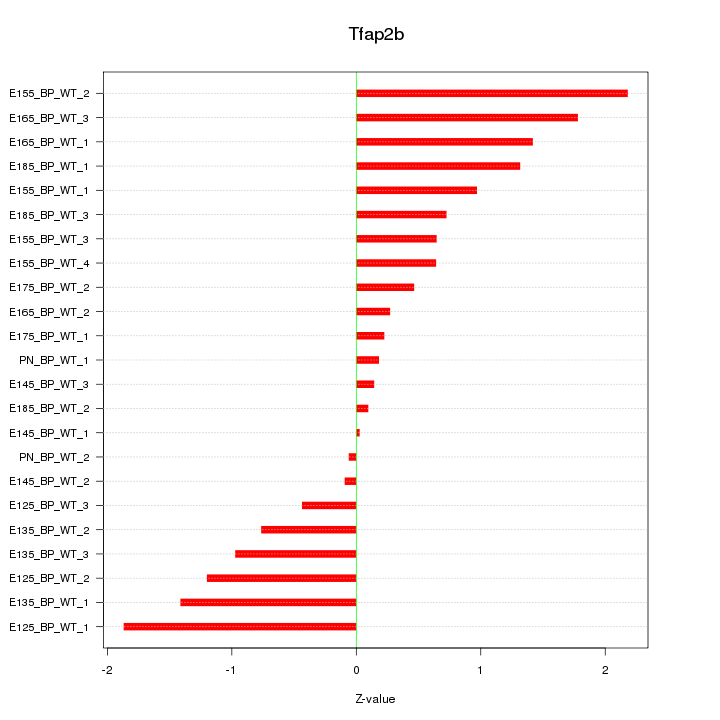
Z-value: 1.001
Transcription factors associated with Tfap2b:
| Gene Symbol | Entrez ID | Gene Name |
|---|---|---|
| Tfap2b | ENSMUSG00000025927.7 | Tfap2b |
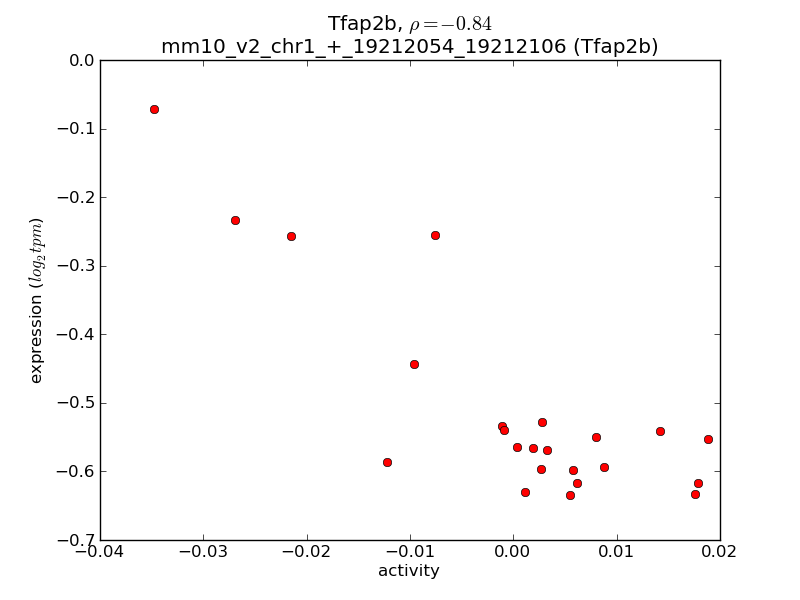
Activity-expression correlation:
| Gene Symbol | Promoter | Pearson corr. coef. | P-value | Plot |
|---|---|---|---|---|
| Tfap2b | mm10_v2_chr1_+_19212054_19212106 | -0.84 | 6.4e-07 | Click! |

Top targets:
Gene overrepresentation in biological_process category:
| Log-likelihood per target | Total log-likelihood | Term | Description |
|---|---|---|---|
| 2.3 | 6.8 | GO:0038095 | positive regulation of mast cell cytokine production(GO:0032765) Fc-epsilon receptor signaling pathway(GO:0038095) |
| 2.0 | 6.0 | GO:1902460 | regulation of mesenchymal stem cell proliferation(GO:1902460) positive regulation of mesenchymal stem cell proliferation(GO:1902462) |
| 1.7 | 1.7 | GO:0003134 | BMP signaling pathway involved in heart induction(GO:0003130) endodermal-mesodermal cell signaling(GO:0003133) endodermal-mesodermal cell signaling involved in heart induction(GO:0003134) |
| 1.0 | 6.2 | GO:0003383 | apical constriction(GO:0003383) |
| 0.9 | 2.6 | GO:0046959 | habituation(GO:0046959) |
| 0.8 | 0.8 | GO:0010593 | negative regulation of lamellipodium assembly(GO:0010593) |
| 0.7 | 3.4 | GO:0042997 | negative regulation of Golgi to plasma membrane protein transport(GO:0042997) |
| 0.6 | 9.4 | GO:0021902 | commitment of neuronal cell to specific neuron type in forebrain(GO:0021902) |
| 0.5 | 2.6 | GO:0010991 | negative regulation of SMAD protein complex assembly(GO:0010991) |
| 0.5 | 3.1 | GO:0070100 | negative regulation of chemokine-mediated signaling pathway(GO:0070100) |
| 0.5 | 1.5 | GO:0061153 | trachea submucosa development(GO:0061152) trachea gland development(GO:0061153) |
| 0.5 | 2.0 | GO:0003430 | growth plate cartilage chondrocyte growth(GO:0003430) |
| 0.5 | 1.4 | GO:0035880 | embryonic nail plate morphogenesis(GO:0035880) |
| 0.4 | 2.1 | GO:0072513 | positive regulation of secondary heart field cardioblast proliferation(GO:0072513) |
| 0.3 | 0.9 | GO:0001580 | detection of chemical stimulus involved in sensory perception of bitter taste(GO:0001580) |
| 0.3 | 0.9 | GO:0061043 | regulation of vascular wound healing(GO:0061043) |
| 0.3 | 1.8 | GO:0048934 | peripheral nervous system neuron differentiation(GO:0048934) peripheral nervous system neuron development(GO:0048935) |
| 0.3 | 0.8 | GO:0038165 | oncostatin-M-mediated signaling pathway(GO:0038165) |
| 0.3 | 3.3 | GO:0010748 | negative regulation of plasma membrane long-chain fatty acid transport(GO:0010748) positive regulation of fatty acid beta-oxidation(GO:0032000) |
| 0.3 | 1.0 | GO:0071475 | cellular hyperosmotic salinity response(GO:0071475) |
| 0.3 | 2.8 | GO:0090084 | negative regulation of inclusion body assembly(GO:0090084) |
| 0.2 | 3.2 | GO:0034497 | protein localization to pre-autophagosomal structure(GO:0034497) |
| 0.2 | 0.2 | GO:0044413 | evasion or tolerance of host defenses by virus(GO:0019049) avoidance of host defenses(GO:0044413) evasion or tolerance of host defenses(GO:0044415) avoidance of defenses of other organism involved in symbiotic interaction(GO:0051832) evasion or tolerance of defenses of other organism involved in symbiotic interaction(GO:0051834) |
| 0.2 | 1.9 | GO:0006003 | fructose 2,6-bisphosphate metabolic process(GO:0006003) |
| 0.2 | 1.4 | GO:0070278 | extracellular matrix constituent secretion(GO:0070278) |
| 0.2 | 1.1 | GO:0036438 | maintenance of lens transparency(GO:0036438) |
| 0.2 | 1.1 | GO:1904936 | cerebral cortex GABAergic interneuron migration(GO:0021853) interneuron migration(GO:1904936) |
| 0.2 | 1.1 | GO:2000574 | regulation of microtubule motor activity(GO:2000574) |
| 0.2 | 1.3 | GO:0048703 | embryonic viscerocranium morphogenesis(GO:0048703) |
| 0.2 | 0.2 | GO:0090298 | negative regulation of mitochondrial DNA replication(GO:0090298) |
| 0.2 | 0.5 | GO:0045204 | MAPK export from nucleus(GO:0045204) |
| 0.2 | 1.4 | GO:0033564 | anterior/posterior axon guidance(GO:0033564) |
| 0.2 | 1.0 | GO:0010694 | positive regulation of alkaline phosphatase activity(GO:0010694) |
| 0.2 | 2.0 | GO:0021869 | forebrain ventricular zone progenitor cell division(GO:0021869) |
| 0.2 | 2.2 | GO:0090005 | negative regulation of establishment of protein localization to plasma membrane(GO:0090005) |
| 0.1 | 1.5 | GO:0009404 | toxin metabolic process(GO:0009404) |
| 0.1 | 1.2 | GO:0035092 | sperm chromatin condensation(GO:0035092) |
| 0.1 | 0.4 | GO:1902310 | positive regulation of peptidyl-serine dephosphorylation(GO:1902310) |
| 0.1 | 0.5 | GO:0019372 | lipoxygenase pathway(GO:0019372) |
| 0.1 | 0.9 | GO:2000301 | negative regulation of synaptic vesicle exocytosis(GO:2000301) |
| 0.1 | 0.4 | GO:0070127 | tRNA aminoacylation for mitochondrial protein translation(GO:0070127) |
| 0.1 | 0.4 | GO:0007113 | endomitotic cell cycle(GO:0007113) thrombopoietin-mediated signaling pathway(GO:0038163) positive regulation of male germ cell proliferation(GO:2000256) |
| 0.1 | 1.3 | GO:0006268 | DNA unwinding involved in DNA replication(GO:0006268) |
| 0.1 | 0.9 | GO:2000786 | positive regulation of autophagosome assembly(GO:2000786) |
| 0.1 | 0.9 | GO:0090286 | cytoskeletal anchoring at nuclear membrane(GO:0090286) |
| 0.1 | 0.4 | GO:1901165 | positive regulation of trophoblast cell migration(GO:1901165) |
| 0.1 | 0.5 | GO:0060527 | prostate glandular acinus morphogenesis(GO:0060526) prostate epithelial cord arborization involved in prostate glandular acinus morphogenesis(GO:0060527) |
| 0.1 | 0.4 | GO:0045647 | negative regulation of erythrocyte differentiation(GO:0045647) |
| 0.1 | 1.0 | GO:0097186 | amelogenesis(GO:0097186) |
| 0.1 | 0.7 | GO:0006013 | mannose metabolic process(GO:0006013) |
| 0.1 | 0.5 | GO:0032811 | negative regulation of epinephrine secretion(GO:0032811) |
| 0.1 | 0.2 | GO:0015712 | hexose phosphate transport(GO:0015712) glucose-6-phosphate transport(GO:0015760) |
| 0.1 | 0.4 | GO:0002158 | osteoclast proliferation(GO:0002158) |
| 0.1 | 1.3 | GO:0060033 | anatomical structure regression(GO:0060033) |
| 0.1 | 0.4 | GO:0034436 | glycoprotein transport(GO:0034436) |
| 0.1 | 0.8 | GO:0015816 | glycine transport(GO:0015816) |
| 0.1 | 4.1 | GO:0001676 | long-chain fatty acid metabolic process(GO:0001676) |
| 0.1 | 2.5 | GO:0007520 | myoblast fusion(GO:0007520) |
| 0.1 | 0.6 | GO:0051574 | positive regulation of histone H3-K9 methylation(GO:0051574) |
| 0.1 | 0.3 | GO:0016080 | synaptic vesicle targeting(GO:0016080) |
| 0.1 | 0.6 | GO:2000650 | negative regulation of sodium ion transmembrane transporter activity(GO:2000650) |
| 0.1 | 0.4 | GO:0000022 | mitotic spindle elongation(GO:0000022) mitotic spindle midzone assembly(GO:0051256) |
| 0.1 | 2.1 | GO:0033014 | porphyrin-containing compound biosynthetic process(GO:0006779) tetrapyrrole biosynthetic process(GO:0033014) |
| 0.0 | 1.0 | GO:0006044 | N-acetylglucosamine metabolic process(GO:0006044) |
| 0.0 | 1.6 | GO:0010591 | regulation of lamellipodium assembly(GO:0010591) |
| 0.0 | 0.8 | GO:0016486 | peptide hormone processing(GO:0016486) |
| 0.0 | 1.1 | GO:0006099 | tricarboxylic acid cycle(GO:0006099) |
| 0.0 | 1.5 | GO:0035162 | embryonic hemopoiesis(GO:0035162) |
| 0.0 | 0.1 | GO:0030997 | regulation of centriole-centriole cohesion(GO:0030997) |
| 0.0 | 0.4 | GO:0033148 | positive regulation of intracellular estrogen receptor signaling pathway(GO:0033148) |
| 0.0 | 0.8 | GO:0040034 | regulation of development, heterochronic(GO:0040034) |
| 0.0 | 0.5 | GO:0008090 | retrograde axonal transport(GO:0008090) |
| 0.0 | 0.2 | GO:0033601 | positive regulation of mammary gland epithelial cell proliferation(GO:0033601) |
| 0.0 | 0.1 | GO:0001827 | inner cell mass cell fate commitment(GO:0001827) |
| 0.0 | 1.1 | GO:0090162 | establishment of epithelial cell polarity(GO:0090162) |
| 0.0 | 1.0 | GO:0034243 | regulation of transcription elongation from RNA polymerase II promoter(GO:0034243) |
| 0.0 | 0.5 | GO:0048671 | negative regulation of collateral sprouting(GO:0048671) |
| 0.0 | 0.1 | GO:0045162 | clustering of voltage-gated sodium channels(GO:0045162) |
| 0.0 | 0.0 | GO:0021913 | regulation of transcription from RNA polymerase II promoter involved in spinal cord motor neuron fate specification(GO:0021912) regulation of transcription from RNA polymerase II promoter involved in ventral spinal cord interneuron specification(GO:0021913) |
| 0.0 | 0.2 | GO:0060662 | tube lumen cavitation(GO:0060605) salivary gland cavitation(GO:0060662) |
| 0.0 | 0.1 | GO:0016259 | selenocysteine metabolic process(GO:0016259) |
| 0.0 | 0.2 | GO:0031274 | positive regulation of pseudopodium assembly(GO:0031274) |
| 0.0 | 0.2 | GO:0034773 | histone H4-K20 trimethylation(GO:0034773) |
| 0.0 | 0.4 | GO:0008210 | estrogen metabolic process(GO:0008210) |
| 0.0 | 0.3 | GO:0045947 | negative regulation of translational initiation(GO:0045947) |
| 0.0 | 0.2 | GO:0007289 | spermatid nucleus differentiation(GO:0007289) |
| 0.0 | 0.4 | GO:0046854 | phosphatidylinositol phosphorylation(GO:0046854) |
| 0.0 | 0.3 | GO:0000028 | ribosomal small subunit assembly(GO:0000028) |
| 0.0 | 0.3 | GO:0034198 | cellular response to amino acid starvation(GO:0034198) |
| 0.0 | 0.1 | GO:0071372 | cellular response to follicle-stimulating hormone stimulus(GO:0071372) |
| 0.0 | 0.2 | GO:0071549 | cellular response to dexamethasone stimulus(GO:0071549) |
| 0.0 | 1.0 | GO:0007286 | spermatid development(GO:0007286) |
| 0.0 | 0.1 | GO:0033327 | Leydig cell differentiation(GO:0033327) |
| 0.0 | 0.0 | GO:0010756 | regulation of plasminogen activation(GO:0010755) positive regulation of plasminogen activation(GO:0010756) |
| 0.0 | 1.8 | GO:0008360 | regulation of cell shape(GO:0008360) |
Gene overrepresentation in cellular_component category:
| Log-likelihood per target | Total log-likelihood | Term | Description |
|---|---|---|---|
| 0.4 | 2.2 | GO:0008091 | spectrin(GO:0008091) |
| 0.3 | 2.6 | GO:0032045 | guanyl-nucleotide exchange factor complex(GO:0032045) |
| 0.2 | 3.7 | GO:0034045 | pre-autophagosomal structure membrane(GO:0034045) |
| 0.2 | 1.2 | GO:0044316 | cone cell pedicle(GO:0044316) |
| 0.2 | 1.0 | GO:0030485 | smooth muscle contractile fiber(GO:0030485) |
| 0.2 | 3.3 | GO:0032593 | insulin-responsive compartment(GO:0032593) |
| 0.2 | 1.0 | GO:0043564 | Ku70:Ku80 complex(GO:0043564) |
| 0.1 | 0.5 | GO:0031673 | H zone(GO:0031673) |
| 0.1 | 1.1 | GO:0045252 | oxoglutarate dehydrogenase complex(GO:0045252) |
| 0.1 | 0.5 | GO:0038039 | G-protein coupled receptor heterodimeric complex(GO:0038039) |
| 0.1 | 9.3 | GO:0000118 | histone deacetylase complex(GO:0000118) |
| 0.1 | 1.3 | GO:0005662 | DNA replication factor A complex(GO:0005662) |
| 0.1 | 3.1 | GO:0031901 | early endosome membrane(GO:0031901) |
| 0.0 | 1.8 | GO:0032809 | neuronal cell body membrane(GO:0032809) |
| 0.0 | 0.8 | GO:0035102 | PRC1 complex(GO:0035102) |
| 0.0 | 0.6 | GO:0035098 | ESC/E(Z) complex(GO:0035098) |
| 0.0 | 13.6 | GO:0005667 | transcription factor complex(GO:0005667) |
| 0.0 | 5.9 | GO:0043296 | apical junction complex(GO:0043296) |
| 0.0 | 0.3 | GO:0042582 | primary lysosome(GO:0005766) azurophil granule(GO:0042582) |
| 0.0 | 0.4 | GO:0044666 | MLL3/4 complex(GO:0044666) |
| 0.0 | 0.4 | GO:0000164 | protein phosphatase type 1 complex(GO:0000164) |
| 0.0 | 0.4 | GO:0032433 | filopodium tip(GO:0032433) |
| 0.0 | 1.2 | GO:0097440 | apical dendrite(GO:0097440) |
| 0.0 | 0.3 | GO:0061700 | GATOR2 complex(GO:0061700) |
| 0.0 | 0.1 | GO:0008024 | cyclin/CDK positive transcription elongation factor complex(GO:0008024) |
| 0.0 | 0.4 | GO:0034361 | very-low-density lipoprotein particle(GO:0034361) triglyceride-rich lipoprotein particle(GO:0034385) |
| 0.0 | 6.8 | GO:0005578 | proteinaceous extracellular matrix(GO:0005578) |
| 0.0 | 0.2 | GO:0000836 | ER ubiquitin ligase complex(GO:0000835) Hrd1p ubiquitin ligase complex(GO:0000836) |
| 0.0 | 1.9 | GO:0005581 | collagen trimer(GO:0005581) |
| 0.0 | 1.5 | GO:0030667 | secretory granule membrane(GO:0030667) |
| 0.0 | 1.0 | GO:0032420 | stereocilium(GO:0032420) |
| 0.0 | 1.2 | GO:0005788 | endoplasmic reticulum lumen(GO:0005788) |
| 0.0 | 1.5 | GO:0045211 | postsynaptic membrane(GO:0045211) |
| 0.0 | 0.1 | GO:0030015 | CCR4-NOT core complex(GO:0030015) |
| 0.0 | 3.1 | GO:0001726 | ruffle(GO:0001726) |
| 0.0 | 0.5 | GO:0005903 | brush border(GO:0005903) |
| 0.0 | 0.8 | GO:0031012 | extracellular matrix(GO:0031012) |
| 0.0 | 1.8 | GO:0032993 | protein-DNA complex(GO:0032993) |
| 0.0 | 0.9 | GO:0005776 | autophagosome(GO:0005776) |
| 0.0 | 0.1 | GO:0032797 | SMN complex(GO:0032797) |
| 0.0 | 1.3 | GO:0030139 | endocytic vesicle(GO:0030139) |
| 0.0 | 0.2 | GO:0000780 | condensed nuclear chromosome, centromeric region(GO:0000780) |
| 0.0 | 0.1 | GO:0031616 | spindle pole centrosome(GO:0031616) |
| 0.0 | 0.2 | GO:0000795 | synaptonemal complex(GO:0000795) |
| 0.0 | 1.0 | GO:0005884 | actin filament(GO:0005884) |
Gene overrepresentation in molecular_function category:
| Log-likelihood per target | Total log-likelihood | Term | Description |
|---|---|---|---|
| 0.5 | 1.5 | GO:0016715 | oxidoreductase activity, acting on paired donors, with incorporation or reduction of molecular oxygen, reduced ascorbate as one donor, and incorporation of one atom of oxygen(GO:0016715) |
| 0.4 | 6.8 | GO:0001223 | transcription coactivator binding(GO:0001223) |
| 0.4 | 3.1 | GO:0048495 | Roundabout binding(GO:0048495) |
| 0.4 | 2.6 | GO:0005095 | GTPase inhibitor activity(GO:0005095) |
| 0.4 | 1.1 | GO:0008109 | N-acetyllactosaminide beta-1,6-N-acetylglucosaminyltransferase activity(GO:0008109) |
| 0.3 | 1.3 | GO:0032422 | purine-rich negative regulatory element binding(GO:0032422) |
| 0.3 | 0.9 | GO:0043183 | vascular endothelial growth factor receptor 1 binding(GO:0043183) |
| 0.3 | 0.9 | GO:0016309 | 1-phosphatidylinositol-5-phosphate 4-kinase activity(GO:0016309) |
| 0.3 | 0.8 | GO:0005280 | hydrogen:amino acid symporter activity(GO:0005280) |
| 0.3 | 0.8 | GO:0004923 | leukemia inhibitory factor receptor activity(GO:0004923) oncostatin-M receptor activity(GO:0004924) |
| 0.2 | 5.9 | GO:0050431 | transforming growth factor beta binding(GO:0050431) |
| 0.2 | 1.7 | GO:0019211 | phosphatase activator activity(GO:0019211) |
| 0.2 | 3.7 | GO:0016290 | palmitoyl-CoA hydrolase activity(GO:0016290) |
| 0.2 | 1.4 | GO:0005042 | netrin receptor activity(GO:0005042) |
| 0.2 | 2.1 | GO:0050308 | sugar-phosphatase activity(GO:0050308) |
| 0.2 | 1.0 | GO:0008273 | calcium, potassium:sodium antiporter activity(GO:0008273) |
| 0.2 | 2.5 | GO:0005522 | profilin binding(GO:0005522) |
| 0.2 | 1.3 | GO:0015016 | [heparan sulfate]-glucosamine N-sulfotransferase activity(GO:0015016) |
| 0.1 | 0.4 | GO:0035651 | AP-3 adaptor complex binding(GO:0035651) |
| 0.1 | 1.1 | GO:0004591 | oxoglutarate dehydrogenase (succinyl-transferring) activity(GO:0004591) |
| 0.1 | 0.2 | GO:0034714 | type III transforming growth factor beta receptor binding(GO:0034714) |
| 0.1 | 0.4 | GO:0034189 | very-low-density lipoprotein particle binding(GO:0034189) glycoprotein transporter activity(GO:0034437) |
| 0.1 | 1.0 | GO:0051575 | 5'-deoxyribose-5-phosphate lyase activity(GO:0051575) |
| 0.1 | 2.0 | GO:0003708 | retinoic acid receptor activity(GO:0003708) |
| 0.1 | 2.0 | GO:0071837 | HMG box domain binding(GO:0071837) |
| 0.1 | 1.2 | GO:0008379 | thioredoxin peroxidase activity(GO:0008379) |
| 0.1 | 0.8 | GO:0051022 | Rho GDP-dissociation inhibitor binding(GO:0051022) |
| 0.1 | 2.1 | GO:0080025 | phosphatidylinositol-3,5-bisphosphate binding(GO:0080025) |
| 0.1 | 0.8 | GO:0042809 | vitamin D receptor binding(GO:0042809) |
| 0.1 | 0.4 | GO:0008427 | calcium-dependent protein kinase inhibitor activity(GO:0008427) |
| 0.1 | 0.5 | GO:0004965 | G-protein coupled GABA receptor activity(GO:0004965) |
| 0.1 | 1.4 | GO:0035497 | cAMP response element binding(GO:0035497) |
| 0.1 | 0.5 | GO:0004301 | epoxide hydrolase activity(GO:0004301) |
| 0.1 | 2.6 | GO:0070412 | R-SMAD binding(GO:0070412) |
| 0.1 | 0.4 | GO:0016941 | natriuretic peptide receptor activity(GO:0016941) |
| 0.1 | 0.8 | GO:0004185 | serine-type carboxypeptidase activity(GO:0004185) |
| 0.1 | 1.4 | GO:0030506 | ankyrin binding(GO:0030506) |
| 0.1 | 1.5 | GO:0005164 | tumor necrosis factor receptor binding(GO:0005164) |
| 0.1 | 0.5 | GO:0005068 | transmembrane receptor protein tyrosine kinase adaptor activity(GO:0005068) |
| 0.1 | 1.1 | GO:0050750 | low-density lipoprotein particle receptor binding(GO:0050750) |
| 0.0 | 0.2 | GO:0003910 | DNA ligase activity(GO:0003909) DNA ligase (ATP) activity(GO:0003910) |
| 0.0 | 1.0 | GO:0034930 | N-acetylglucosamine 6-O-sulfotransferase activity(GO:0001517) heparan sulfate 2-O-sulfotransferase activity(GO:0004394) HNK-1 sulfotransferase activity(GO:0016232) heparan sulfate 6-O-sulfotransferase activity(GO:0017095) trans-9R,10R-dihydrodiolphenanthrene sulfotransferase activity(GO:0018721) 1-phenanthrol sulfotransferase activity(GO:0018722) 3-phenanthrol sulfotransferase activity(GO:0018723) 4-phenanthrol sulfotransferase activity(GO:0018724) trans-3,4-dihydrodiolphenanthrene sulfotransferase activity(GO:0018725) 9-phenanthrol sulfotransferase activity(GO:0018726) 2-phenanthrol sulfotransferase activity(GO:0018727) phenanthrol sulfotransferase activity(GO:0019111) 1-hydroxypyrene sulfotransferase activity(GO:0034930) proteoglycan sulfotransferase activity(GO:0050698) cholesterol sulfotransferase activity(GO:0051922) hydroxyjasmonate sulfotransferase activity(GO:0080131) |
| 0.0 | 0.5 | GO:0043325 | phosphatidylinositol-3,4-bisphosphate binding(GO:0043325) |
| 0.0 | 2.7 | GO:0005080 | protein kinase C binding(GO:0005080) |
| 0.0 | 0.3 | GO:0008429 | phosphatidylethanolamine binding(GO:0008429) |
| 0.0 | 1.8 | GO:0035591 | signaling adaptor activity(GO:0035591) |
| 0.0 | 0.3 | GO:0031957 | very long-chain fatty acid-CoA ligase activity(GO:0031957) |
| 0.0 | 0.2 | GO:0042799 | histone methyltransferase activity (H4-K20 specific)(GO:0042799) |
| 0.0 | 0.5 | GO:0008138 | protein tyrosine/serine/threonine phosphatase activity(GO:0008138) |
| 0.0 | 0.6 | GO:0043141 | ATP-dependent 5'-3' DNA helicase activity(GO:0043141) |
| 0.0 | 0.7 | GO:0044653 | trehalase activity(GO:0015927) dextrin alpha-glucosidase activity(GO:0044653) starch alpha-glucosidase activity(GO:0044654) beta-glucanase activity(GO:0052736) beta-6-sulfate-N-acetylglucosaminidase activity(GO:0052769) glucan endo-1,4-beta-glucosidase activity(GO:0052859) |
| 0.0 | 2.3 | GO:0051082 | unfolded protein binding(GO:0051082) |
| 0.0 | 0.3 | GO:0070181 | small ribosomal subunit rRNA binding(GO:0070181) |
| 0.0 | 3.3 | GO:0004725 | protein tyrosine phosphatase activity(GO:0004725) |
| 0.0 | 0.1 | GO:0016174 | NAD(P)H oxidase activity(GO:0016174) |
| 0.0 | 1.2 | GO:0032934 | cholesterol binding(GO:0015485) sterol binding(GO:0032934) |
| 0.0 | 0.1 | GO:0045131 | pre-mRNA branch point binding(GO:0045131) |
| 0.0 | 1.0 | GO:0004712 | protein serine/threonine/tyrosine kinase activity(GO:0004712) |
| 0.0 | 0.1 | GO:0001224 | RNA polymerase II transcription cofactor binding(GO:0001224) RNA polymerase II transcription corepressor binding(GO:0001226) |
| 0.0 | 0.4 | GO:0005452 | inorganic anion exchanger activity(GO:0005452) |
| 0.0 | 0.8 | GO:0008748 | N-ethylmaleimide reductase activity(GO:0008748) reduced coenzyme F420 dehydrogenase activity(GO:0043738) sulfur oxygenase reductase activity(GO:0043826) malolactic enzyme activity(GO:0043883) epoxyqueuosine reductase activity(GO:0052693) |
| 0.0 | 0.7 | GO:0004709 | MAP kinase kinase kinase activity(GO:0004709) |
| 0.0 | 0.5 | GO:0005528 | macrolide binding(GO:0005527) FK506 binding(GO:0005528) |
| 0.0 | 0.1 | GO:0005004 | GPI-linked ephrin receptor activity(GO:0005004) |
| 0.0 | 0.6 | GO:0032452 | histone demethylase activity(GO:0032452) |
| 0.0 | 0.4 | GO:0008157 | protein phosphatase 1 binding(GO:0008157) |
| 0.0 | 0.6 | GO:0008200 | ion channel inhibitor activity(GO:0008200) |
| 0.0 | 2.2 | GO:0017124 | SH3 domain binding(GO:0017124) |
| 0.0 | 0.3 | GO:0030371 | translation repressor activity(GO:0030371) |
| 0.0 | 1.2 | GO:0002039 | p53 binding(GO:0002039) |
| 0.0 | 0.2 | GO:0097027 | ubiquitin-protein transferase activator activity(GO:0097027) |
| 0.0 | 0.3 | GO:0034946 | 2-oxoglutaryl-CoA thioesterase activity(GO:0034843) 2,4,4-trimethyl-3-oxopentanoyl-CoA thioesterase activity(GO:0034869) 3-isopropylbut-3-enoyl-CoA thioesterase activity(GO:0034946) glutaryl-CoA hydrolase activity(GO:0044466) |
| 0.0 | 0.4 | GO:0004715 | non-membrane spanning protein tyrosine kinase activity(GO:0004715) |
| 0.0 | 0.2 | GO:0017049 | GTP-Rho binding(GO:0017049) |
| 0.0 | 0.1 | GO:0016500 | protein-hormone receptor activity(GO:0016500) |
| 0.0 | 0.2 | GO:0004198 | calcium-dependent cysteine-type endopeptidase activity(GO:0004198) |
| 0.0 | 0.2 | GO:0016854 | racemase and epimerase activity(GO:0016854) |