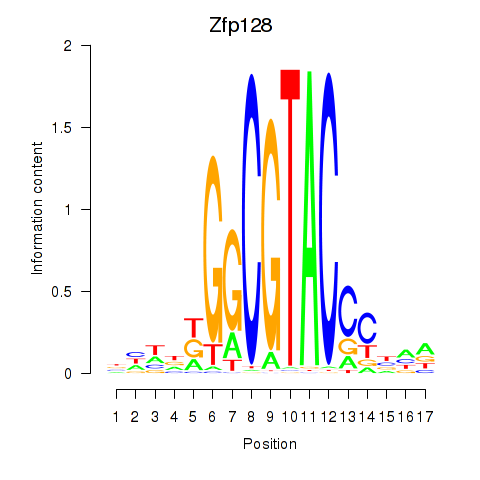
Motif ID: Zfp128
Z-value: 0.362

Transcription factors associated with Zfp128:
| Gene Symbol | Entrez ID | Gene Name |
|---|---|---|
| Zfp128 | ENSMUSG00000060397.6 | Zfp128 |
Activity-expression correlation:
| Gene Symbol | Promoter | Pearson corr. coef. | P-value | Plot |
|---|---|---|---|---|
| Zfp128 | mm10_v2_chr7_+_12881165_12881204 | 0.04 | 8.5e-01 | Click! |
Top targets:
Gene overrepresentation in biological_process category:
| Log-likelihood per target | Total log-likelihood | Term | Description |
|---|---|---|---|
| 0.6 | 1.7 | GO:0090425 | hepatocyte cell migration(GO:0002194) branching involved in pancreas morphogenesis(GO:0061114) acinar cell differentiation(GO:0090425) positive regulation of forebrain neuron differentiation(GO:2000979) |
| 0.4 | 1.2 | GO:0043379 | memory T cell differentiation(GO:0043379) |
| 0.1 | 0.5 | GO:0048597 | post-embryonic camera-type eye morphogenesis(GO:0048597) |
| 0.1 | 0.2 | GO:0060437 | lung growth(GO:0060437) |
| 0.1 | 0.2 | GO:0051031 | tRNA transport(GO:0051031) |
| 0.0 | 0.1 | GO:1903546 | microtubule anchoring at centrosome(GO:0034454) negative regulation of appetite by leptin-mediated signaling pathway(GO:0038108) protein localization to photoreceptor outer segment(GO:1903546) |
| 0.0 | 0.2 | GO:0030656 | regulation of vitamin metabolic process(GO:0030656) |
| 0.0 | 0.1 | GO:0008616 | queuosine biosynthetic process(GO:0008616) queuosine metabolic process(GO:0046116) |
| 0.0 | 0.5 | GO:0060259 | regulation of feeding behavior(GO:0060259) |
| 0.0 | 0.3 | GO:0071447 | cellular response to hydroperoxide(GO:0071447) |
| 0.0 | 0.1 | GO:1902310 | positive regulation of peptidyl-serine dephosphorylation(GO:1902310) |
| 0.0 | 1.3 | GO:0007601 | visual perception(GO:0007601) |
| 0.0 | 0.4 | GO:1902236 | negative regulation of endoplasmic reticulum stress-induced intrinsic apoptotic signaling pathway(GO:1902236) |
| 0.0 | 0.2 | GO:0010758 | regulation of macrophage chemotaxis(GO:0010758) |
| 0.0 | 0.6 | GO:0051438 | regulation of ubiquitin-protein transferase activity(GO:0051438) |
Gene overrepresentation in cellular_component category:
| Log-likelihood per target | Total log-likelihood | Term | Description |
|---|---|---|---|
| 0.1 | 1.2 | GO:0002080 | acrosomal membrane(GO:0002080) |
| 0.0 | 0.6 | GO:0031462 | Cul2-RING ubiquitin ligase complex(GO:0031462) |
| 0.0 | 0.2 | GO:0044233 | ER-mitochondrion membrane contact site(GO:0044233) |
| 0.0 | 0.1 | GO:0034464 | BBSome(GO:0034464) |
Gene overrepresentation in molecular_function category:
| Log-likelihood per target | Total log-likelihood | Term | Description |
|---|---|---|---|
| 0.2 | 1.4 | GO:0019841 | retinol binding(GO:0019841) |
| 0.2 | 1.7 | GO:0050693 | LBD domain binding(GO:0050693) |
| 0.1 | 1.2 | GO:0001848 | complement binding(GO:0001848) |
| 0.1 | 0.5 | GO:0005021 | vascular endothelial growth factor-activated receptor activity(GO:0005021) |
| 0.0 | 0.2 | GO:0015450 | P-P-bond-hydrolysis-driven protein transmembrane transporter activity(GO:0015450) |
| 0.0 | 0.2 | GO:0031419 | cobalamin binding(GO:0031419) |
| 0.0 | 0.1 | GO:0034452 | dynactin binding(GO:0034452) |
| 0.0 | 0.1 | GO:0008479 | queuine tRNA-ribosyltransferase activity(GO:0008479) |


