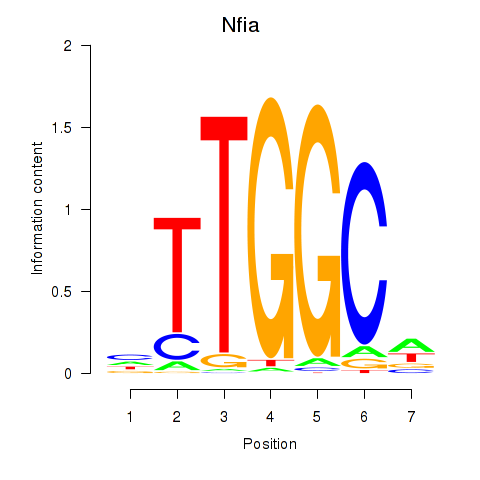
Motif ID: Nfia
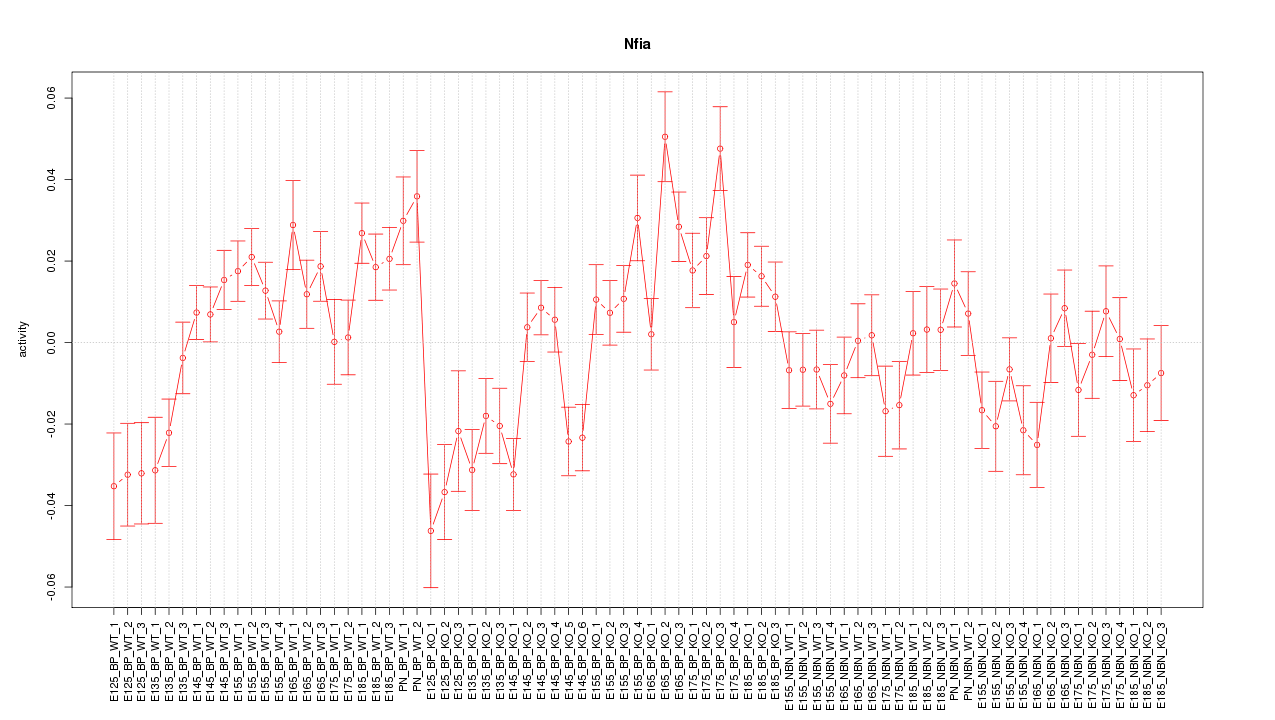
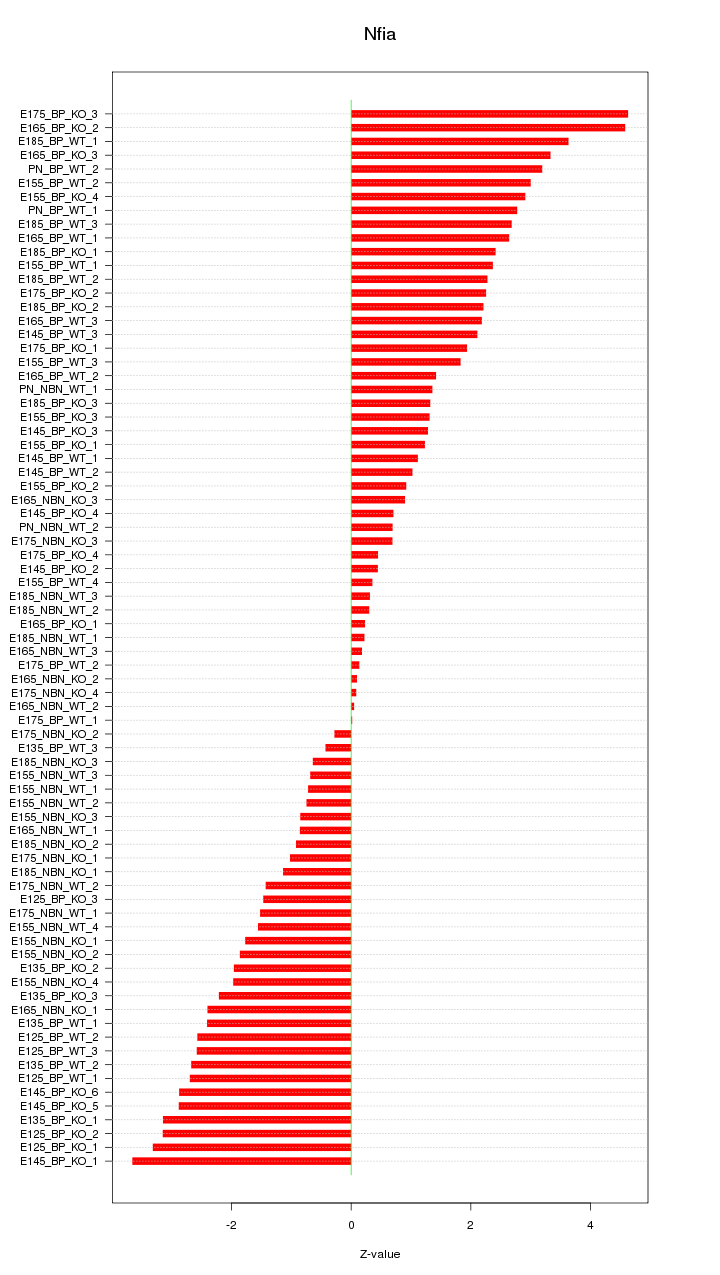
Z-value: 2.010
Transcription factors associated with Nfia:
| Gene Symbol | Entrez ID | Gene Name |
|---|---|---|
| Nfia | ENSMUSG00000028565.12 | Nfia |
Activity-expression correlation:
| Gene Symbol | Promoter | Pearson corr. coef. | P-value | Plot |
|---|---|---|---|---|
| Nfia | mm10_v2_chr4_+_97772734_97772848 | -0.05 | 6.4e-01 | Click! |

Top targets:
Gene overrepresentation in biological_process category:
| Log-likelihood per target | Total log-likelihood | Term | Description |
|---|---|---|---|
| 10.5 | 31.5 | GO:1902460 | transforming growth factor beta activation(GO:0036363) regulation of mesenchymal stem cell proliferation(GO:1902460) positive regulation of mesenchymal stem cell proliferation(GO:1902462) |
| 9.3 | 9.3 | GO:1905072 | cardiac jelly development(GO:1905072) |
| 8.6 | 42.9 | GO:0070327 | thyroid hormone transport(GO:0070327) |
| 5.6 | 22.5 | GO:0007217 | tachykinin receptor signaling pathway(GO:0007217) |
| 5.4 | 5.4 | GO:0003134 | BMP signaling pathway involved in heart induction(GO:0003130) endodermal-mesodermal cell signaling(GO:0003133) endodermal-mesodermal cell signaling involved in heart induction(GO:0003134) |
| 4.9 | 14.6 | GO:0038095 | positive regulation of mast cell cytokine production(GO:0032765) Fc-epsilon receptor signaling pathway(GO:0038095) |
| 4.9 | 24.3 | GO:2000255 | negative regulation of male germ cell proliferation(GO:2000255) |
| 4.7 | 32.7 | GO:0010624 | regulation of Schwann cell proliferation(GO:0010624) |
| 4.5 | 13.6 | GO:0006553 | lysine metabolic process(GO:0006553) |
| 4.0 | 7.9 | GO:0072197 | ureter morphogenesis(GO:0072197) |
| 3.6 | 21.5 | GO:0060718 | chorionic trophoblast cell differentiation(GO:0060718) |
| 3.6 | 10.7 | GO:0090425 | hepatocyte cell migration(GO:0002194) branching involved in pancreas morphogenesis(GO:0061114) acinar cell differentiation(GO:0090425) positive regulation of forebrain neuron differentiation(GO:2000979) |
| 3.3 | 10.0 | GO:0048687 | positive regulation of sprouting of injured axon(GO:0048687) positive regulation of axon extension involved in regeneration(GO:0048691) |
| 3.0 | 6.1 | GO:0034759 | regulation of iron ion transport(GO:0034756) regulation of iron ion transmembrane transport(GO:0034759) |
| 3.0 | 9.1 | GO:0014012 | peripheral nervous system axon regeneration(GO:0014012) |
| 2.7 | 8.2 | GO:0090403 | oxidative stress-induced premature senescence(GO:0090403) |
| 2.6 | 7.9 | GO:0002030 | inhibitory G-protein coupled receptor phosphorylation(GO:0002030) |
| 2.6 | 10.3 | GO:0000255 | allantoin metabolic process(GO:0000255) |
| 2.5 | 17.7 | GO:0043553 | negative regulation of phosphatidylinositol 3-kinase activity(GO:0043553) |
| 2.5 | 10.0 | GO:0006982 | response to lipid hydroperoxide(GO:0006982) cellular response to lipid hydroperoxide(GO:0071449) |
| 2.5 | 7.5 | GO:1901079 | positive regulation of relaxation of muscle(GO:1901079) |
| 2.5 | 27.4 | GO:0015721 | bile acid and bile salt transport(GO:0015721) |
| 2.4 | 4.8 | GO:0030240 | skeletal muscle thin filament assembly(GO:0030240) |
| 2.3 | 7.0 | GO:1903225 | negative regulation of endodermal cell differentiation(GO:1903225) |
| 2.3 | 9.1 | GO:1904706 | negative regulation of vascular smooth muscle cell proliferation(GO:1904706) |
| 2.2 | 15.1 | GO:0021847 | ventricular zone neuroblast division(GO:0021847) |
| 2.2 | 6.5 | GO:0014809 | regulation of skeletal muscle contraction by regulation of release of sequestered calcium ion(GO:0014809) |
| 2.1 | 2.1 | GO:0090259 | regulation of retinal ganglion cell axon guidance(GO:0090259) |
| 2.0 | 10.1 | GO:0060591 | chondroblast differentiation(GO:0060591) |
| 2.0 | 6.0 | GO:0097155 | fasciculation of sensory neuron axon(GO:0097155) |
| 1.9 | 9.6 | GO:1903609 | negative regulation of peptidyl-tyrosine autophosphorylation(GO:1900085) negative regulation of inward rectifier potassium channel activity(GO:1903609) |
| 1.9 | 5.7 | GO:0097350 | neutrophil clearance(GO:0097350) |
| 1.9 | 11.3 | GO:0032196 | regulation of transposition(GO:0010528) negative regulation of transposition(GO:0010529) transposition(GO:0032196) |
| 1.9 | 5.6 | GO:0071579 | regulation of zinc ion transport(GO:0071579) |
| 1.9 | 1.9 | GO:0003219 | cardiac right ventricle formation(GO:0003219) |
| 1.9 | 9.3 | GO:0021905 | pancreatic A cell development(GO:0003322) forebrain-midbrain boundary formation(GO:0021905) somatic motor neuron fate commitment(GO:0021917) regulation of transcription from RNA polymerase II promoter involved in somatic motor neuron fate commitment(GO:0021918) sensory neuron migration(GO:1904937) |
| 1.7 | 15.7 | GO:0048251 | elastic fiber assembly(GO:0048251) |
| 1.7 | 5.2 | GO:0019343 | cysteine biosynthetic process via cystathionine(GO:0019343) cysteine biosynthetic process(GO:0019344) |
| 1.6 | 1.6 | GO:0038163 | thrombopoietin-mediated signaling pathway(GO:0038163) |
| 1.5 | 4.6 | GO:0061153 | trachea submucosa development(GO:0061152) trachea gland development(GO:0061153) |
| 1.5 | 9.1 | GO:0097473 | cellular response to light intensity(GO:0071484) cellular response to high light intensity(GO:0071486) retinal rod cell apoptotic process(GO:0097473) |
| 1.5 | 3.0 | GO:0048014 | Tie signaling pathway(GO:0048014) |
| 1.4 | 4.3 | GO:0030210 | heparin biosynthetic process(GO:0030210) |
| 1.4 | 1.4 | GO:0003162 | atrioventricular node development(GO:0003162) |
| 1.4 | 4.3 | GO:0035928 | rRNA import into mitochondrion(GO:0035928) |
| 1.4 | 8.5 | GO:0051045 | negative regulation of membrane protein ectodomain proteolysis(GO:0051045) |
| 1.4 | 4.2 | GO:0060648 | mammary gland bud morphogenesis(GO:0060648) negative regulation of determination of dorsal identity(GO:2000016) |
| 1.3 | 7.9 | GO:0032346 | positive regulation of aldosterone metabolic process(GO:0032346) positive regulation of aldosterone biosynthetic process(GO:0032349) |
| 1.3 | 6.6 | GO:0052428 | modulation of molecular function in other organism(GO:0044359) negative regulation of molecular function in other organism(GO:0044362) negative regulation of molecular function in other organism involved in symbiotic interaction(GO:0052204) modulation of molecular function in other organism involved in symbiotic interaction(GO:0052205) negative regulation by host of symbiont molecular function(GO:0052405) modification by host of symbiont molecular function(GO:0052428) |
| 1.3 | 5.2 | GO:0032804 | negative regulation of low-density lipoprotein particle receptor catabolic process(GO:0032804) dibasic protein processing(GO:0090472) |
| 1.3 | 15.5 | GO:0061302 | smooth muscle cell-matrix adhesion(GO:0061302) |
| 1.3 | 3.9 | GO:0060971 | embryonic heart tube left/right pattern formation(GO:0060971) |
| 1.3 | 6.3 | GO:0051365 | cellular response to potassium ion starvation(GO:0051365) |
| 1.3 | 3.8 | GO:0003057 | regulation of the force of heart contraction by chemical signal(GO:0003057) |
| 1.3 | 18.8 | GO:0035994 | response to muscle stretch(GO:0035994) |
| 1.2 | 5.0 | GO:1902724 | JAK-STAT cascade involved in growth hormone signaling pathway(GO:0060397) positive regulation of skeletal muscle satellite cell proliferation(GO:1902724) positive regulation of growth factor dependent skeletal muscle satellite cell proliferation(GO:1902728) |
| 1.2 | 13.6 | GO:0061032 | visceral serous pericardium development(GO:0061032) |
| 1.2 | 4.9 | GO:1903236 | regulation of leukocyte tethering or rolling(GO:1903236) negative regulation of leukocyte tethering or rolling(GO:1903237) |
| 1.2 | 2.4 | GO:2000282 | regulation of cellular amino acid biosynthetic process(GO:2000282) |
| 1.2 | 2.4 | GO:1903984 | positive regulation of TRAIL-activated apoptotic signaling pathway(GO:1903984) |
| 1.2 | 11.6 | GO:0030388 | fructose 1,6-bisphosphate metabolic process(GO:0030388) |
| 1.2 | 5.8 | GO:1903181 | regulation of dopamine biosynthetic process(GO:1903179) positive regulation of dopamine biosynthetic process(GO:1903181) |
| 1.1 | 2.3 | GO:0035622 | intrahepatic bile duct development(GO:0035622) |
| 1.1 | 2.2 | GO:0045168 | cell-cell signaling involved in cell fate commitment(GO:0045168) |
| 1.1 | 3.3 | GO:0018199 | peptidyl-glutamine modification(GO:0018199) |
| 1.1 | 4.4 | GO:0002484 | antigen processing and presentation of endogenous peptide antigen via MHC class I via ER pathway(GO:0002484) antigen processing and presentation of endogenous peptide antigen via MHC class I via ER pathway, TAP-dependent(GO:0002485) |
| 1.1 | 5.4 | GO:0042891 | antibiotic transport(GO:0042891) dipeptide transport(GO:0042938) |
| 1.1 | 5.4 | GO:0030951 | establishment or maintenance of microtubule cytoskeleton polarity(GO:0030951) |
| 1.1 | 3.2 | GO:0015910 | peroxisomal long-chain fatty acid import(GO:0015910) |
| 1.1 | 4.2 | GO:0071051 | polyadenylation-dependent snoRNA 3'-end processing(GO:0071051) |
| 1.0 | 3.1 | GO:0071638 | negative regulation of monocyte chemotactic protein-1 production(GO:0071638) |
| 1.0 | 4.0 | GO:0033030 | negative regulation of neutrophil apoptotic process(GO:0033030) |
| 1.0 | 1.0 | GO:0097278 | complement-dependent cytotoxicity(GO:0097278) |
| 1.0 | 2.9 | GO:0036118 | hyaluranon cable assembly(GO:0036118) regulation of hyaluranon cable assembly(GO:1900104) positive regulation of hyaluranon cable assembly(GO:1900106) |
| 1.0 | 3.9 | GO:0099527 | postsynapse to nucleus signaling pathway(GO:0099527) |
| 1.0 | 3.9 | GO:2000110 | protein sialylation(GO:1990743) negative regulation of macrophage apoptotic process(GO:2000110) |
| 0.9 | 2.8 | GO:1902524 | interferon-alpha biosynthetic process(GO:0045349) regulation of interferon-alpha biosynthetic process(GO:0045354) positive regulation of protein K48-linked ubiquitination(GO:1902524) |
| 0.9 | 1.9 | GO:0070343 | white fat cell proliferation(GO:0070343) regulation of white fat cell proliferation(GO:0070350) |
| 0.9 | 3.7 | GO:0045950 | negative regulation of mitotic recombination(GO:0045950) |
| 0.9 | 6.5 | GO:0051611 | negative regulation of neurotransmitter uptake(GO:0051581) serotonin uptake(GO:0051610) regulation of serotonin uptake(GO:0051611) negative regulation of serotonin uptake(GO:0051612) |
| 0.9 | 10.2 | GO:0021902 | commitment of neuronal cell to specific neuron type in forebrain(GO:0021902) |
| 0.9 | 4.6 | GO:0042045 | epithelial fluid transport(GO:0042045) |
| 0.9 | 3.7 | GO:0006668 | sphinganine-1-phosphate metabolic process(GO:0006668) |
| 0.9 | 1.8 | GO:0048682 | axon extension involved in regeneration(GO:0048677) sprouting of injured axon(GO:0048682) |
| 0.9 | 1.8 | GO:0072138 | mesenchymal cell proliferation involved in ureteric bud development(GO:0072138) |
| 0.9 | 10.9 | GO:0045602 | negative regulation of endothelial cell differentiation(GO:0045602) |
| 0.9 | 7.3 | GO:1901387 | positive regulation of voltage-gated calcium channel activity(GO:1901387) |
| 0.9 | 18.0 | GO:0040034 | regulation of development, heterochronic(GO:0040034) |
| 0.9 | 0.9 | GO:2000468 | regulation of peroxidase activity(GO:2000468) |
| 0.9 | 3.5 | GO:0046947 | hydroxylysine metabolic process(GO:0046946) hydroxylysine biosynthetic process(GO:0046947) |
| 0.9 | 6.0 | GO:0001542 | ovulation from ovarian follicle(GO:0001542) |
| 0.9 | 1.7 | GO:1902071 | regulation of hypoxia-inducible factor-1alpha signaling pathway(GO:1902071) |
| 0.9 | 1.7 | GO:0086046 | membrane depolarization during SA node cell action potential(GO:0086046) |
| 0.8 | 2.5 | GO:0019074 | viral genome packaging(GO:0019072) viral RNA genome packaging(GO:0019074) |
| 0.8 | 4.1 | GO:1905169 | protein localization to phagocytic vesicle(GO:1905161) regulation of protein localization to phagocytic vesicle(GO:1905169) positive regulation of protein localization to phagocytic vesicle(GO:1905171) |
| 0.8 | 0.8 | GO:2000297 | negative regulation of synapse maturation(GO:2000297) |
| 0.8 | 4.8 | GO:0070100 | negative regulation of chemokine-mediated signaling pathway(GO:0070100) |
| 0.8 | 7.8 | GO:1901386 | negative regulation of voltage-gated calcium channel activity(GO:1901386) |
| 0.7 | 3.0 | GO:0006659 | phosphatidylserine biosynthetic process(GO:0006659) |
| 0.7 | 4.4 | GO:0098707 | ferrous iron import into cell(GO:0097460) ferrous iron import across plasma membrane(GO:0098707) |
| 0.7 | 3.7 | GO:1900170 | negative regulation of glucocorticoid mediated signaling pathway(GO:1900170) |
| 0.7 | 5.8 | GO:0045198 | establishment of epithelial cell apical/basal polarity(GO:0045198) |
| 0.7 | 5.0 | GO:0016584 | nucleosome positioning(GO:0016584) |
| 0.7 | 1.4 | GO:0048520 | positive regulation of behavior(GO:0048520) |
| 0.7 | 1.4 | GO:1903596 | regulation of gap junction assembly(GO:1903596) |
| 0.7 | 2.0 | GO:0035964 | COPI-coated vesicle budding(GO:0035964) |
| 0.7 | 8.7 | GO:0033234 | negative regulation of protein sumoylation(GO:0033234) |
| 0.7 | 2.7 | GO:0060265 | positive regulation of respiratory burst involved in inflammatory response(GO:0060265) |
| 0.7 | 2.7 | GO:0061739 | protein lipidation involved in autophagosome assembly(GO:0061739) |
| 0.6 | 1.9 | GO:0097500 | receptor localization to nonmotile primary cilium(GO:0097500) |
| 0.6 | 0.6 | GO:0021593 | rhombomere morphogenesis(GO:0021593) |
| 0.6 | 6.2 | GO:0070886 | positive regulation of calcineurin-NFAT signaling cascade(GO:0070886) |
| 0.6 | 8.0 | GO:0043011 | myeloid dendritic cell differentiation(GO:0043011) |
| 0.6 | 3.7 | GO:1902998 | macrophage proliferation(GO:0061517) microglial cell proliferation(GO:0061518) regulation of neuronal signal transduction(GO:1902847) positive regulation of neurofibrillary tangle assembly(GO:1902998) |
| 0.6 | 4.3 | GO:0060372 | regulation of atrial cardiac muscle cell membrane repolarization(GO:0060372) |
| 0.6 | 2.4 | GO:0072272 | proximal/distal pattern formation involved in metanephric nephron development(GO:0072272) |
| 0.6 | 2.4 | GO:2000795 | negative regulation of epithelial cell proliferation involved in lung morphogenesis(GO:2000795) |
| 0.6 | 1.8 | GO:0060596 | regulation of transcription from RNA polymerase II promoter involved in myocardial precursor cell differentiation(GO:0003256) mammary placode formation(GO:0060596) |
| 0.6 | 3.0 | GO:0035405 | histone-threonine phosphorylation(GO:0035405) |
| 0.6 | 0.6 | GO:0072180 | mesonephric duct development(GO:0072177) mesonephric duct morphogenesis(GO:0072180) |
| 0.6 | 1.8 | GO:0070428 | granuloma formation(GO:0002432) toll-like receptor 5 signaling pathway(GO:0034146) regulation of nucleotide-binding oligomerization domain containing signaling pathway(GO:0070424) regulation of nucleotide-binding oligomerization domain containing 1 signaling pathway(GO:0070428) regulation of nucleotide-binding oligomerization domain containing 2 signaling pathway(GO:0070432) |
| 0.6 | 1.8 | GO:0035905 | ascending aorta development(GO:0035905) ascending aorta morphogenesis(GO:0035910) |
| 0.6 | 2.3 | GO:0090336 | positive regulation of brown fat cell differentiation(GO:0090336) |
| 0.6 | 11.0 | GO:0061298 | retina vasculature development in camera-type eye(GO:0061298) |
| 0.6 | 2.3 | GO:1990022 | RNA polymerase II complex import to nucleus(GO:0044376) RNA polymerase III complex localization to nucleus(GO:1990022) |
| 0.6 | 2.9 | GO:0048539 | bone marrow development(GO:0048539) |
| 0.6 | 5.1 | GO:0031339 | negative regulation of vesicle fusion(GO:0031339) |
| 0.6 | 1.7 | GO:0060158 | phospholipase C-activating dopamine receptor signaling pathway(GO:0060158) |
| 0.6 | 2.8 | GO:0034421 | post-translational protein acetylation(GO:0034421) |
| 0.5 | 3.2 | GO:0090037 | positive regulation of protein kinase C signaling(GO:0090037) |
| 0.5 | 1.6 | GO:0071500 | cellular response to nitrosative stress(GO:0071500) |
| 0.5 | 1.6 | GO:0035811 | negative regulation of urine volume(GO:0035811) |
| 0.5 | 1.6 | GO:0006592 | ornithine biosynthetic process(GO:0006592) |
| 0.5 | 3.1 | GO:0019896 | axonal transport of mitochondrion(GO:0019896) |
| 0.5 | 5.2 | GO:0019243 | methylglyoxal catabolic process to D-lactate via S-lactoyl-glutathione(GO:0019243) methylglyoxal catabolic process(GO:0051596) methylglyoxal catabolic process to lactate(GO:0061727) |
| 0.5 | 2.1 | GO:0010756 | positive regulation of plasminogen activation(GO:0010756) |
| 0.5 | 1.0 | GO:0070885 | negative regulation of calcineurin-NFAT signaling cascade(GO:0070885) |
| 0.5 | 1.5 | GO:0001869 | regulation of complement activation, lectin pathway(GO:0001868) negative regulation of complement activation, lectin pathway(GO:0001869) |
| 0.5 | 3.0 | GO:0016266 | O-glycan processing(GO:0016266) |
| 0.5 | 1.5 | GO:0072092 | ureteric bud invasion(GO:0072092) |
| 0.5 | 1.5 | GO:0071873 | response to norepinephrine(GO:0071873) |
| 0.5 | 2.4 | GO:1904721 | regulation of mRNA cleavage(GO:0031437) negative regulation of mRNA cleavage(GO:0031438) negative regulation of immunoglobulin secretion(GO:0051025) regulation of mRNA endonucleolytic cleavage involved in unfolded protein response(GO:1904720) negative regulation of mRNA endonucleolytic cleavage involved in unfolded protein response(GO:1904721) |
| 0.5 | 1.5 | GO:0045014 | carbon catabolite repression of transcription(GO:0045013) negative regulation of transcription by glucose(GO:0045014) |
| 0.5 | 4.3 | GO:0071285 | cellular response to lithium ion(GO:0071285) |
| 0.5 | 7.5 | GO:0060134 | prepulse inhibition(GO:0060134) |
| 0.5 | 2.3 | GO:2001286 | regulation of caveolin-mediated endocytosis(GO:2001286) |
| 0.5 | 1.4 | GO:0051660 | establishment of centrosome localization(GO:0051660) |
| 0.4 | 0.4 | GO:0048550 | negative regulation of pinocytosis(GO:0048550) |
| 0.4 | 3.4 | GO:0032836 | glomerular basement membrane development(GO:0032836) |
| 0.4 | 12.2 | GO:0010866 | regulation of triglyceride biosynthetic process(GO:0010866) |
| 0.4 | 1.3 | GO:0030200 | heparan sulfate proteoglycan catabolic process(GO:0030200) |
| 0.4 | 4.2 | GO:0002118 | aggressive behavior(GO:0002118) |
| 0.4 | 1.7 | GO:0072592 | oxygen metabolic process(GO:0072592) |
| 0.4 | 6.4 | GO:0045792 | negative regulation of cell size(GO:0045792) |
| 0.4 | 0.8 | GO:0010755 | regulation of plasminogen activation(GO:0010755) |
| 0.4 | 1.6 | GO:1902774 | late endosome to lysosome transport(GO:1902774) |
| 0.4 | 2.7 | GO:0031508 | pericentric heterochromatin assembly(GO:0031508) |
| 0.4 | 1.2 | GO:0071930 | negative regulation of transcription involved in G1/S transition of mitotic cell cycle(GO:0071930) |
| 0.4 | 1.2 | GO:0033364 | mast cell secretory granule organization(GO:0033364) |
| 0.4 | 2.7 | GO:0071699 | olfactory placode formation(GO:0030910) olfactory placode development(GO:0071698) olfactory placode morphogenesis(GO:0071699) |
| 0.4 | 3.1 | GO:0010745 | negative regulation of macrophage derived foam cell differentiation(GO:0010745) |
| 0.4 | 5.3 | GO:0090036 | regulation of protein kinase C signaling(GO:0090036) |
| 0.4 | 0.8 | GO:0035990 | tendon cell differentiation(GO:0035990) tendon formation(GO:0035992) sclerotome development(GO:0061056) |
| 0.4 | 2.3 | GO:2001170 | negative regulation of ATP biosynthetic process(GO:2001170) |
| 0.4 | 1.9 | GO:0050912 | detection of chemical stimulus involved in sensory perception(GO:0050907) detection of chemical stimulus involved in sensory perception of taste(GO:0050912) |
| 0.3 | 2.1 | GO:0051987 | positive regulation of attachment of spindle microtubules to kinetochore(GO:0051987) |
| 0.3 | 2.7 | GO:0048149 | behavioral response to ethanol(GO:0048149) |
| 0.3 | 2.0 | GO:0006287 | base-excision repair, gap-filling(GO:0006287) |
| 0.3 | 4.0 | GO:0048194 | Golgi vesicle budding(GO:0048194) |
| 0.3 | 8.1 | GO:0040015 | negative regulation of multicellular organism growth(GO:0040015) |
| 0.3 | 8.1 | GO:0016242 | negative regulation of macroautophagy(GO:0016242) |
| 0.3 | 2.7 | GO:1902083 | negative regulation of peptidyl-cysteine S-nitrosylation(GO:1902083) |
| 0.3 | 4.0 | GO:0072112 | renal filtration cell differentiation(GO:0061318) glomerular visceral epithelial cell differentiation(GO:0072112) glomerular epithelial cell differentiation(GO:0072311) |
| 0.3 | 0.6 | GO:0048859 | formation of anatomical boundary(GO:0048859) |
| 0.3 | 1.0 | GO:1903406 | regulation of sodium:potassium-exchanging ATPase activity(GO:1903406) |
| 0.3 | 1.0 | GO:0045054 | constitutive secretory pathway(GO:0045054) |
| 0.3 | 1.6 | GO:0015803 | branched-chain amino acid transport(GO:0015803) leucine transport(GO:0015820) |
| 0.3 | 1.3 | GO:0072531 | pyrimidine-containing compound transmembrane transport(GO:0072531) |
| 0.3 | 1.3 | GO:0042822 | pyridoxal phosphate metabolic process(GO:0042822) |
| 0.3 | 0.3 | GO:0097212 | lysosomal membrane organization(GO:0097212) |
| 0.3 | 4.3 | GO:0097435 | fibril organization(GO:0097435) |
| 0.3 | 2.2 | GO:0034472 | snRNA 3'-end processing(GO:0034472) |
| 0.3 | 2.5 | GO:0032020 | ISG15-protein conjugation(GO:0032020) |
| 0.3 | 3.1 | GO:0070070 | proton-transporting V-type ATPase complex assembly(GO:0070070) |
| 0.3 | 0.6 | GO:0051593 | response to folic acid(GO:0051593) |
| 0.3 | 2.7 | GO:1900034 | regulation of cellular response to heat(GO:1900034) |
| 0.3 | 9.3 | GO:0007520 | myoblast fusion(GO:0007520) |
| 0.3 | 2.7 | GO:2001014 | regulation of skeletal muscle cell differentiation(GO:2001014) |
| 0.3 | 9.8 | GO:0035335 | peptidyl-tyrosine dephosphorylation(GO:0035335) |
| 0.3 | 3.8 | GO:0045199 | maintenance of epithelial cell apical/basal polarity(GO:0045199) |
| 0.3 | 1.2 | GO:0043415 | positive regulation of skeletal muscle tissue regeneration(GO:0043415) |
| 0.3 | 1.4 | GO:0070303 | negative regulation of stress-activated MAPK cascade(GO:0032873) negative regulation of JNK cascade(GO:0046329) negative regulation of stress-activated protein kinase signaling cascade(GO:0070303) |
| 0.3 | 2.5 | GO:0035898 | parathyroid hormone secretion(GO:0035898) |
| 0.3 | 1.1 | GO:0043973 | histone H3-K4 acetylation(GO:0043973) |
| 0.3 | 2.0 | GO:0038028 | insulin receptor signaling pathway via phosphatidylinositol 3-kinase(GO:0038028) |
| 0.3 | 1.9 | GO:0045002 | double-strand break repair via single-strand annealing(GO:0045002) |
| 0.3 | 1.4 | GO:0006689 | ganglioside catabolic process(GO:0006689) |
| 0.3 | 0.8 | GO:0048369 | neural plate mediolateral regionalization(GO:0021998) mesoderm structural organization(GO:0048338) paraxial mesoderm structural organization(GO:0048352) lateral mesoderm morphogenesis(GO:0048369) lateral mesoderm formation(GO:0048370) lateral mesodermal cell differentiation(GO:0048371) lateral mesodermal cell fate commitment(GO:0048372) lateral mesodermal cell fate specification(GO:0048377) regulation of lateral mesodermal cell fate specification(GO:0048378) regulation of cardiac ventricle development(GO:1904412) positive regulation of cardiac ventricle development(GO:1904414) |
| 0.3 | 0.8 | GO:1902512 | positive regulation of apoptotic DNA fragmentation(GO:1902512) positive regulation of DNA catabolic process(GO:1903626) |
| 0.3 | 2.9 | GO:0014883 | transition between fast and slow fiber(GO:0014883) |
| 0.3 | 1.6 | GO:0036089 | cleavage furrow formation(GO:0036089) |
| 0.3 | 1.6 | GO:0006002 | fructose 6-phosphate metabolic process(GO:0006002) |
| 0.3 | 6.1 | GO:0007205 | protein kinase C-activating G-protein coupled receptor signaling pathway(GO:0007205) |
| 0.3 | 0.8 | GO:0006435 | threonyl-tRNA aminoacylation(GO:0006435) |
| 0.3 | 6.6 | GO:0001569 | patterning of blood vessels(GO:0001569) |
| 0.3 | 1.6 | GO:0031125 | rRNA 3'-end processing(GO:0031125) |
| 0.3 | 2.6 | GO:1904153 | negative regulation of protein exit from endoplasmic reticulum(GO:0070862) negative regulation of retrograde protein transport, ER to cytosol(GO:1904153) |
| 0.3 | 3.1 | GO:0034497 | protein localization to pre-autophagosomal structure(GO:0034497) |
| 0.3 | 1.0 | GO:0032769 | negative regulation of monooxygenase activity(GO:0032769) negative regulation of nitric-oxide synthase activity(GO:0051001) |
| 0.3 | 1.0 | GO:0070166 | enamel mineralization(GO:0070166) |
| 0.2 | 1.2 | GO:1902775 | mitochondrial large ribosomal subunit assembly(GO:1902775) |
| 0.2 | 2.7 | GO:0021796 | cerebral cortex regionalization(GO:0021796) |
| 0.2 | 8.1 | GO:0031365 | N-terminal protein amino acid modification(GO:0031365) |
| 0.2 | 5.4 | GO:0035036 | binding of sperm to zona pellucida(GO:0007339) sperm-egg recognition(GO:0035036) |
| 0.2 | 0.5 | GO:0070973 | protein localization to endoplasmic reticulum exit site(GO:0070973) |
| 0.2 | 0.2 | GO:1901341 | activation of store-operated calcium channel activity(GO:0032237) positive regulation of store-operated calcium channel activity(GO:1901341) |
| 0.2 | 1.0 | GO:2000741 | positive regulation of mesenchymal stem cell differentiation(GO:2000741) |
| 0.2 | 1.2 | GO:0034372 | very-low-density lipoprotein particle remodeling(GO:0034372) |
| 0.2 | 0.5 | GO:0006842 | tricarboxylic acid transport(GO:0006842) citrate transport(GO:0015746) |
| 0.2 | 1.4 | GO:0097646 | calcitonin family receptor signaling pathway(GO:0097646) amylin receptor signaling pathway(GO:0097647) |
| 0.2 | 0.9 | GO:0060907 | positive regulation of macrophage cytokine production(GO:0060907) |
| 0.2 | 1.2 | GO:0007256 | activation of JNKK activity(GO:0007256) |
| 0.2 | 1.6 | GO:0046549 | phenol-containing compound catabolic process(GO:0019336) retinal cone cell development(GO:0046549) |
| 0.2 | 3.9 | GO:0002115 | store-operated calcium entry(GO:0002115) |
| 0.2 | 0.7 | GO:1902396 | protein localization to bicellular tight junction(GO:1902396) |
| 0.2 | 3.6 | GO:0030150 | protein import into mitochondrial matrix(GO:0030150) |
| 0.2 | 2.5 | GO:0031998 | regulation of fatty acid beta-oxidation(GO:0031998) |
| 0.2 | 2.7 | GO:2001273 | regulation of glucose import in response to insulin stimulus(GO:2001273) |
| 0.2 | 2.2 | GO:0006268 | DNA unwinding involved in DNA replication(GO:0006268) |
| 0.2 | 0.4 | GO:0021506 | anterior neuropore closure(GO:0021506) neuropore closure(GO:0021995) |
| 0.2 | 6.6 | GO:0060351 | cartilage development involved in endochondral bone morphogenesis(GO:0060351) |
| 0.2 | 6.4 | GO:0000132 | establishment of mitotic spindle orientation(GO:0000132) |
| 0.2 | 5.6 | GO:0030866 | cortical actin cytoskeleton organization(GO:0030866) |
| 0.2 | 0.6 | GO:0002940 | tRNA N2-guanine methylation(GO:0002940) |
| 0.2 | 1.8 | GO:0051255 | spindle midzone assembly(GO:0051255) mitotic spindle midzone assembly(GO:0051256) |
| 0.2 | 12.9 | GO:1904893 | negative regulation of JAK-STAT cascade(GO:0046426) negative regulation of STAT cascade(GO:1904893) |
| 0.2 | 0.4 | GO:0021913 | regulation of transcription from RNA polymerase II promoter involved in spinal cord motor neuron fate specification(GO:0021912) regulation of transcription from RNA polymerase II promoter involved in ventral spinal cord interneuron specification(GO:0021913) |
| 0.2 | 1.4 | GO:0006105 | succinate metabolic process(GO:0006105) |
| 0.2 | 1.0 | GO:0007221 | positive regulation of transcription of Notch receptor target(GO:0007221) |
| 0.2 | 1.0 | GO:0071688 | striated muscle myosin thick filament assembly(GO:0071688) |
| 0.2 | 0.8 | GO:0045896 | regulation of transcription during mitosis(GO:0045896) positive regulation of transcription during mitosis(GO:0045897) |
| 0.2 | 0.8 | GO:0000393 | spliceosomal conformational changes to generate catalytic conformation(GO:0000393) |
| 0.2 | 0.4 | GO:1904778 | regulation of protein localization to cell cortex(GO:1904776) positive regulation of protein localization to cell cortex(GO:1904778) |
| 0.2 | 1.4 | GO:0043568 | positive regulation of insulin-like growth factor receptor signaling pathway(GO:0043568) |
| 0.2 | 3.2 | GO:0001833 | inner cell mass cell proliferation(GO:0001833) |
| 0.2 | 1.9 | GO:0045624 | positive regulation of T-helper cell differentiation(GO:0045624) |
| 0.2 | 2.5 | GO:0061179 | negative regulation of insulin secretion involved in cellular response to glucose stimulus(GO:0061179) |
| 0.2 | 1.9 | GO:0090527 | actin filament reorganization(GO:0090527) |
| 0.2 | 2.1 | GO:0070995 | NADPH oxidation(GO:0070995) |
| 0.2 | 0.8 | GO:1900220 | semaphorin-plexin signaling pathway involved in bone trabecula morphogenesis(GO:1900220) |
| 0.2 | 0.2 | GO:0044333 | Wnt signaling pathway involved in digestive tract morphogenesis(GO:0044333) |
| 0.2 | 2.6 | GO:0045671 | negative regulation of osteoclast differentiation(GO:0045671) |
| 0.2 | 1.1 | GO:0030263 | apoptotic chromosome condensation(GO:0030263) |
| 0.2 | 0.7 | GO:0006049 | UDP-N-acetylglucosamine catabolic process(GO:0006049) |
| 0.2 | 3.7 | GO:0015936 | coenzyme A metabolic process(GO:0015936) |
| 0.2 | 2.4 | GO:1904262 | negative regulation of TORC1 signaling(GO:1904262) |
| 0.2 | 2.7 | GO:0002495 | antigen processing and presentation of peptide antigen via MHC class II(GO:0002495) antigen processing and presentation of peptide or polysaccharide antigen via MHC class II(GO:0002504) |
| 0.2 | 1.4 | GO:0046415 | urate metabolic process(GO:0046415) |
| 0.2 | 5.2 | GO:0045026 | plasma membrane fusion(GO:0045026) |
| 0.2 | 1.3 | GO:0010820 | positive regulation of T cell chemotaxis(GO:0010820) |
| 0.2 | 3.4 | GO:0050434 | positive regulation of viral transcription(GO:0050434) |
| 0.2 | 6.1 | GO:0060325 | face morphogenesis(GO:0060325) |
| 0.2 | 3.8 | GO:0090083 | regulation of inclusion body assembly(GO:0090083) |
| 0.2 | 0.3 | GO:0003310 | pancreatic A cell differentiation(GO:0003310) |
| 0.2 | 1.4 | GO:0006013 | mannose metabolic process(GO:0006013) |
| 0.2 | 1.9 | GO:0046051 | UTP metabolic process(GO:0046051) |
| 0.2 | 5.6 | GO:0032728 | positive regulation of interferon-beta production(GO:0032728) |
| 0.2 | 0.9 | GO:0051534 | negative regulation of NFAT protein import into nucleus(GO:0051534) |
| 0.2 | 2.5 | GO:0008206 | bile acid metabolic process(GO:0008206) |
| 0.2 | 8.3 | GO:0061077 | chaperone-mediated protein folding(GO:0061077) |
| 0.2 | 1.4 | GO:0045647 | negative regulation of erythrocyte differentiation(GO:0045647) |
| 0.2 | 1.9 | GO:0016322 | neuron remodeling(GO:0016322) |
| 0.2 | 0.6 | GO:0000379 | tRNA-type intron splice site recognition and cleavage(GO:0000379) |
| 0.2 | 0.6 | GO:0045654 | positive regulation of megakaryocyte differentiation(GO:0045654) |
| 0.1 | 0.6 | GO:0031581 | hemidesmosome assembly(GO:0031581) |
| 0.1 | 4.6 | GO:0071480 | cellular response to gamma radiation(GO:0071480) |
| 0.1 | 3.8 | GO:0016578 | histone deubiquitination(GO:0016578) |
| 0.1 | 1.7 | GO:0034244 | negative regulation of transcription elongation from RNA polymerase II promoter(GO:0034244) |
| 0.1 | 0.7 | GO:0016601 | Rac protein signal transduction(GO:0016601) |
| 0.1 | 2.3 | GO:0060259 | regulation of feeding behavior(GO:0060259) |
| 0.1 | 5.2 | GO:0031952 | regulation of protein autophosphorylation(GO:0031952) |
| 0.1 | 0.7 | GO:0046598 | positive regulation of viral entry into host cell(GO:0046598) |
| 0.1 | 2.8 | GO:0030032 | lamellipodium assembly(GO:0030032) |
| 0.1 | 1.7 | GO:0048280 | vesicle fusion with Golgi apparatus(GO:0048280) |
| 0.1 | 1.1 | GO:0050908 | detection of light stimulus involved in visual perception(GO:0050908) detection of light stimulus involved in sensory perception(GO:0050962) |
| 0.1 | 5.9 | GO:0006023 | aminoglycan biosynthetic process(GO:0006023) |
| 0.1 | 0.5 | GO:2000628 | regulation of miRNA metabolic process(GO:2000628) |
| 0.1 | 0.8 | GO:0042699 | follicle-stimulating hormone signaling pathway(GO:0042699) |
| 0.1 | 4.0 | GO:0007566 | embryo implantation(GO:0007566) |
| 0.1 | 0.3 | GO:1901420 | negative regulation of vitamin D biosynthetic process(GO:0010957) vitamin D biosynthetic process(GO:0042368) negative regulation of vitamin metabolic process(GO:0046137) regulation of vitamin D biosynthetic process(GO:0060556) negative regulation of response to alcohol(GO:1901420) |
| 0.1 | 0.5 | GO:0015744 | succinate transport(GO:0015744) |
| 0.1 | 0.6 | GO:0060136 | embryonic process involved in female pregnancy(GO:0060136) |
| 0.1 | 2.3 | GO:0050873 | brown fat cell differentiation(GO:0050873) |
| 0.1 | 0.6 | GO:2000427 | eosinophil chemotaxis(GO:0048245) regulation of apoptotic cell clearance(GO:2000425) positive regulation of apoptotic cell clearance(GO:2000427) |
| 0.1 | 6.4 | GO:0001676 | long-chain fatty acid metabolic process(GO:0001676) |
| 0.1 | 0.4 | GO:0038145 | macrophage colony-stimulating factor signaling pathway(GO:0038145) |
| 0.1 | 1.0 | GO:0033564 | anterior/posterior axon guidance(GO:0033564) |
| 0.1 | 1.2 | GO:0046548 | retinal rod cell development(GO:0046548) |
| 0.1 | 1.1 | GO:0035428 | hexose transmembrane transport(GO:0035428) |
| 0.1 | 2.8 | GO:0014904 | myotube cell development(GO:0014904) |
| 0.1 | 0.5 | GO:0043461 | proton-transporting ATP synthase complex assembly(GO:0043461) proton-transporting ATP synthase complex biogenesis(GO:0070272) |
| 0.1 | 4.5 | GO:0006779 | porphyrin-containing compound biosynthetic process(GO:0006779) |
| 0.1 | 2.0 | GO:0000731 | DNA synthesis involved in DNA repair(GO:0000731) |
| 0.1 | 7.9 | GO:1903955 | positive regulation of protein targeting to mitochondrion(GO:1903955) |
| 0.1 | 0.8 | GO:0032534 | regulation of microvillus assembly(GO:0032534) |
| 0.1 | 2.2 | GO:0048266 | behavioral response to pain(GO:0048266) |
| 0.1 | 1.9 | GO:0006958 | complement activation, classical pathway(GO:0006958) |
| 0.1 | 2.2 | GO:0044458 | motile cilium assembly(GO:0044458) |
| 0.1 | 1.5 | GO:0048712 | negative regulation of astrocyte differentiation(GO:0048712) |
| 0.1 | 0.4 | GO:1903286 | regulation of potassium ion import(GO:1903286) positive regulation of potassium ion import(GO:1903288) |
| 0.1 | 1.0 | GO:1901409 | positive regulation of phosphorylation of RNA polymerase II C-terminal domain(GO:1901409) |
| 0.1 | 1.6 | GO:0048240 | sperm capacitation(GO:0048240) |
| 0.1 | 0.4 | GO:0010884 | positive regulation of lipid storage(GO:0010884) |
| 0.1 | 0.4 | GO:1901475 | pyruvate transmembrane transport(GO:1901475) |
| 0.1 | 0.5 | GO:0031507 | heterochromatin assembly(GO:0031507) |
| 0.1 | 0.9 | GO:1904667 | negative regulation of ubiquitin protein ligase activity(GO:1904667) |
| 0.1 | 0.8 | GO:0007263 | nitric oxide mediated signal transduction(GO:0007263) |
| 0.1 | 0.4 | GO:0051151 | negative regulation of smooth muscle cell differentiation(GO:0051151) |
| 0.1 | 0.3 | GO:1903624 | regulation of apoptotic DNA fragmentation(GO:1902510) regulation of DNA catabolic process(GO:1903624) |
| 0.1 | 1.1 | GO:0007413 | axonal fasciculation(GO:0007413) |
| 0.1 | 2.4 | GO:0000027 | ribosomal large subunit assembly(GO:0000027) |
| 0.1 | 1.5 | GO:0035272 | exocrine system development(GO:0035272) |
| 0.1 | 0.2 | GO:0006434 | seryl-tRNA aminoacylation(GO:0006434) |
| 0.1 | 0.2 | GO:1901096 | regulation of autophagosome maturation(GO:1901096) |
| 0.1 | 1.3 | GO:0032007 | negative regulation of TOR signaling(GO:0032007) |
| 0.1 | 0.8 | GO:0006123 | mitochondrial electron transport, cytochrome c to oxygen(GO:0006123) |
| 0.1 | 0.4 | GO:2000465 | regulation of glycogen (starch) synthase activity(GO:2000465) |
| 0.1 | 0.5 | GO:0035372 | protein localization to microtubule(GO:0035372) |
| 0.1 | 0.4 | GO:0032049 | cardiolipin biosynthetic process(GO:0032049) |
| 0.1 | 0.9 | GO:0043277 | apoptotic cell clearance(GO:0043277) |
| 0.1 | 0.4 | GO:0010566 | regulation of ketone biosynthetic process(GO:0010566) |
| 0.1 | 1.2 | GO:1900087 | positive regulation of G1/S transition of mitotic cell cycle(GO:1900087) |
| 0.1 | 0.5 | GO:0061087 | positive regulation of histone H3-K27 methylation(GO:0061087) |
| 0.1 | 1.5 | GO:0043550 | regulation of lipid kinase activity(GO:0043550) |
| 0.1 | 9.4 | GO:0007160 | cell-matrix adhesion(GO:0007160) |
| 0.1 | 4.9 | GO:0009408 | response to heat(GO:0009408) |
| 0.1 | 2.9 | GO:0070206 | protein trimerization(GO:0070206) |
| 0.1 | 0.5 | GO:0031086 | nuclear-transcribed mRNA catabolic process, deadenylation-independent decay(GO:0031086) deadenylation-independent decapping of nuclear-transcribed mRNA(GO:0031087) |
| 0.1 | 0.1 | GO:0051661 | maintenance of centrosome location(GO:0051661) |
| 0.1 | 0.5 | GO:0061469 | regulation of type B pancreatic cell proliferation(GO:0061469) |
| 0.1 | 0.3 | GO:0046709 | IDP metabolic process(GO:0046707) IDP catabolic process(GO:0046709) |
| 0.1 | 0.2 | GO:1904049 | regulation of spontaneous neurotransmitter secretion(GO:1904048) negative regulation of spontaneous neurotransmitter secretion(GO:1904049) |
| 0.1 | 1.1 | GO:0000338 | protein deneddylation(GO:0000338) |
| 0.1 | 0.4 | GO:0050995 | negative regulation of lipid catabolic process(GO:0050995) |
| 0.1 | 2.1 | GO:0006940 | regulation of smooth muscle contraction(GO:0006940) |
| 0.1 | 1.2 | GO:0061098 | positive regulation of protein tyrosine kinase activity(GO:0061098) |
| 0.1 | 1.0 | GO:0042993 | positive regulation of transcription factor import into nucleus(GO:0042993) |
| 0.1 | 1.2 | GO:0072337 | modified amino acid transport(GO:0072337) |
| 0.1 | 1.6 | GO:0000289 | nuclear-transcribed mRNA poly(A) tail shortening(GO:0000289) |
| 0.1 | 0.3 | GO:0006477 | protein sulfation(GO:0006477) |
| 0.1 | 4.7 | GO:0001889 | liver development(GO:0001889) |
| 0.1 | 2.6 | GO:0010038 | response to metal ion(GO:0010038) |
| 0.1 | 0.5 | GO:0098789 | pre-mRNA cleavage required for polyadenylation(GO:0098789) |
| 0.1 | 0.5 | GO:0097369 | sodium ion import(GO:0097369) |
| 0.1 | 0.3 | GO:0014823 | response to activity(GO:0014823) |
| 0.1 | 0.3 | GO:0001516 | prostaglandin biosynthetic process(GO:0001516) prostanoid biosynthetic process(GO:0046457) |
| 0.1 | 4.0 | GO:0006888 | ER to Golgi vesicle-mediated transport(GO:0006888) |
| 0.1 | 0.9 | GO:0000028 | ribosomal small subunit assembly(GO:0000028) |
| 0.0 | 0.2 | GO:0006953 | acute-phase response(GO:0006953) |
| 0.0 | 1.2 | GO:0090102 | cochlea development(GO:0090102) |
| 0.0 | 0.7 | GO:0046324 | regulation of glucose import(GO:0046324) |
| 0.0 | 1.0 | GO:0006298 | mismatch repair(GO:0006298) |
| 0.0 | 3.3 | GO:0007156 | homophilic cell adhesion via plasma membrane adhesion molecules(GO:0007156) |
| 0.0 | 0.5 | GO:0071157 | negative regulation of cell cycle arrest(GO:0071157) |
| 0.0 | 0.6 | GO:0035020 | regulation of Rac protein signal transduction(GO:0035020) |
| 0.0 | 0.3 | GO:0060539 | diaphragm development(GO:0060539) |
| 0.0 | 0.3 | GO:0055088 | lipid homeostasis(GO:0055088) |
| 0.0 | 0.4 | GO:0070475 | rRNA base methylation(GO:0070475) |
| 0.0 | 1.4 | GO:0048384 | retinoic acid receptor signaling pathway(GO:0048384) |
| 0.0 | 0.2 | GO:0042360 | vitamin E metabolic process(GO:0042360) |
| 0.0 | 1.1 | GO:0051443 | positive regulation of ubiquitin-protein transferase activity(GO:0051443) |
| 0.0 | 1.0 | GO:0006891 | intra-Golgi vesicle-mediated transport(GO:0006891) |
| 0.0 | 1.0 | GO:0015985 | energy coupled proton transport, down electrochemical gradient(GO:0015985) ATP synthesis coupled proton transport(GO:0015986) |
| 0.0 | 0.4 | GO:0042255 | ribosome assembly(GO:0042255) |
| 0.0 | 0.2 | GO:0006108 | malate metabolic process(GO:0006108) |
| 0.0 | 0.5 | GO:0048009 | insulin-like growth factor receptor signaling pathway(GO:0048009) |
| 0.0 | 0.3 | GO:0050850 | positive regulation of calcium-mediated signaling(GO:0050850) |
| 0.0 | 0.4 | GO:0002227 | innate immune response in mucosa(GO:0002227) |
| 0.0 | 0.3 | GO:0036506 | maintenance of unfolded protein(GO:0036506) tail-anchored membrane protein insertion into ER membrane(GO:0071816) maintenance of unfolded protein involved in ERAD pathway(GO:1904378) |
| 0.0 | 0.3 | GO:0015693 | magnesium ion transport(GO:0015693) |
| 0.0 | 2.4 | GO:0042147 | retrograde transport, endosome to Golgi(GO:0042147) |
| 0.0 | 0.5 | GO:0044065 | regulation of respiratory system process(GO:0044065) |
| 0.0 | 0.7 | GO:0002474 | antigen processing and presentation of peptide antigen via MHC class I(GO:0002474) |
| 0.0 | 0.2 | GO:0090070 | positive regulation of ribosome biogenesis(GO:0090070) positive regulation of rRNA processing(GO:2000234) |
| 0.0 | 0.3 | GO:0021542 | dentate gyrus development(GO:0021542) |
| 0.0 | 0.3 | GO:0019884 | antigen processing and presentation of exogenous antigen(GO:0019884) |
| 0.0 | 0.3 | GO:0036342 | post-anal tail morphogenesis(GO:0036342) |
| 0.0 | 0.7 | GO:0048286 | lung alveolus development(GO:0048286) |
| 0.0 | 0.1 | GO:0060040 | retinal bipolar neuron differentiation(GO:0060040) |
| 0.0 | 1.1 | GO:0048663 | neuron fate commitment(GO:0048663) |
| 0.0 | 0.1 | GO:0060613 | fat pad development(GO:0060613) |
| 0.0 | 1.6 | GO:0002181 | cytoplasmic translation(GO:0002181) |
| 0.0 | 0.4 | GO:0097034 | mitochondrial respiratory chain complex IV assembly(GO:0033617) mitochondrial respiratory chain complex IV biogenesis(GO:0097034) |
| 0.0 | 0.9 | GO:0031146 | SCF-dependent proteasomal ubiquitin-dependent protein catabolic process(GO:0031146) |
| 0.0 | 0.6 | GO:0035518 | histone H2A monoubiquitination(GO:0035518) |
| 0.0 | 0.9 | GO:0008542 | visual learning(GO:0008542) |
| 0.0 | 0.4 | GO:0033539 | fatty acid beta-oxidation using acyl-CoA dehydrogenase(GO:0033539) |
| 0.0 | 0.1 | GO:0090282 | trophectodermal cellular morphogenesis(GO:0001831) trophectodermal cell proliferation(GO:0001834) positive regulation of transcription involved in G1/S transition of mitotic cell cycle(GO:0071931) positive regulation of transcription involved in G2/M transition of mitotic cell cycle(GO:0090282) |
| 0.0 | 0.2 | GO:0019368 | fatty acid elongation, saturated fatty acid(GO:0019367) fatty acid elongation, unsaturated fatty acid(GO:0019368) fatty acid elongation, monounsaturated fatty acid(GO:0034625) fatty acid elongation, polyunsaturated fatty acid(GO:0034626) |
| 0.0 | 0.3 | GO:0030500 | regulation of bone mineralization(GO:0030500) |
| 0.0 | 1.1 | GO:0010923 | negative regulation of phosphatase activity(GO:0010923) |
| 0.0 | 1.0 | GO:0008625 | extrinsic apoptotic signaling pathway via death domain receptors(GO:0008625) |
| 0.0 | 0.7 | GO:0006493 | protein O-linked glycosylation(GO:0006493) |
| 0.0 | 0.3 | GO:0048146 | positive regulation of fibroblast proliferation(GO:0048146) |
| 0.0 | 1.9 | GO:0009615 | response to virus(GO:0009615) |
| 0.0 | 0.2 | GO:0070200 | establishment of protein localization to telomere(GO:0070200) |
| 0.0 | 0.8 | GO:0007631 | feeding behavior(GO:0007631) |
| 0.0 | 0.3 | GO:0043984 | histone H4-K16 acetylation(GO:0043984) |
| 0.0 | 0.2 | GO:0006582 | melanin metabolic process(GO:0006582) melanin biosynthetic process(GO:0042438) |
| 0.0 | 1.7 | GO:0051028 | mRNA transport(GO:0051028) |
| 0.0 | 0.2 | GO:0043153 | photoperiodism(GO:0009648) entrainment of circadian clock by photoperiod(GO:0043153) |
| 0.0 | 0.7 | GO:0009060 | aerobic respiration(GO:0009060) |
| 0.0 | 0.5 | GO:0097031 | NADH dehydrogenase complex assembly(GO:0010257) mitochondrial respiratory chain complex I assembly(GO:0032981) mitochondrial respiratory chain complex I biogenesis(GO:0097031) |
| 0.0 | 0.3 | GO:0051489 | regulation of filopodium assembly(GO:0051489) |
| 0.0 | 0.2 | GO:0030488 | tRNA methylation(GO:0030488) |
| 0.0 | 0.0 | GO:0061300 | cerebellum vasculature development(GO:0061300) |
Gene overrepresentation in cellular_component category:
| Log-likelihood per target | Total log-likelihood | Term | Description |
|---|---|---|---|
| 8.2 | 32.7 | GO:0097450 | astrocyte end-foot(GO:0097450) |
| 3.3 | 10.0 | GO:0071953 | elastic fiber(GO:0071953) |
| 2.7 | 16.3 | GO:0035976 | AP1 complex(GO:0035976) |
| 2.3 | 7.0 | GO:0005588 | collagen type V trimer(GO:0005588) |
| 1.9 | 7.5 | GO:0008282 | ATP-sensitive potassium channel complex(GO:0008282) |
| 1.8 | 3.6 | GO:0036488 | CHOP-C/EBP complex(GO:0036488) |
| 1.7 | 5.1 | GO:0030934 | collagen type XII trimer(GO:0005595) anchoring collagen complex(GO:0030934) |
| 1.6 | 6.5 | GO:0014802 | terminal cisterna(GO:0014802) |
| 1.5 | 4.6 | GO:0031088 | platelet dense granule membrane(GO:0031088) |
| 1.5 | 7.5 | GO:0033093 | Weibel-Palade body(GO:0033093) |
| 1.2 | 15.0 | GO:0042612 | MHC class I protein complex(GO:0042612) |
| 1.2 | 6.2 | GO:0048237 | rough endoplasmic reticulum lumen(GO:0048237) |
| 1.1 | 4.2 | GO:0032280 | symmetric synapse(GO:0032280) |
| 0.7 | 2.9 | GO:0071148 | TEAD-1-YAP complex(GO:0071148) |
| 0.7 | 9.5 | GO:0034098 | VCP-NPL4-UFD1 AAA ATPase complex(GO:0034098) |
| 0.7 | 3.4 | GO:0005587 | collagen type IV trimer(GO:0005587) network-forming collagen trimer(GO:0098642) collagen network(GO:0098645) basement membrane collagen trimer(GO:0098651) |
| 0.6 | 4.4 | GO:0005638 | lamin filament(GO:0005638) |
| 0.6 | 6.4 | GO:0031931 | TORC1 complex(GO:0031931) |
| 0.6 | 4.4 | GO:0033391 | chromatoid body(GO:0033391) |
| 0.6 | 4.4 | GO:0097433 | dense body(GO:0097433) |
| 0.5 | 9.1 | GO:0032593 | insulin-responsive compartment(GO:0032593) |
| 0.5 | 3.7 | GO:0034366 | spherical high-density lipoprotein particle(GO:0034366) |
| 0.5 | 12.1 | GO:0042470 | melanosome(GO:0042470) pigment granule(GO:0048770) |
| 0.5 | 1.6 | GO:0034673 | inhibin-betaglycan-ActRII complex(GO:0034673) |
| 0.5 | 9.8 | GO:0005605 | basal lamina(GO:0005605) |
| 0.5 | 1.9 | GO:0005594 | collagen type IX trimer(GO:0005594) |
| 0.5 | 5.6 | GO:0042622 | photoreceptor outer segment membrane(GO:0042622) |
| 0.5 | 7.3 | GO:0005614 | interstitial matrix(GO:0005614) |
| 0.4 | 1.7 | GO:0032021 | NELF complex(GO:0032021) |
| 0.4 | 4.2 | GO:0032591 | dendritic spine membrane(GO:0032591) |
| 0.4 | 14.1 | GO:0051233 | spindle midzone(GO:0051233) |
| 0.4 | 5.4 | GO:0002199 | zona pellucida receptor complex(GO:0002199) |
| 0.4 | 2.0 | GO:0001652 | granular component(GO:0001652) |
| 0.4 | 3.6 | GO:0005742 | mitochondrial outer membrane translocase complex(GO:0005742) |
| 0.4 | 3.9 | GO:0000138 | Golgi trans cisterna(GO:0000138) |
| 0.4 | 4.2 | GO:0000176 | nuclear exosome (RNase complex)(GO:0000176) |
| 0.4 | 5.7 | GO:0034045 | pre-autophagosomal structure membrane(GO:0034045) |
| 0.4 | 2.6 | GO:0005785 | signal recognition particle receptor complex(GO:0005785) |
| 0.4 | 1.1 | GO:0043625 | delta DNA polymerase complex(GO:0043625) |
| 0.4 | 1.4 | GO:0045283 | mitochondrial respiratory chain complex II, succinate dehydrogenase complex (ubiquinone)(GO:0005749) succinate dehydrogenase complex (ubiquinone)(GO:0045257) respiratory chain complex II(GO:0045273) succinate dehydrogenase complex(GO:0045281) fumarate reductase complex(GO:0045283) |
| 0.3 | 36.1 | GO:0030175 | filopodium(GO:0030175) |
| 0.3 | 5.2 | GO:0012510 | trans-Golgi network transport vesicle membrane(GO:0012510) |
| 0.3 | 0.6 | GO:0044299 | C-fiber(GO:0044299) |
| 0.3 | 2.5 | GO:0042589 | zymogen granule membrane(GO:0042589) |
| 0.3 | 25.6 | GO:0072562 | blood microparticle(GO:0072562) |
| 0.3 | 2.8 | GO:0031390 | Ctf18 RFC-like complex(GO:0031390) |
| 0.3 | 1.5 | GO:0035032 | phosphatidylinositol 3-kinase complex, class III(GO:0035032) |
| 0.3 | 1.2 | GO:0035189 | Rb-E2F complex(GO:0035189) |
| 0.3 | 0.9 | GO:0044753 | amphisome(GO:0044753) |
| 0.3 | 1.4 | GO:0002193 | MAML1-RBP-Jkappa- ICN1 complex(GO:0002193) |
| 0.3 | 5.9 | GO:0000788 | nuclear nucleosome(GO:0000788) |
| 0.3 | 54.7 | GO:0005578 | proteinaceous extracellular matrix(GO:0005578) |
| 0.3 | 11.2 | GO:0030173 | integral component of Golgi membrane(GO:0030173) |
| 0.3 | 5.7 | GO:0043657 | host(GO:0018995) host cell part(GO:0033643) host cell(GO:0043657) other organism(GO:0044215) other organism cell(GO:0044216) other organism part(GO:0044217) |
| 0.3 | 1.5 | GO:0070776 | H3 histone acetyltransferase complex(GO:0070775) MOZ/MORF histone acetyltransferase complex(GO:0070776) |
| 0.2 | 13.6 | GO:0005581 | collagen trimer(GO:0005581) |
| 0.2 | 3.7 | GO:0031229 | integral component of nuclear inner membrane(GO:0005639) intrinsic component of nuclear inner membrane(GO:0031229) |
| 0.2 | 0.7 | GO:0016600 | flotillin complex(GO:0016600) |
| 0.2 | 0.9 | GO:0070022 | transforming growth factor beta receptor homodimeric complex(GO:0070022) |
| 0.2 | 3.4 | GO:0031083 | BLOC-1 complex(GO:0031083) |
| 0.2 | 1.8 | GO:0030478 | actin cap(GO:0030478) |
| 0.2 | 15.2 | GO:0005791 | rough endoplasmic reticulum(GO:0005791) |
| 0.2 | 1.5 | GO:0005964 | phosphorylase kinase complex(GO:0005964) |
| 0.2 | 31.9 | GO:0031012 | extracellular matrix(GO:0031012) |
| 0.2 | 2.4 | GO:0061700 | GATOR2 complex(GO:0061700) |
| 0.2 | 1.4 | GO:0014704 | intercalated disc(GO:0014704) |
| 0.2 | 1.2 | GO:0042588 | zymogen granule(GO:0042588) |
| 0.2 | 8.2 | GO:0031985 | Golgi cisterna(GO:0031985) |
| 0.2 | 2.7 | GO:0005662 | DNA replication factor A complex(GO:0005662) |
| 0.2 | 1.1 | GO:0016602 | CCAAT-binding factor complex(GO:0016602) |
| 0.2 | 1.4 | GO:0042582 | primary lysosome(GO:0005766) azurophil granule(GO:0042582) |
| 0.2 | 1.2 | GO:0034364 | high-density lipoprotein particle(GO:0034364) |
| 0.2 | 1.2 | GO:0071012 | catalytic step 1 spliceosome(GO:0071012) |
| 0.2 | 1.0 | GO:0005859 | muscle myosin complex(GO:0005859) |
| 0.2 | 1.9 | GO:0031528 | microvillus membrane(GO:0031528) |
| 0.2 | 1.0 | GO:0045261 | mitochondrial proton-transporting ATP synthase complex, catalytic core F(1)(GO:0000275) proton-transporting ATP synthase complex, catalytic core F(1)(GO:0045261) |
| 0.2 | 1.0 | GO:1990316 | ATG1/ULK1 kinase complex(GO:1990316) |
| 0.2 | 16.7 | GO:0000932 | cytoplasmic mRNA processing body(GO:0000932) |
| 0.2 | 1.1 | GO:0031465 | Cul4B-RING E3 ubiquitin ligase complex(GO:0031465) |
| 0.2 | 6.2 | GO:0005669 | transcription factor TFIID complex(GO:0005669) |
| 0.2 | 1.4 | GO:0030991 | intraciliary transport particle A(GO:0030991) |
| 0.2 | 2.4 | GO:0097228 | sperm principal piece(GO:0097228) |
| 0.1 | 1.0 | GO:0048787 | presynaptic active zone membrane(GO:0048787) |
| 0.1 | 19.2 | GO:0044798 | nuclear transcription factor complex(GO:0044798) |
| 0.1 | 0.4 | GO:0033596 | TSC1-TSC2 complex(GO:0033596) |
| 0.1 | 25.9 | GO:0005777 | peroxisome(GO:0005777) microbody(GO:0042579) |
| 0.1 | 0.7 | GO:0009331 | glycerol-3-phosphate dehydrogenase complex(GO:0009331) |
| 0.1 | 5.3 | GO:0005902 | microvillus(GO:0005902) |
| 0.1 | 2.2 | GO:0097225 | sperm midpiece(GO:0097225) |
| 0.1 | 1.3 | GO:0022626 | cytosolic ribosome(GO:0022626) |
| 0.1 | 7.7 | GO:0030672 | synaptic vesicle membrane(GO:0030672) exocytic vesicle membrane(GO:0099501) |
| 0.1 | 6.0 | GO:0045177 | apical part of cell(GO:0045177) |
| 0.1 | 2.2 | GO:0016327 | apicolateral plasma membrane(GO:0016327) |
| 0.1 | 0.4 | GO:1990682 | CSF1-CSF1R complex(GO:1990682) |
| 0.1 | 1.0 | GO:0090571 | RNA polymerase II transcription repressor complex(GO:0090571) |
| 0.1 | 0.6 | GO:0033180 | proton-transporting two-sector ATPase complex, catalytic domain(GO:0033178) proton-transporting V-type ATPase, V1 domain(GO:0033180) |
| 0.1 | 1.3 | GO:0070938 | contractile ring(GO:0070938) |
| 0.1 | 6.8 | GO:0022625 | cytosolic large ribosomal subunit(GO:0022625) |
| 0.1 | 3.0 | GO:0030667 | secretory granule membrane(GO:0030667) |
| 0.1 | 3.9 | GO:0016592 | mediator complex(GO:0016592) |
| 0.1 | 0.2 | GO:0020018 | ciliary pocket(GO:0020016) ciliary pocket membrane(GO:0020018) |
| 0.1 | 3.0 | GO:0005834 | heterotrimeric G-protein complex(GO:0005834) |
| 0.1 | 3.3 | GO:0001917 | photoreceptor inner segment(GO:0001917) |
| 0.1 | 0.3 | GO:0043224 | nuclear SCF ubiquitin ligase complex(GO:0043224) |
| 0.1 | 2.7 | GO:0032588 | trans-Golgi network membrane(GO:0032588) |
| 0.1 | 0.6 | GO:0000214 | tRNA-intron endonuclease complex(GO:0000214) |
| 0.1 | 1.5 | GO:0031143 | pseudopodium(GO:0031143) |
| 0.1 | 9.7 | GO:0000118 | histone deacetylase complex(GO:0000118) |
| 0.1 | 0.6 | GO:0030914 | STAGA complex(GO:0030914) |
| 0.1 | 1.3 | GO:0016589 | NURF complex(GO:0016589) |
| 0.1 | 1.6 | GO:0022627 | cytosolic small ribosomal subunit(GO:0022627) |
| 0.1 | 3.1 | GO:0000786 | nucleosome(GO:0000786) |
| 0.1 | 5.8 | GO:0016529 | sarcoplasmic reticulum(GO:0016529) |
| 0.1 | 5.3 | GO:0005901 | caveola(GO:0005901) |
| 0.1 | 0.3 | GO:0031021 | interphase microtubule organizing center(GO:0031021) |
| 0.1 | 15.1 | GO:0005769 | early endosome(GO:0005769) |
| 0.1 | 54.0 | GO:0005615 | extracellular space(GO:0005615) |
| 0.1 | 26.7 | GO:0005925 | focal adhesion(GO:0005925) |
| 0.1 | 0.3 | GO:0005885 | Arp2/3 protein complex(GO:0005885) |
| 0.1 | 0.4 | GO:0008622 | epsilon DNA polymerase complex(GO:0008622) |
| 0.1 | 1.0 | GO:0017119 | Golgi transport complex(GO:0017119) |
| 0.1 | 1.7 | GO:0031201 | SNARE complex(GO:0031201) |
| 0.1 | 0.4 | GO:0061574 | ASAP complex(GO:0061574) |
| 0.1 | 2.8 | GO:0005793 | endoplasmic reticulum-Golgi intermediate compartment(GO:0005793) |
| 0.1 | 1.0 | GO:0005751 | mitochondrial respiratory chain complex IV(GO:0005751) |
| 0.1 | 0.8 | GO:0030014 | CCR4-NOT complex(GO:0030014) |
| 0.1 | 1.0 | GO:0055038 | recycling endosome membrane(GO:0055038) |
| 0.1 | 2.1 | GO:0097546 | ciliary base(GO:0097546) |
| 0.1 | 1.1 | GO:0005665 | DNA-directed RNA polymerase II, core complex(GO:0005665) |
| 0.1 | 0.3 | GO:0070876 | SOSS complex(GO:0070876) |
| 0.1 | 11.3 | GO:0005667 | transcription factor complex(GO:0005667) |
| 0.1 | 0.2 | GO:0071817 | MMXD complex(GO:0071817) |
| 0.1 | 0.3 | GO:0072487 | MSL complex(GO:0072487) |
| 0.1 | 0.5 | GO:0005677 | chromatin silencing complex(GO:0005677) |
| 0.1 | 2.0 | GO:0031594 | neuromuscular junction(GO:0031594) |
| 0.0 | 1.0 | GO:0097440 | apical dendrite(GO:0097440) |
| 0.0 | 1.9 | GO:0042645 | nucleoid(GO:0009295) mitochondrial nucleoid(GO:0042645) |
| 0.0 | 0.3 | GO:0071818 | BAT3 complex(GO:0071818) ER membrane insertion complex(GO:0072379) |
| 0.0 | 0.1 | GO:0070557 | PCNA-p21 complex(GO:0070557) |
| 0.0 | 0.6 | GO:0070971 | endoplasmic reticulum exit site(GO:0070971) |
| 0.0 | 1.2 | GO:0008021 | synaptic vesicle(GO:0008021) |
| 0.0 | 0.4 | GO:0008385 | IkappaB kinase complex(GO:0008385) |
| 0.0 | 0.2 | GO:0043527 | tRNA methyltransferase complex(GO:0043527) |
| 0.0 | 0.3 | GO:0033588 | Elongator holoenzyme complex(GO:0033588) |
| 0.0 | 1.6 | GO:0005871 | kinesin complex(GO:0005871) |
| 0.0 | 0.5 | GO:0005847 | mRNA cleavage and polyadenylation specificity factor complex(GO:0005847) |
| 0.0 | 3.1 | GO:0000922 | spindle pole(GO:0000922) |
| 0.0 | 1.1 | GO:0008180 | COP9 signalosome(GO:0008180) |
| 0.0 | 0.8 | GO:0005758 | mitochondrial intermembrane space(GO:0005758) |
| 0.0 | 1.8 | GO:0010008 | endosome membrane(GO:0010008) |
| 0.0 | 0.8 | GO:0005657 | replication fork(GO:0005657) |
| 0.0 | 1.4 | GO:0031519 | PcG protein complex(GO:0031519) |
| 0.0 | 1.1 | GO:0032993 | protein-DNA complex(GO:0032993) |
| 0.0 | 0.6 | GO:0035861 | site of double-strand break(GO:0035861) |
| 0.0 | 1.3 | GO:0031463 | Cul3-RING ubiquitin ligase complex(GO:0031463) |
| 0.0 | 0.5 | GO:0005788 | endoplasmic reticulum lumen(GO:0005788) |
| 0.0 | 0.2 | GO:0030688 | preribosome, small subunit precursor(GO:0030688) |
| 0.0 | 1.0 | GO:0031225 | anchored component of membrane(GO:0031225) |
| 0.0 | 0.4 | GO:0005798 | Golgi-associated vesicle(GO:0005798) |
| 0.0 | 1.3 | GO:0030176 | integral component of endoplasmic reticulum membrane(GO:0030176) |
| 0.0 | 5.5 | GO:0005743 | mitochondrial inner membrane(GO:0005743) |
| 0.0 | 15.8 | GO:0005739 | mitochondrion(GO:0005739) |
| 0.0 | 0.7 | GO:0012506 | vesicle membrane(GO:0012506) |
| 0.0 | 0.2 | GO:0035327 | transcriptionally active chromatin(GO:0035327) |
Gene overrepresentation in molecular_function category:
| Log-likelihood per target | Total log-likelihood | Term | Description |
|---|---|---|---|
| 7.7 | 23.1 | GO:0036313 | phosphatidylinositol 3-kinase catalytic subunit binding(GO:0036313) |
| 7.0 | 28.1 | GO:0015349 | thyroid hormone transmembrane transporter activity(GO:0015349) |
| 6.1 | 24.3 | GO:0004667 | prostaglandin-D synthase activity(GO:0004667) |
| 4.8 | 42.9 | GO:0070324 | thyroid hormone binding(GO:0070324) |
| 3.6 | 14.3 | GO:0016647 | oxidoreductase activity, acting on the CH-NH group of donors, oxygen as acceptor(GO:0016647) |
| 3.3 | 13.3 | GO:0008131 | primary amine oxidase activity(GO:0008131) |
| 3.1 | 12.3 | GO:0016286 | small conductance calcium-activated potassium channel activity(GO:0016286) |
| 2.8 | 11.3 | GO:0047844 | deoxycytidine deaminase activity(GO:0047844) |
| 2.7 | 8.0 | GO:0004686 | elongation factor-2 kinase activity(GO:0004686) |
| 2.5 | 22.4 | GO:0036122 | BMP binding(GO:0036122) |
| 2.0 | 10.0 | GO:0005030 | neurotrophin receptor activity(GO:0005030) |
| 1.9 | 11.6 | GO:0004332 | fructose-bisphosphate aldolase activity(GO:0004332) |
| 1.9 | 9.6 | GO:0070320 | inward rectifier potassium channel inhibitor activity(GO:0070320) |
| 1.8 | 5.4 | GO:0042936 | dipeptide transporter activity(GO:0042936) |
| 1.7 | 5.2 | GO:0098809 | nitrite reductase activity(GO:0098809) |
| 1.5 | 4.6 | GO:0005220 | inositol 1,4,5-trisphosphate-sensitive calcium-release channel activity(GO:0005220) |
| 1.5 | 9.1 | GO:0045545 | syndecan binding(GO:0045545) |
| 1.5 | 5.8 | GO:0016971 | flavin-linked sulfhydryl oxidase activity(GO:0016971) |
| 1.4 | 31.5 | GO:0050431 | transforming growth factor beta binding(GO:0050431) |
| 1.3 | 3.8 | GO:0004517 | nitric-oxide synthase activity(GO:0004517) |
| 1.2 | 12.4 | GO:0070700 | BMP receptor binding(GO:0070700) |
| 1.2 | 4.9 | GO:0004720 | protein-lysine 6-oxidase activity(GO:0004720) |
| 1.2 | 14.3 | GO:0050693 | LBD domain binding(GO:0050693) |
| 1.1 | 6.5 | GO:0086008 | voltage-gated potassium channel activity involved in cardiac muscle cell action potential repolarization(GO:0086008) |
| 1.0 | 2.1 | GO:0070052 | collagen V binding(GO:0070052) |
| 1.0 | 9.3 | GO:0038062 | protein tyrosine kinase collagen receptor activity(GO:0038062) |
| 1.0 | 22.5 | GO:0005520 | insulin-like growth factor binding(GO:0005520) |
| 1.0 | 4.9 | GO:0008269 | JAK pathway signal transduction adaptor activity(GO:0008269) |
| 1.0 | 2.9 | GO:0004415 | hyalurononglucosaminidase activity(GO:0004415) hyaluronan synthase activity(GO:0050501) |
| 0.9 | 6.6 | GO:0001849 | complement component C1q binding(GO:0001849) |
| 0.9 | 3.7 | GO:0038049 | glucocorticoid receptor activity(GO:0004883) transcription factor activity, ligand-activated RNA polymerase II transcription factor binding(GO:0038049) glucocorticoid-activated RNA polymerase II transcription factor binding transcription factor activity(GO:0038051) |
| 0.9 | 2.7 | GO:0004022 | alcohol dehydrogenase (NAD) activity(GO:0004022) |
| 0.9 | 3.5 | GO:0008475 | procollagen-lysine 5-dioxygenase activity(GO:0008475) |
| 0.9 | 11.2 | GO:0016863 | intramolecular oxidoreductase activity, transposing C=C bonds(GO:0016863) |
| 0.9 | 4.3 | GO:0004792 | thiosulfate sulfurtransferase activity(GO:0004792) |
| 0.8 | 4.2 | GO:1990239 | steroid hormone binding(GO:1990239) |
| 0.8 | 3.3 | GO:0003810 | protein-glutamine gamma-glutamyltransferase activity(GO:0003810) |
| 0.8 | 4.9 | GO:0005004 | GPI-linked ephrin receptor activity(GO:0005004) PH domain binding(GO:0042731) |
| 0.8 | 11.8 | GO:0017017 | MAP kinase tyrosine/serine/threonine phosphatase activity(GO:0017017) |
| 0.8 | 3.9 | GO:0003835 | beta-galactoside alpha-2,6-sialyltransferase activity(GO:0003835) |
| 0.7 | 6.5 | GO:0019865 | immunoglobulin binding(GO:0019865) |
| 0.7 | 4.3 | GO:0019784 | NEDD8-specific protease activity(GO:0019784) |
| 0.7 | 8.5 | GO:0008191 | metalloendopeptidase inhibitor activity(GO:0008191) |
| 0.7 | 6.3 | GO:0032564 | dATP binding(GO:0032564) |
| 0.7 | 8.9 | GO:0030881 | beta-2-microglobulin binding(GO:0030881) |
| 0.7 | 2.0 | GO:0071936 | coreceptor activity involved in Wnt signaling pathway(GO:0071936) |
| 0.7 | 3.3 | GO:0004499 | N,N-dimethylaniline monooxygenase activity(GO:0004499) |
| 0.6 | 3.2 | GO:0005324 | long-chain fatty acid transporter activity(GO:0005324) |
| 0.6 | 1.9 | GO:0008534 | oxidized purine nucleobase lesion DNA N-glycosylase activity(GO:0008534) |
| 0.6 | 24.9 | GO:0070412 | R-SMAD binding(GO:0070412) |
| 0.6 | 2.5 | GO:0008410 | CoA-transferase activity(GO:0008410) |
| 0.6 | 4.4 | GO:0015091 | ferric iron transmembrane transporter activity(GO:0015091) trivalent inorganic cation transmembrane transporter activity(GO:0072510) |
| 0.6 | 3.0 | GO:0042285 | UDP-xylosyltransferase activity(GO:0035252) xylosyltransferase activity(GO:0042285) |
| 0.6 | 5.2 | GO:0004416 | hydroxyacylglutathione hydrolase activity(GO:0004416) |
| 0.6 | 2.3 | GO:0043546 | molybdenum ion binding(GO:0030151) molybdopterin cofactor binding(GO:0043546) |
| 0.6 | 4.0 | GO:0008440 | inositol-1,4,5-trisphosphate 3-kinase activity(GO:0008440) |
| 0.6 | 6.1 | GO:0004143 | diacylglycerol kinase activity(GO:0004143) |
| 0.6 | 5.0 | GO:0031730 | CCR5 chemokine receptor binding(GO:0031730) |
| 0.5 | 2.2 | GO:0032422 | purine-rich negative regulatory element binding(GO:0032422) |
| 0.5 | 1.6 | GO:0031826 | type 2A serotonin receptor binding(GO:0031826) |
| 0.5 | 9.2 | GO:0005035 | tumor necrosis factor-activated receptor activity(GO:0005031) death receptor activity(GO:0005035) |
| 0.5 | 4.2 | GO:0055131 | C3HC4-type RING finger domain binding(GO:0055131) |
| 0.5 | 1.6 | GO:0017084 | glutamate 5-kinase activity(GO:0004349) glutamate-5-semialdehyde dehydrogenase activity(GO:0004350) delta1-pyrroline-5-carboxylate synthetase activity(GO:0017084) amino acid kinase activity(GO:0019202) |
| 0.5 | 3.6 | GO:0015288 | porin activity(GO:0015288) |
| 0.5 | 5.7 | GO:0032036 | myosin heavy chain binding(GO:0032036) |
| 0.5 | 8.1 | GO:0016290 | palmitoyl-CoA hydrolase activity(GO:0016290) |
| 0.5 | 1.5 | GO:0019966 | C-X-C chemokine binding(GO:0019958) interleukin-1 binding(GO:0019966) tumor necrosis factor binding(GO:0043120) |
| 0.5 | 3.0 | GO:0035184 | histone threonine kinase activity(GO:0035184) |
| 0.5 | 3.5 | GO:0004726 | non-membrane spanning protein tyrosine phosphatase activity(GO:0004726) |
| 0.5 | 2.5 | GO:0004839 | ubiquitin activating enzyme activity(GO:0004839) |
| 0.5 | 1.4 | GO:0008177 | succinate dehydrogenase (ubiquinone) activity(GO:0008177) 3 iron, 4 sulfur cluster binding(GO:0051538) |
| 0.5 | 3.8 | GO:0035033 | histone deacetylase regulator activity(GO:0035033) |
| 0.5 | 3.8 | GO:0048495 | Roundabout binding(GO:0048495) |
| 0.5 | 6.1 | GO:0050897 | cobalt ion binding(GO:0050897) |
| 0.5 | 3.2 | GO:0005021 | vascular endothelial growth factor-activated receptor activity(GO:0005021) |
| 0.5 | 1.8 | GO:0086038 | calcium:sodium antiporter activity involved in regulation of cardiac muscle cell membrane potential(GO:0086038) |
| 0.5 | 2.3 | GO:0019870 | potassium channel inhibitor activity(GO:0019870) |
| 0.5 | 2.7 | GO:0016846 | carbon-sulfur lyase activity(GO:0016846) |
| 0.5 | 1.8 | GO:0048408 | epidermal growth factor binding(GO:0048408) |
| 0.4 | 4.9 | GO:0045236 | CXCR chemokine receptor binding(GO:0045236) |
| 0.4 | 4.4 | GO:0017162 | aryl hydrocarbon receptor binding(GO:0017162) |
| 0.4 | 10.0 | GO:1900750 | glutathione binding(GO:0043295) oligopeptide binding(GO:1900750) |
| 0.4 | 9.2 | GO:0070182 | DNA polymerase binding(GO:0070182) |
| 0.4 | 2.5 | GO:0009374 | biotin binding(GO:0009374) |
| 0.4 | 8.3 | GO:0005528 | macrolide binding(GO:0005527) FK506 binding(GO:0005528) |
| 0.4 | 5.4 | GO:0005522 | profilin binding(GO:0005522) |
| 0.4 | 0.8 | GO:0003917 | DNA topoisomerase type I activity(GO:0003917) |
| 0.4 | 2.4 | GO:0060698 | endoribonuclease inhibitor activity(GO:0060698) |
| 0.4 | 1.6 | GO:0004706 | JUN kinase kinase kinase activity(GO:0004706) |
| 0.4 | 3.6 | GO:0005007 | fibroblast growth factor-activated receptor activity(GO:0005007) |
| 0.4 | 3.2 | GO:0016634 | oxidoreductase activity, acting on the CH-CH group of donors, oxygen as acceptor(GO:0016634) |
| 0.4 | 3.6 | GO:0008499 | UDP-galactose:beta-N-acetylglucosamine beta-1,3-galactosyltransferase activity(GO:0008499) |
| 0.4 | 2.4 | GO:0070728 | leucine binding(GO:0070728) |
| 0.4 | 3.0 | GO:0005540 | hyaluronic acid binding(GO:0005540) |
| 0.4 | 1.5 | GO:2001069 | glycogen binding(GO:2001069) |
| 0.4 | 11.1 | GO:0005201 | extracellular matrix structural constituent(GO:0005201) |
| 0.4 | 5.2 | GO:0008484 | sulfuric ester hydrolase activity(GO:0008484) |
| 0.4 | 4.1 | GO:0008430 | selenium binding(GO:0008430) |
| 0.4 | 2.6 | GO:0015929 | hexosaminidase activity(GO:0015929) |
| 0.4 | 1.5 | GO:0051425 | PTB domain binding(GO:0051425) |
| 0.4 | 2.5 | GO:0001515 | opioid peptide activity(GO:0001515) |
| 0.4 | 11.5 | GO:0001223 | transcription coactivator binding(GO:0001223) |
| 0.4 | 3.9 | GO:0015279 | store-operated calcium channel activity(GO:0015279) |
| 0.4 | 1.1 | GO:0008527 | taste receptor activity(GO:0008527) |
| 0.3 | 1.7 | GO:0071532 | ankyrin repeat binding(GO:0071532) |
| 0.3 | 2.4 | GO:0015925 | galactosidase activity(GO:0015925) |
| 0.3 | 1.0 | GO:0019002 | GMP binding(GO:0019002) |
| 0.3 | 2.1 | GO:0050786 | RAGE receptor binding(GO:0050786) |
| 0.3 | 1.4 | GO:0070573 | tripeptidyl-peptidase activity(GO:0008240) metallodipeptidase activity(GO:0070573) |
| 0.3 | 11.3 | GO:0042805 | actinin binding(GO:0042805) |
| 0.3 | 1.7 | GO:0086056 | voltage-gated calcium channel activity involved in AV node cell action potential(GO:0086056) |
| 0.3 | 33.8 | GO:0005178 | integrin binding(GO:0005178) |
| 0.3 | 3.7 | GO:0044548 | S100 protein binding(GO:0044548) |
| 0.3 | 1.3 | GO:0005459 | UDP-galactose transmembrane transporter activity(GO:0005459) |
| 0.3 | 1.3 | GO:0033883 | pyridoxal phosphatase activity(GO:0033883) |
| 0.3 | 11.3 | GO:0004714 | transmembrane receptor protein tyrosine kinase activity(GO:0004714) |
| 0.3 | 1.2 | GO:0008948 | oxaloacetate decarboxylase activity(GO:0008948) |
| 0.3 | 8.6 | GO:0008376 | acetylgalactosaminyltransferase activity(GO:0008376) |
| 0.3 | 3.4 | GO:0030957 | Tat protein binding(GO:0030957) |
| 0.3 | 1.8 | GO:0001162 | RNA polymerase II intronic transcription regulatory region sequence-specific DNA binding(GO:0001162) |
| 0.3 | 4.2 | GO:0004861 | cyclin-dependent protein serine/threonine kinase inhibitor activity(GO:0004861) |
| 0.3 | 2.4 | GO:0008889 | glycerophosphodiester phosphodiesterase activity(GO:0008889) |
| 0.3 | 1.2 | GO:0015220 | choline transmembrane transporter activity(GO:0015220) |
| 0.3 | 0.9 | GO:0034211 | GTP-dependent protein kinase activity(GO:0034211) |
| 0.3 | 3.6 | GO:0001013 | RNA polymerase I regulatory region DNA binding(GO:0001013) |
| 0.3 | 17.6 | GO:0019003 | GDP binding(GO:0019003) |
| 0.3 | 0.8 | GO:0098821 | BMP receptor activity(GO:0098821) |
| 0.3 | 0.8 | GO:0046899 | nucleoside triphosphate adenylate kinase activity(GO:0046899) |
| 0.3 | 0.8 | GO:0031896 | alpha-1A adrenergic receptor binding(GO:0031691) alpha-1B adrenergic receptor binding(GO:0031692) follicle-stimulating hormone receptor binding(GO:0031762) V2 vasopressin receptor binding(GO:0031896) |
| 0.3 | 7.5 | GO:0005504 | fatty acid binding(GO:0005504) |
| 0.3 | 7.8 | GO:0019789 | SUMO transferase activity(GO:0019789) |
| 0.3 | 0.8 | GO:0004829 | threonine-tRNA ligase activity(GO:0004829) |
| 0.3 | 12.1 | GO:0019838 | growth factor binding(GO:0019838) |
| 0.3 | 2.8 | GO:0003689 | DNA clamp loader activity(GO:0003689) protein-DNA loading ATPase activity(GO:0033170) |
| 0.3 | 1.8 | GO:0061578 | Lys63-specific deubiquitinase activity(GO:0061578) |
| 0.3 | 6.5 | GO:0080025 | phosphatidylinositol-3,5-bisphosphate binding(GO:0080025) |
| 0.3 | 6.5 | GO:0005112 | Notch binding(GO:0005112) |
| 0.2 | 11.7 | GO:0005518 | collagen binding(GO:0005518) |
| 0.2 | 6.0 | GO:0050998 | nitric-oxide synthase binding(GO:0050998) |
| 0.2 | 1.4 | GO:0004886 | 9-cis retinoic acid receptor activity(GO:0004886) |
| 0.2 | 0.7 | GO:0050816 | phosphothreonine binding(GO:0050816) |
| 0.2 | 2.3 | GO:0043262 | adenosine-diphosphatase activity(GO:0043262) |
| 0.2 | 1.4 | GO:0004852 | uroporphyrinogen-III synthase activity(GO:0004852) |
| 0.2 | 1.8 | GO:0003958 | NADPH-hemoprotein reductase activity(GO:0003958) |
| 0.2 | 0.9 | GO:0046920 | alpha-(1->3)-fucosyltransferase activity(GO:0046920) |
| 0.2 | 1.3 | GO:0051525 | NFAT protein binding(GO:0051525) |
| 0.2 | 0.9 | GO:0072345 | NAADP-sensitive calcium-release channel activity(GO:0072345) |
| 0.2 | 3.6 | GO:0016857 | racemase and epimerase activity, acting on carbohydrates and derivatives(GO:0016857) |
| 0.2 | 1.5 | GO:0004689 | phosphorylase kinase activity(GO:0004689) |
| 0.2 | 0.6 | GO:0004104 | cholinesterase activity(GO:0004104) choline binding(GO:0033265) |
| 0.2 | 0.8 | GO:0035243 | protein-arginine omega-N symmetric methyltransferase activity(GO:0035243) |
| 0.2 | 0.8 | GO:0034739 | histone deacetylase activity (H4-K16 specific)(GO:0034739) |
| 0.2 | 1.2 | GO:0034186 | apolipoprotein A-I binding(GO:0034186) |
| 0.2 | 1.0 | GO:0016813 | hydrolase activity, acting on carbon-nitrogen (but not peptide) bonds, in linear amidines(GO:0016813) |
| 0.2 | 4.1 | GO:0005104 | fibroblast growth factor receptor binding(GO:0005104) |
| 0.2 | 2.7 | GO:0016709 | oxidoreductase activity, acting on paired donors, with incorporation or reduction of molecular oxygen, NAD(P)H as one donor, and incorporation of one atom of oxygen(GO:0016709) |
| 0.2 | 1.0 | GO:0001224 | RNA polymerase II transcription cofactor binding(GO:0001224) RNA polymerase II transcription corepressor binding(GO:0001226) |
| 0.2 | 0.6 | GO:0016716 | oxidoreductase activity, acting on paired donors, with incorporation or reduction of molecular oxygen, another compound as one donor, and incorporation of one atom of oxygen(GO:0016716) |
| 0.2 | 2.3 | GO:0016500 | protein-hormone receptor activity(GO:0016500) |
| 0.2 | 1.9 | GO:0051575 | 5'-deoxyribose-5-phosphate lyase activity(GO:0051575) |
| 0.2 | 0.7 | GO:0003827 | alpha-1,3-mannosylglycoprotein 2-beta-N-acetylglucosaminyltransferase activity(GO:0003827) |
| 0.2 | 0.7 | GO:0015143 | urate transmembrane transporter activity(GO:0015143) salt transmembrane transporter activity(GO:1901702) |
| 0.2 | 3.4 | GO:0004198 | calcium-dependent cysteine-type endopeptidase activity(GO:0004198) |
| 0.2 | 0.9 | GO:1990948 | ligase inhibitor activity(GO:0055104) ubiquitin ligase inhibitor activity(GO:1990948) |
| 0.2 | 0.2 | GO:0005128 | erythropoietin receptor binding(GO:0005128) |
| 0.2 | 5.4 | GO:0048306 | calcium-dependent protein binding(GO:0048306) |
| 0.2 | 0.5 | GO:0015140 | malate transmembrane transporter activity(GO:0015140) |
| 0.2 | 1.9 | GO:0031957 | very long-chain fatty acid-CoA ligase activity(GO:0031957) |
| 0.2 | 4.5 | GO:0070064 | proline-rich region binding(GO:0070064) |
| 0.2 | 3.0 | GO:0050811 | GABA receptor binding(GO:0050811) |
| 0.2 | 1.5 | GO:0004745 | retinol dehydrogenase activity(GO:0004745) |
| 0.2 | 1.6 | GO:0004691 | cAMP-dependent protein kinase activity(GO:0004691) |
| 0.2 | 1.1 | GO:0030274 | LIM domain binding(GO:0030274) |
| 0.2 | 1.0 | GO:0005042 | netrin receptor activity(GO:0005042) |
| 0.2 | 0.6 | GO:0031727 | CCR2 chemokine receptor binding(GO:0031727) |
| 0.2 | 3.0 | GO:0017160 | Ral GTPase binding(GO:0017160) |
| 0.2 | 3.0 | GO:0042287 | MHC protein binding(GO:0042287) |
| 0.2 | 1.5 | GO:0016406 | carnitine O-acyltransferase activity(GO:0016406) |
| 0.1 | 4.0 | GO:0005385 | zinc ion transmembrane transporter activity(GO:0005385) |
| 0.1 | 2.7 | GO:0008510 | sodium:bicarbonate symporter activity(GO:0008510) |
| 0.1 | 0.4 | GO:0008384 | IkappaB kinase activity(GO:0008384) |
| 0.1 | 0.4 | GO:0016314 | phosphatidylinositol-3,4,5-trisphosphate 3-phosphatase activity(GO:0016314) |
| 0.1 | 0.7 | GO:0004367 | glycerol-3-phosphate dehydrogenase [NAD+] activity(GO:0004367) |
| 0.1 | 1.8 | GO:0043395 | heparan sulfate proteoglycan binding(GO:0043395) |
| 0.1 | 9.6 | GO:0005080 | protein kinase C binding(GO:0005080) |
| 0.1 | 1.0 | GO:0003708 | retinoic acid receptor activity(GO:0003708) |
| 0.1 | 0.3 | GO:0016174 | NAD(P)H oxidase activity(GO:0016174) |
| 0.1 | 0.4 | GO:0004605 | phosphatidate cytidylyltransferase activity(GO:0004605) |
| 0.1 | 0.8 | GO:0070290 | N-acylphosphatidylethanolamine-specific phospholipase D activity(GO:0070290) |
| 0.1 | 1.0 | GO:0098505 | G-rich strand telomeric DNA binding(GO:0098505) |
| 0.1 | 8.5 | GO:0008201 | heparin binding(GO:0008201) |
| 0.1 | 0.4 | GO:0004466 | long-chain-acyl-CoA dehydrogenase activity(GO:0004466) very-long-chain-acyl-CoA dehydrogenase activity(GO:0017099) |
| 0.1 | 0.9 | GO:0008097 | 5S rRNA binding(GO:0008097) |
| 0.1 | 1.4 | GO:0042605 | peptide antigen binding(GO:0042605) |
| 0.1 | 1.5 | GO:0032794 | GTPase activating protein binding(GO:0032794) |
| 0.1 | 1.5 | GO:0046933 | proton-transporting ATP synthase activity, rotational mechanism(GO:0046933) |
| 0.1 | 0.6 | GO:0000213 | tRNA-intron endonuclease activity(GO:0000213) endoribonuclease activity, producing 3'-phosphomonoesters(GO:0016892) |
| 0.1 | 2.3 | GO:0030971 | receptor tyrosine kinase binding(GO:0030971) |
| 0.1 | 5.4 | GO:0005179 | hormone activity(GO:0005179) |
| 0.1 | 1.4 | GO:0005537 | mannose binding(GO:0005537) |
| 0.1 | 0.5 | GO:0070568 | guanylyltransferase activity(GO:0070568) |
| 0.1 | 0.5 | GO:0015142 | citrate transmembrane transporter activity(GO:0015137) tricarboxylic acid transmembrane transporter activity(GO:0015142) |
| 0.1 | 0.4 | GO:0050833 | pyruvate transmembrane transporter activity(GO:0050833) |
| 0.1 | 1.1 | GO:0015149 | glucose transmembrane transporter activity(GO:0005355) hexose transmembrane transporter activity(GO:0015149) |
| 0.1 | 4.6 | GO:0004712 | protein serine/threonine/tyrosine kinase activity(GO:0004712) |
| 0.1 | 0.9 | GO:0030346 | protein phosphatase 2B binding(GO:0030346) |
| 0.1 | 1.2 | GO:0016864 | protein disulfide isomerase activity(GO:0003756) intramolecular oxidoreductase activity, transposing S-S bonds(GO:0016864) |
| 0.1 | 2.7 | GO:0030676 | Rac guanyl-nucleotide exchange factor activity(GO:0030676) |
| 0.1 | 7.2 | GO:0042626 | ATPase activity, coupled to transmembrane movement of substances(GO:0042626) |
| 0.1 | 0.2 | GO:0004828 | serine-tRNA ligase activity(GO:0004828) |
| 0.1 | 3.2 | GO:0017022 | myosin binding(GO:0017022) |
| 0.1 | 3.2 | GO:0004693 | cyclin-dependent protein serine/threonine kinase activity(GO:0004693) |
| 0.1 | 1.8 | GO:0005164 | tumor necrosis factor receptor binding(GO:0005164) |
| 0.1 | 1.8 | GO:0017147 | Wnt-protein binding(GO:0017147) |
| 0.1 | 0.5 | GO:0035925 | mRNA 3'-UTR AU-rich region binding(GO:0035925) |
| 0.1 | 1.5 | GO:0051787 | misfolded protein binding(GO:0051787) |
| 0.1 | 1.9 | GO:0050699 | WW domain binding(GO:0050699) |
| 0.1 | 0.5 | GO:0015386 | potassium:proton antiporter activity(GO:0015386) |
| 0.1 | 0.4 | GO:0070403 | NAD+ binding(GO:0070403) |
| 0.1 | 0.3 | GO:0019788 | NEDD8 transferase activity(GO:0019788) |
| 0.1 | 0.7 | GO:0016861 | intramolecular oxidoreductase activity, interconverting aldoses and ketoses(GO:0016861) |
| 0.1 | 2.8 | GO:0070888 | E-box binding(GO:0070888) |
| 0.1 | 1.6 | GO:0030371 | translation repressor activity(GO:0030371) |
| 0.1 | 0.1 | GO:0019960 | C-X3-C chemokine binding(GO:0019960) |
| 0.1 | 1.7 | GO:0004407 | histone deacetylase activity(GO:0004407) |
| 0.1 | 0.3 | GO:0008467 | [heparan sulfate]-glucosamine 3-sulfotransferase 1 activity(GO:0008467) |
| 0.1 | 8.1 | GO:0003735 | structural constituent of ribosome(GO:0003735) |
| 0.1 | 1.0 | GO:0000030 | mannosyltransferase activity(GO:0000030) |
| 0.0 | 1.2 | GO:0016881 | acid-amino acid ligase activity(GO:0016881) |
| 0.0 | 1.0 | GO:0004129 | cytochrome-c oxidase activity(GO:0004129) heme-copper terminal oxidase activity(GO:0015002) oxidoreductase activity, acting on a heme group of donors(GO:0016675) oxidoreductase activity, acting on a heme group of donors, oxygen as acceptor(GO:0016676) |
| 0.0 | 0.7 | GO:0004536 | deoxyribonuclease activity(GO:0004536) |
| 0.0 | 1.7 | GO:0005484 | SNAP receptor activity(GO:0005484) |
| 0.0 | 0.9 | GO:0070530 | K63-linked polyubiquitin binding(GO:0070530) |
| 0.0 | 0.3 | GO:0061133 | endopeptidase activator activity(GO:0061133) |
| 0.0 | 0.4 | GO:0071889 | 14-3-3 protein binding(GO:0071889) |
| 0.0 | 1.0 | GO:0001085 | RNA polymerase II transcription factor binding(GO:0001085) |
| 0.0 | 2.1 | GO:0000149 | SNARE binding(GO:0000149) |
| 0.0 | 0.7 | GO:0042974 | retinoic acid receptor binding(GO:0042974) |
| 0.0 | 0.8 | GO:0008373 | sialyltransferase activity(GO:0008373) |
| 0.0 | 0.7 | GO:0004709 | MAP kinase kinase kinase activity(GO:0004709) |
| 0.0 | 0.7 | GO:0032454 | histone demethylase activity (H3-K9 specific)(GO:0032454) histone demethylase activity (H3-K36 specific)(GO:0051864) |
| 0.0 | 0.5 | GO:1990841 | promoter-specific chromatin binding(GO:1990841) |
| 0.0 | 0.9 | GO:0003887 | DNA-directed DNA polymerase activity(GO:0003887) |
| 0.0 | 0.9 | GO:0005507 | copper ion binding(GO:0005507) |
| 0.0 | 0.5 | GO:0035591 | signaling adaptor activity(GO:0035591) |
| 0.0 | 0.6 | GO:0030506 | ankyrin binding(GO:0030506) |
| 0.0 | 1.8 | GO:0004722 | protein serine/threonine phosphatase activity(GO:0004722) |
| 0.0 | 0.8 | GO:0008157 | protein phosphatase 1 binding(GO:0008157) |
| 0.0 | 0.8 | GO:0004180 | carboxypeptidase activity(GO:0004180) |
| 0.0 | 0.1 | GO:0004445 | inositol-polyphosphate 5-phosphatase activity(GO:0004445) inositol trisphosphate phosphatase activity(GO:0046030) |
| 0.0 | 0.7 | GO:0008028 | monocarboxylic acid transmembrane transporter activity(GO:0008028) |
| 0.0 | 0.9 | GO:0016209 | antioxidant activity(GO:0016209) |
| 0.0 | 0.2 | GO:0009922 | fatty acid elongase activity(GO:0009922) 3-oxo-arachidoyl-CoA synthase activity(GO:0102336) 3-oxo-cerotoyl-CoA synthase activity(GO:0102337) 3-oxo-lignoceronyl-CoA synthase activity(GO:0102338) |
| 0.0 | 0.7 | GO:0020037 | heme binding(GO:0020037) |
| 0.0 | 1.4 | GO:0002020 | protease binding(GO:0002020) |
| 0.0 | 0.2 | GO:0043325 | phosphatidylinositol-3,4-bisphosphate binding(GO:0043325) |
| 0.0 | 0.3 | GO:0045505 | dynein intermediate chain binding(GO:0045505) |
| 0.0 | 0.2 | GO:0004435 | phosphatidylinositol phospholipase C activity(GO:0004435) |
| 0.0 | 0.7 | GO:0017124 | SH3 domain binding(GO:0017124) |
| 0.0 | 0.2 | GO:0008266 | poly(U) RNA binding(GO:0008266) |
| 0.0 | 1.4 | GO:0004519 | endonuclease activity(GO:0004519) |
| 0.0 | 0.3 | GO:0042826 | histone deacetylase binding(GO:0042826) |
| 0.0 | 0.4 | GO:0005070 | SH3/SH2 adaptor activity(GO:0005070) |
| 0.0 | 1.2 | GO:0003774 | motor activity(GO:0003774) |
Gene overrepresentation in C2:CP category:
| Log-likelihood per target | Total log-likelihood | Term | Description |
|---|---|---|---|
| 1.6 | 3.2 | PID_VEGF_VEGFR_PATHWAY | VEGF and VEGFR signaling network |
| 1.2 | 21.1 | PID_TCR_RAS_PATHWAY | Ras signaling in the CD4+ TCR pathway |
| 1.1 | 19.7 | PID_INTEGRIN5_PATHWAY | Beta5 beta6 beta7 and beta8 integrin cell surface interactions |
| 0.9 | 17.0 | ST_STAT3_PATHWAY | STAT3 Pathway |
| 0.9 | 6.3 | PID_ATF2_PATHWAY | ATF-2 transcription factor network |
| 0.8 | 39.8 | PID_HNF3B_PATHWAY | FOXA2 and FOXA3 transcription factor networks |
| 0.7 | 15.6 | PID_INTEGRIN_A9B1_PATHWAY | Alpha9 beta1 integrin signaling events |
| 0.6 | 9.2 | NABA_BASEMENT_MEMBRANES | Genes encoding structural components of basement membranes |
| 0.6 | 29.6 | SIG_PIP3_SIGNALING_IN_B_LYMPHOCYTES | Genes related to PIP3 signaling in B lymphocytes |
| 0.6 | 78.4 | NABA_ECM_GLYCOPROTEINS | Genes encoding structural ECM glycoproteins |
| 0.5 | 13.0 | PID_SHP2_PATHWAY | SHP2 signaling |
| 0.5 | 14.8 | PID_VEGFR1_PATHWAY | VEGFR1 specific signals |
| 0.4 | 3.1 | ST_PAC1_RECEPTOR_PATHWAY | PAC1 Receptor Pathway |
| 0.4 | 13.0 | NABA_COLLAGENS | Genes encoding collagen proteins |
| 0.4 | 6.0 | SA_G1_AND_S_PHASES | Cdk2, 4, and 6 bind cyclin D in G1, while cdk2/cyclin E promotes the G1/S transition. |
| 0.4 | 7.5 | PID_P38_GAMMA_DELTA_PATHWAY | Signaling mediated by p38-gamma and p38-delta |
| 0.3 | 3.8 | PID_ALPHA_SYNUCLEIN_PATHWAY | Alpha-synuclein signaling |
| 0.3 | 24.6 | PID_HIF1_TFPATHWAY | HIF-1-alpha transcription factor network |
| 0.3 | 6.7 | PID_S1P_META_PATHWAY | Sphingosine 1-phosphate (S1P) pathway |
| 0.3 | 14.8 | PID_CD8_TCR_PATHWAY | TCR signaling in naïve CD8+ T cells |
| 0.3 | 5.8 | PID_HIF2PATHWAY | HIF-2-alpha transcription factor network |
| 0.3 | 9.5 | NABA_PROTEOGLYCANS | Genes encoding proteoglycans |
| 0.3 | 4.2 | PID_IL2_1PATHWAY | IL2-mediated signaling events |
| 0.3 | 1.9 | PID_PDGFRA_PATHWAY | PDGFR-alpha signaling pathway |
| 0.3 | 1.4 | SA_MMP_CYTOKINE_CONNECTION | Cytokines can induce activation of matrix metalloproteinases, which degrade extracellular matrix. |
| 0.3 | 35.5 | NABA_ECM_REGULATORS | Genes encoding enzymes and their regulators involved in the remodeling of the extracellular matrix |
| 0.2 | 2.7 | PID_GLYPICAN_1PATHWAY | Glypican 1 network |
| 0.2 | 1.3 | PID_S1P_S1P2_PATHWAY | S1P2 pathway |
| 0.2 | 4.3 | PID_EPHA_FWDPATHWAY | EPHA forward signaling |
| 0.2 | 5.7 | PID_NETRIN_PATHWAY | Netrin-mediated signaling events |
| 0.2 | 38.5 | NABA_SECRETED_FACTORS | Genes encoding secreted soluble factors |
| 0.2 | 7.6 | PID_MET_PATHWAY | Signaling events mediated by Hepatocyte Growth Factor Receptor (c-Met) |
| 0.2 | 1.4 | SA_G2_AND_M_PHASES | Cdc25 activates the cdc2/cyclin B complex to induce the G2/M transition. |
| 0.2 | 3.9 | PID_HDAC_CLASSIII_PATHWAY | Signaling events mediated by HDAC Class III |
| 0.2 | 6.7 | PID_DELTA_NP63_PATHWAY | Validated transcriptional targets of deltaNp63 isoforms |
| 0.2 | 4.9 | ST_TUMOR_NECROSIS_FACTOR_PATHWAY | Tumor Necrosis Factor Pathway. |
| 0.2 | 5.1 | PID_FAK_PATHWAY | Signaling events mediated by focal adhesion kinase |
| 0.2 | 4.3 | PID_FGF_PATHWAY | FGF signaling pathway |
| 0.1 | 6.9 | PID_CASPASE_PATHWAY | Caspase cascade in apoptosis |
| 0.1 | 8.7 | PID_CDC42_PATHWAY | CDC42 signaling events |
| 0.1 | 5.4 | PID_INSULIN_PATHWAY | Insulin Pathway |
| 0.1 | 1.5 | ST_ADRENERGIC | Adrenergic Pathway |
| 0.1 | 8.2 | PID_NOTCH_PATHWAY | Notch signaling pathway |
| 0.1 | 5.4 | ST_FAS_SIGNALING_PATHWAY | Fas Signaling Pathway |
| 0.1 | 3.4 | PID_TCR_CALCIUM_PATHWAY | Calcium signaling in the CD4+ TCR pathway |
| 0.1 | 0.7 | ST_INTEGRIN_SIGNALING_PATHWAY | Integrin Signaling Pathway |
| 0.1 | 2.4 | PID_RXR_VDR_PATHWAY | RXR and RAR heterodimerization with other nuclear receptor |
| 0.1 | 1.9 | PID_DNA_PK_PATHWAY | DNA-PK pathway in nonhomologous end joining |
| 0.1 | 1.3 | PID_CIRCADIAN_PATHWAY | Circadian rhythm pathway |
| 0.1 | 0.9 | PID_VEGFR1_2_PATHWAY | Signaling events mediated by VEGFR1 and VEGFR2 |
| 0.1 | 3.8 | PID_P73PATHWAY | p73 transcription factor network |
| 0.1 | 2.2 | PID_AP1_PATHWAY | AP-1 transcription factor network |
| 0.1 | 1.4 | PID_ARF6_PATHWAY | Arf6 signaling events |
| 0.1 | 0.6 | ST_DIFFERENTIATION_PATHWAY_IN_PC12_CELLS | Differentiation Pathway in PC12 Cells; this is a specific case of PAC1 Receptor Pathway. |
| 0.1 | 0.3 | PID_HIF1A_PATHWAY | Hypoxic and oxygen homeostasis regulation of HIF-1-alpha |
| 0.1 | 0.4 | PID_PTP1B_PATHWAY | Signaling events mediated by PTP1B |
| 0.0 | 1.1 | PID_ARF_3PATHWAY | Arf1 pathway |
| 0.0 | 0.3 | PID_CERAMIDE_PATHWAY | Ceramide signaling pathway |
| 0.0 | 1.0 | PID_ARF6_TRAFFICKING_PATHWAY | Arf6 trafficking events |
| 0.0 | 0.6 | PID_TAP63_PATHWAY | Validated transcriptional targets of TAp63 isoforms |
| 0.0 | 0.9 | PID_TGFBR_PATHWAY | TGF-beta receptor signaling |
| 0.0 | 0.3 | PID_HES_HEY_PATHWAY | Notch-mediated HES/HEY network |
| 0.0 | 0.7 | PID_MYC_REPRESS_PATHWAY | Validated targets of C-MYC transcriptional repression |
| 0.0 | 0.4 | PID_HEDGEHOG_2PATHWAY | Signaling events mediated by the Hedgehog family |
| 0.0 | 0.3 | PID_REELIN_PATHWAY | Reelin signaling pathway |
| 0.0 | 0.3 | PID_KIT_PATHWAY | Signaling events mediated by Stem cell factor receptor (c-Kit) |
| 0.0 | 0.8 | PID_AR_PATHWAY | Coregulation of Androgen receptor activity |
| 0.0 | 0.4 | PID_MTOR_4PATHWAY | mTOR signaling pathway |
| 0.0 | 0.6 | PID_HDAC_CLASSI_PATHWAY | Signaling events mediated by HDAC Class I |
Gene overrepresentation in C2:CP:REACTOME category:
| Log-likelihood per target | Total log-likelihood | Term | Description |
|---|---|---|---|
| 2.3 | 2.3 | REACTOME_SIGNALING_BY_NOTCH2 | Genes involved in Signaling by NOTCH2 |
| 2.1 | 16.7 | REACTOME_TRANSPORT_OF_ORGANIC_ANIONS | Genes involved in Transport of organic anions |
| 2.0 | 6.1 | REACTOME_ENDOSOMAL_VACUOLAR_PATHWAY | Genes involved in Endosomal/Vacuolar pathway |
| 1.2 | 8.7 | REACTOME_SIGNALING_BY_NOTCH4 | Genes involved in Signaling by NOTCH4 |
| 1.2 | 47.9 | REACTOME_NUCLEAR_SIGNALING_BY_ERBB4 | Genes involved in Nuclear signaling by ERBB4 |
| 0.9 | 17.0 | REACTOME_ACTIVATION_OF_THE_AP1_FAMILY_OF_TRANSCRIPTION_FACTORS | Genes involved in Activation of the AP-1 family of transcription factors |
| 0.8 | 1.6 | REACTOME_PLATELET_AGGREGATION_PLUG_FORMATION | Genes involved in Platelet Aggregation (Plug Formation) |
| 0.8 | 8.0 | REACTOME_INTRINSIC_PATHWAY | Genes involved in Intrinsic Pathway |
| 0.8 | 20.5 | REACTOME_REGULATION_OF_GENE_EXPRESSION_IN_BETA_CELLS | Genes involved in Regulation of gene expression in beta cells |
| 0.7 | 11.7 | REACTOME_AKT_PHOSPHORYLATES_TARGETS_IN_THE_CYTOSOL | Genes involved in AKT phosphorylates targets in the cytosol |
| 0.7 | 39.0 | REACTOME_AMYLOIDS | Genes involved in Amyloids |
| 0.7 | 14.0 | REACTOME_IMMUNOREGULATORY_INTERACTIONS_BETWEEN_A_LYMPHOID_AND_A_NON_LYMPHOID_CELL | Genes involved in Immunoregulatory interactions between a Lymphoid and a non-Lymphoid cell |
| 0.7 | 5.2 | REACTOME_GAMMA_CARBOXYLATION_TRANSPORT_AND_AMINO_TERMINAL_CLEAVAGE_OF_PROTEINS | Genes involved in Gamma-carboxylation, transport, and amino-terminal cleavage of proteins |
| 0.7 | 3.9 | REACTOME_ELEVATION_OF_CYTOSOLIC_CA2_LEVELS | Genes involved in Elevation of cytosolic Ca2+ levels |
| 0.6 | 5.2 | REACTOME_THE_ACTIVATION_OF_ARYLSULFATASES | Genes involved in The activation of arylsulfatases |
| 0.6 | 3.2 | REACTOME_SIGNALING_BY_EGFR_IN_CANCER | Genes involved in Signaling by EGFR in Cancer |
| 0.6 | 9.2 | REACTOME_APOPTOSIS_INDUCED_DNA_FRAGMENTATION | Genes involved in Apoptosis induced DNA fragmentation |
| 0.5 | 9.9 | REACTOME_GROWTH_HORMONE_RECEPTOR_SIGNALING | Genes involved in Growth hormone receptor signaling |
| 0.5 | 14.4 | REACTOME_ENOS_ACTIVATION_AND_REGULATION | Genes involved in eNOS activation and regulation |
| 0.5 | 6.2 | REACTOME_CS_DS_DEGRADATION | Genes involved in CS/DS degradation |
| 0.5 | 7.4 | REACTOME_SEMA3A_PLEXIN_REPULSION_SIGNALING_BY_INHIBITING_INTEGRIN_ADHESION | Genes involved in SEMA3A-Plexin repulsion signaling by inhibiting Integrin adhesion |
| 0.5 | 9.6 | REACTOME_GLUTATHIONE_CONJUGATION | Genes involved in Glutathione conjugation |
| 0.4 | 4.2 | REACTOME_MRNA_DECAY_BY_3_TO_5_EXORIBONUCLEASE | Genes involved in mRNA Decay by 3' to 5' Exoribonuclease |
| 0.4 | 10.0 | REACTOME_SULFUR_AMINO_ACID_METABOLISM | Genes involved in Sulfur amino acid metabolism |
| 0.4 | 3.9 | REACTOME_TERMINATION_OF_O_GLYCAN_BIOSYNTHESIS | Genes involved in Termination of O-glycan biosynthesis |
| 0.4 | 6.6 | REACTOME_CASPASE_MEDIATED_CLEAVAGE_OF_CYTOSKELETAL_PROTEINS | Genes involved in Caspase-mediated cleavage of cytoskeletal proteins |
| 0.4 | 10.9 | REACTOME_ABC_FAMILY_PROTEINS_MEDIATED_TRANSPORT | Genes involved in ABC-family proteins mediated transport |
| 0.4 | 19.3 | REACTOME_ACTIVATION_OF_CHAPERONE_GENES_BY_XBP1S | Genes involved in Activation of Chaperone Genes by XBP1(S) |
| 0.3 | 3.7 | REACTOME_FGFR2C_LIGAND_BINDING_AND_ACTIVATION | Genes involved in FGFR2c ligand binding and activation |
| 0.3 | 20.6 | REACTOME_COLLAGEN_FORMATION | Genes involved in Collagen formation |
| 0.3 | 1.9 | REACTOME_CREATION_OF_C4_AND_C2_ACTIVATORS | Genes involved in Creation of C4 and C2 activators |
| 0.3 | 3.2 | REACTOME_VEGF_LIGAND_RECEPTOR_INTERACTIONS | Genes involved in VEGF ligand-receptor interactions |
| 0.3 | 4.7 | REACTOME_MTORC1_MEDIATED_SIGNALLING | Genes involved in mTORC1-mediated signalling |
| 0.3 | 11.7 | REACTOME_GLUCONEOGENESIS | Genes involved in Gluconeogenesis |
| 0.3 | 5.8 | REACTOME_OXYGEN_DEPENDENT_PROLINE_HYDROXYLATION_OF_HYPOXIA_INDUCIBLE_FACTOR_ALPHA | Genes involved in Oxygen-dependent Proline Hydroxylation of Hypoxia-inducible Factor Alpha |
| 0.3 | 6.6 | REACTOME_A_TETRASACCHARIDE_LINKER_SEQUENCE_IS_REQUIRED_FOR_GAG_SYNTHESIS | Genes involved in A tetrasaccharide linker sequence is required for GAG synthesis |
| 0.3 | 0.8 | REACTOME_LYSOSOME_VESICLE_BIOGENESIS | Genes involved in Lysosome Vesicle Biogenesis |
| 0.3 | 1.8 | REACTOME_PLATELET_CALCIUM_HOMEOSTASIS | Genes involved in Platelet calcium homeostasis |
| 0.3 | 1.5 | REACTOME_ADVANCED_GLYCOSYLATION_ENDPRODUCT_RECEPTOR_SIGNALING | Genes involved in Advanced glycosylation endproduct receptor signaling |
| 0.2 | 2.9 | REACTOME_YAP1_AND_WWTR1_TAZ_STIMULATED_GENE_EXPRESSION | Genes involved in YAP1- and WWTR1 (TAZ)-stimulated gene expression |
| 0.2 | 3.6 | REACTOME_ACTIVATION_OF_GENES_BY_ATF4 | Genes involved in Activation of Genes by ATF4 |
| 0.2 | 2.2 | REACTOME_REMOVAL_OF_THE_FLAP_INTERMEDIATE_FROM_THE_C_STRAND | Genes involved in Removal of the Flap Intermediate from the C-strand |
| 0.2 | 1.7 | REACTOME_REGULATION_OF_INSULIN_SECRETION_BY_ACETYLCHOLINE | Genes involved in Regulation of Insulin Secretion by Acetylcholine |
| 0.2 | 5.3 | REACTOME_NEGATIVE_REGULATORS_OF_RIG_I_MDA5_SIGNALING | Genes involved in Negative regulators of RIG-I/MDA5 signaling |
| 0.2 | 1.9 | REACTOME_BASE_FREE_SUGAR_PHOSPHATE_REMOVAL_VIA_THE_SINGLE_NUCLEOTIDE_REPLACEMENT_PATHWAY | Genes involved in Base-free sugar-phosphate removal via the single-nucleotide replacement pathway |
| 0.2 | 11.1 | REACTOME_INTEGRIN_CELL_SURFACE_INTERACTIONS | Genes involved in Integrin cell surface interactions |
| 0.2 | 3.7 | REACTOME_TIE2_SIGNALING | Genes involved in Tie2 Signaling |
| 0.2 | 2.4 | REACTOME_VITAMIN_B5_PANTOTHENATE_METABOLISM | Genes involved in Vitamin B5 (pantothenate) metabolism |
| 0.2 | 2.5 | REACTOME_NOTCH_HLH_TRANSCRIPTION_PATHWAY | Genes involved in Notch-HLH transcription pathway |
| 0.2 | 10.8 | REACTOME_GOLGI_ASSOCIATED_VESICLE_BIOGENESIS | Genes involved in Golgi Associated Vesicle Biogenesis |
| 0.2 | 1.8 | REACTOME_FACILITATIVE_NA_INDEPENDENT_GLUCOSE_TRANSPORTERS | Genes involved in Facilitative Na+-independent glucose transporters |
| 0.1 | 1.6 | REACTOME_AMINE_DERIVED_HORMONES | Genes involved in Amine-derived hormones |
| 0.1 | 1.6 | REACTOME_PRE_NOTCH_TRANSCRIPTION_AND_TRANSLATION | Genes involved in Pre-NOTCH Transcription and Translation |
| 0.1 | 1.4 | REACTOME_G2_M_DNA_DAMAGE_CHECKPOINT | Genes involved in G2/M DNA damage checkpoint |
| 0.1 | 2.0 | REACTOME_SYNTHESIS_OF_PIPS_AT_THE_GOLGI_MEMBRANE | Genes involved in Synthesis of PIPs at the Golgi membrane |
| 0.1 | 3.0 | REACTOME_TRAFFICKING_OF_GLUR2_CONTAINING_AMPA_RECEPTORS | Genes involved in Trafficking of GluR2-containing AMPA receptors |
| 0.1 | 7.8 | REACTOME_TRANSCRIPTIONAL_REGULATION_OF_WHITE_ADIPOCYTE_DIFFERENTIATION | Genes involved in Transcriptional Regulation of White Adipocyte Differentiation |
| 0.1 | 1.2 | REACTOME_HDL_MEDIATED_LIPID_TRANSPORT | Genes involved in HDL-mediated lipid transport |
| 0.1 | 6.5 | REACTOME_DESTABILIZATION_OF_MRNA_BY_AUF1_HNRNP_D0 | Genes involved in Destabilization of mRNA by AUF1 (hnRNP D0) |
| 0.1 | 2.4 | REACTOME_SYNTHESIS_OF_PC | Genes involved in Synthesis of PC |
| 0.1 | 5.1 | REACTOME_FORMATION_OF_THE_TERNARY_COMPLEX_AND_SUBSEQUENTLY_THE_43S_COMPLEX | Genes involved in Formation of the ternary complex, and subsequently, the 43S complex |
| 0.1 | 4.3 | REACTOME_RNA_POL_III_TRANSCRIPTION | Genes involved in RNA Polymerase III Transcription |
| 0.1 | 2.2 | REACTOME_RAS_ACTIVATION_UOPN_CA2_INFUX_THROUGH_NMDA_RECEPTOR | Genes involved in Ras activation uopn Ca2+ infux through NMDA receptor |
| 0.1 | 3.0 | REACTOME_TRANSPORT_OF_VITAMINS_NUCLEOSIDES_AND_RELATED_MOLECULES | Genes involved in Transport of vitamins, nucleosides, and related molecules |
| 0.1 | 1.7 | REACTOME_DEADENYLATION_OF_MRNA | Genes involved in Deadenylation of mRNA |
| 0.1 | 4.9 | REACTOME_AMINO_ACID_AND_OLIGOPEPTIDE_SLC_TRANSPORTERS | Genes involved in Amino acid and oligopeptide SLC transporters |
| 0.1 | 1.0 | REACTOME_ROLE_OF_DCC_IN_REGULATING_APOPTOSIS | Genes involved in Role of DCC in regulating apoptosis |
| 0.1 | 1.0 | REACTOME_PURINE_CATABOLISM | Genes involved in Purine catabolism |
| 0.1 | 1.1 | REACTOME_CLASS_C_3_METABOTROPIC_GLUTAMATE_PHEROMONE_RECEPTORS | Genes involved in Class C/3 (Metabotropic glutamate/pheromone receptors) |
| 0.1 | 1.4 | REACTOME_CITRIC_ACID_CYCLE_TCA_CYCLE | Genes involved in Citric acid cycle (TCA cycle) |
| 0.1 | 2.0 | REACTOME_CELL_EXTRACELLULAR_MATRIX_INTERACTIONS | Genes involved in Cell-extracellular matrix interactions |
| 0.1 | 4.0 | REACTOME_MITOCHONDRIAL_PROTEIN_IMPORT | Genes involved in Mitochondrial Protein Import |
| 0.1 | 0.9 | REACTOME_GAP_JUNCTION_DEGRADATION | Genes involved in Gap junction degradation |
| 0.1 | 2.8 | REACTOME_INHIBITION_OF_INSULIN_SECRETION_BY_ADRENALINE_NORADRENALINE | Genes involved in Inhibition of Insulin Secretion by Adrenaline/Noradrenaline |
| 0.1 | 2.8 | REACTOME_BMAL1_CLOCK_NPAS2_ACTIVATES_CIRCADIAN_EXPRESSION | Genes involved in BMAL1:CLOCK/NPAS2 Activates Circadian Expression |
| 0.1 | 1.2 | REACTOME_SYNTHESIS_OF_SUBSTRATES_IN_N_GLYCAN_BIOSYTHESIS | Genes involved in Synthesis of substrates in N-glycan biosythesis |
| 0.1 | 3.7 | REACTOME_RESPONSE_TO_ELEVATED_PLATELET_CYTOSOLIC_CA2_ | Genes involved in Response to elevated platelet cytosolic Ca2+ |
| 0.1 | 1.0 | REACTOME_FORMATION_OF_ATP_BY_CHEMIOSMOTIC_COUPLING | Genes involved in Formation of ATP by chemiosmotic coupling |
| 0.1 | 0.9 | REACTOME_BIOSYNTHESIS_OF_THE_N_GLYCAN_PRECURSOR_DOLICHOL_LIPID_LINKED_OLIGOSACCHARIDE_LLO_AND_TRANSFER_TO_A_NASCENT_PROTEIN | Genes involved in Biosynthesis of the N-glycan precursor (dolichol lipid-linked oligosaccharide, LLO) and transfer to a nascent protein |
| 0.1 | 0.4 | REACTOME_NFKB_ACTIVATION_THROUGH_FADD_RIP1_PATHWAY_MEDIATED_BY_CASPASE_8_AND10 | Genes involved in NF-kB activation through FADD/RIP-1 pathway mediated by caspase-8 and -10 |
| 0.1 | 4.8 | REACTOME_PEPTIDE_LIGAND_BINDING_RECEPTORS | Genes involved in Peptide ligand-binding receptors |
| 0.1 | 1.4 | REACTOME_METABOLISM_OF_PORPHYRINS | Genes involved in Metabolism of porphyrins |
| 0.1 | 1.2 | REACTOME_KERATAN_SULFATE_BIOSYNTHESIS | Genes involved in Keratan sulfate biosynthesis |
| 0.1 | 3.7 | REACTOME_3_UTR_MEDIATED_TRANSLATIONAL_REGULATION | Genes involved in 3' -UTR-mediated translational regulation |
| 0.1 | 1.2 | REACTOME_EGFR_DOWNREGULATION | Genes involved in EGFR downregulation |
| 0.0 | 1.0 | REACTOME_MITOCHONDRIAL_TRNA_AMINOACYLATION | Genes involved in Mitochondrial tRNA aminoacylation |
| 0.0 | 1.4 | REACTOME_INTERFERON_ALPHA_BETA_SIGNALING | Genes involved in Interferon alpha/beta signaling |
| 0.0 | 1.6 | REACTOME_SPHINGOLIPID_DE_NOVO_BIOSYNTHESIS | Genes involved in Sphingolipid de novo biosynthesis |
| 0.0 | 0.7 | REACTOME_MYOGENESIS | Genes involved in Myogenesis |
| 0.0 | 0.3 | REACTOME_SIGNALING_BY_PDGF | Genes involved in Signaling by PDGF |
| 0.0 | 0.7 | REACTOME_AMINO_ACID_SYNTHESIS_AND_INTERCONVERSION_TRANSAMINATION | Genes involved in Amino acid synthesis and interconversion (transamination) |
| 0.0 | 0.4 | REACTOME_BASIGIN_INTERACTIONS | Genes involved in Basigin interactions |
| 0.0 | 0.5 | REACTOME_MRNA_DECAY_BY_5_TO_3_EXORIBONUCLEASE | Genes involved in mRNA Decay by 5' to 3' Exoribonuclease |
| 0.0 | 0.8 | REACTOME_PHASE1_FUNCTIONALIZATION_OF_COMPOUNDS | Genes involved in Phase 1 - Functionalization of compounds |
| 0.0 | 0.8 | REACTOME_SEMA4D_INDUCED_CELL_MIGRATION_AND_GROWTH_CONE_COLLAPSE | Genes involved in Sema4D induced cell migration and growth-cone collapse |
| 0.0 | 0.9 | REACTOME_SYNTHESIS_OF_PA | Genes involved in Synthesis of PA |
| 0.0 | 0.4 | REACTOME_REGULATION_OF_INSULIN_LIKE_GROWTH_FACTOR_IGF_ACTIVITY_BY_INSULIN_LIKE_GROWTH_FACTOR_BINDING_PROTEINS_IGFBPS | Genes involved in Regulation of Insulin-like Growth Factor (IGF) Activity by Insulin-like Growth Factor Binding Proteins (IGFBPs) |
| 0.0 | 0.6 | REACTOME_FORMATION_OF_TRANSCRIPTION_COUPLED_NER_TC_NER_REPAIR_COMPLEX | Genes involved in Formation of transcription-coupled NER (TC-NER) repair complex |
| 0.0 | 0.5 | REACTOME_IL1_SIGNALING | Genes involved in Interleukin-1 signaling |
| 0.0 | 0.2 | REACTOME_GPVI_MEDIATED_ACTIVATION_CASCADE | Genes involved in GPVI-mediated activation cascade |
| 0.0 | 0.1 | REACTOME_REGULATION_OF_BETA_CELL_DEVELOPMENT | Genes involved in Regulation of beta-cell development |