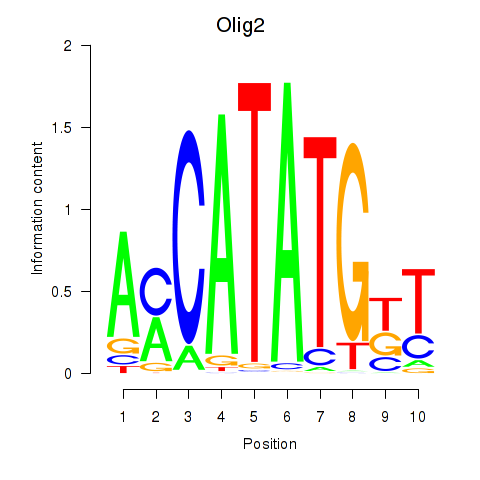
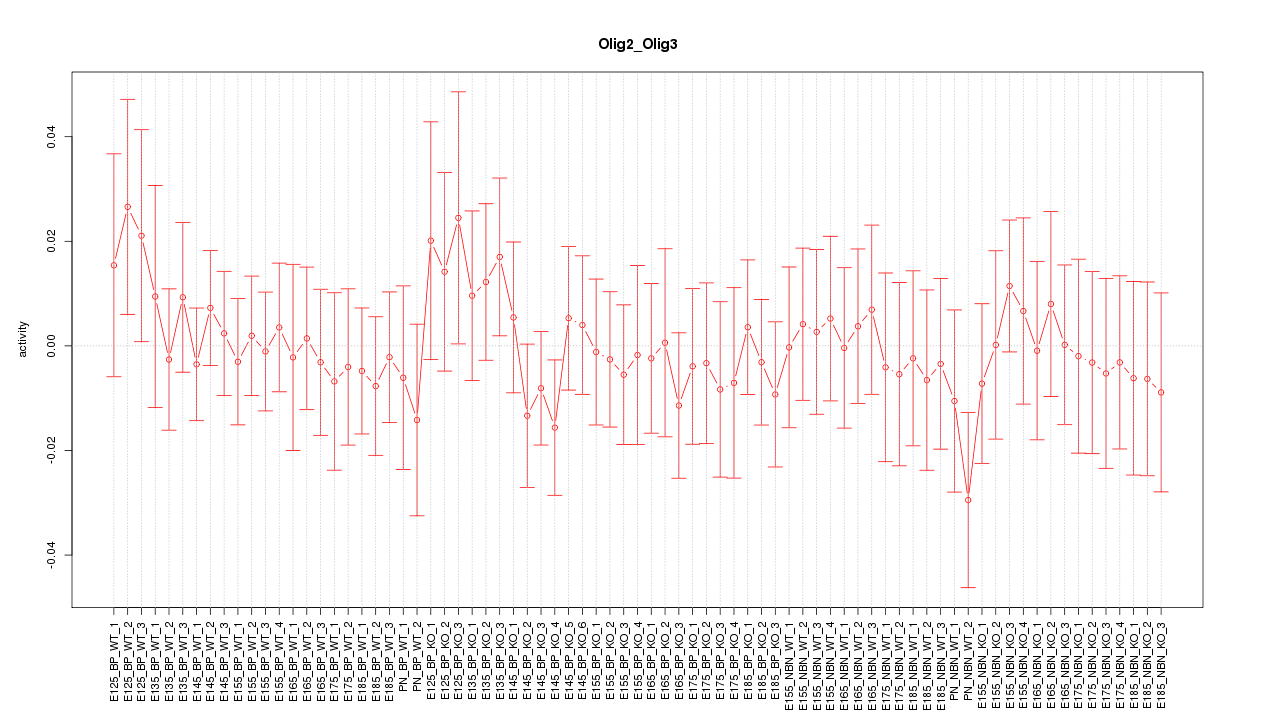
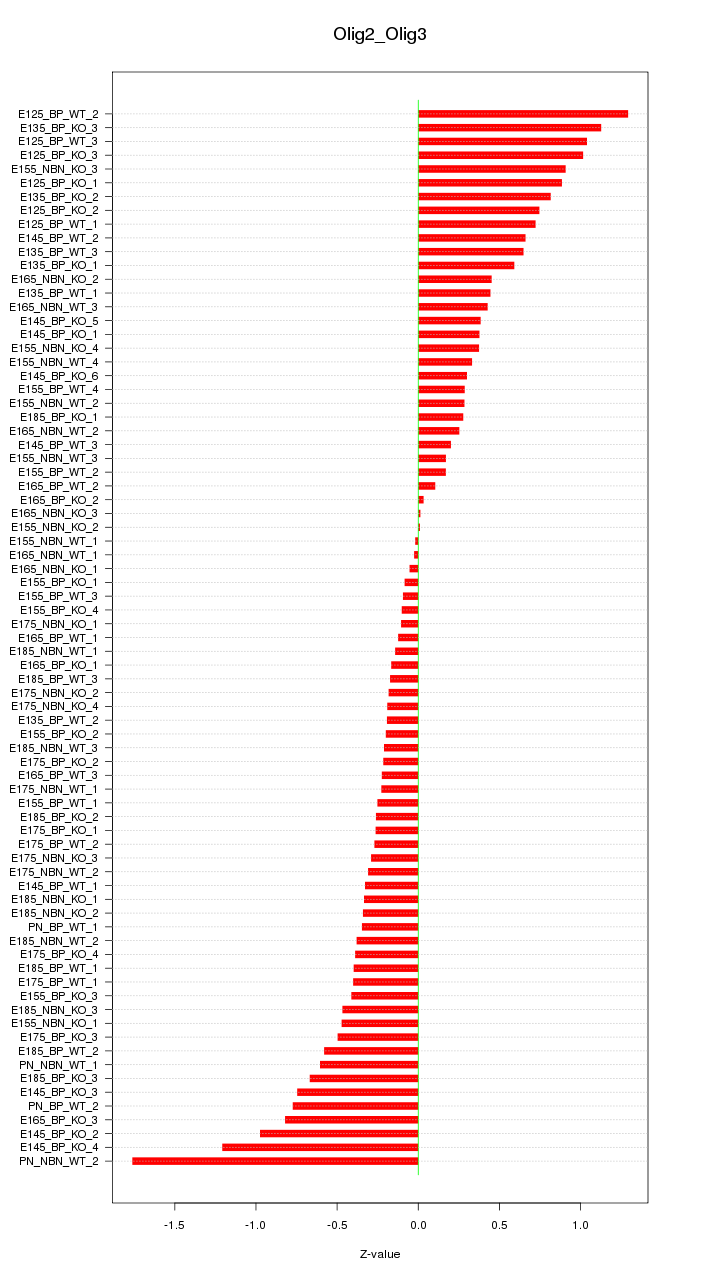
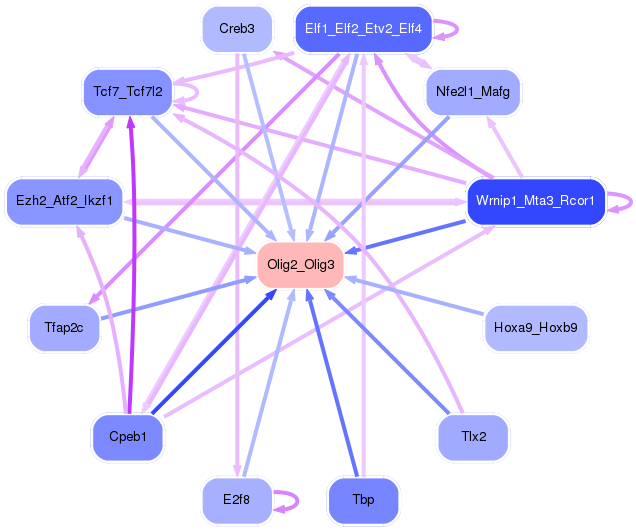
Motif ID: Olig2_Olig3
Z-value: 0.542

Transcription factors associated with Olig2_Olig3:
| Gene Symbol | Entrez ID | Gene Name |
|---|---|---|
| Olig2 | ENSMUSG00000039830.8 | Olig2 |
| Olig3 | ENSMUSG00000045591.5 | Olig3 |
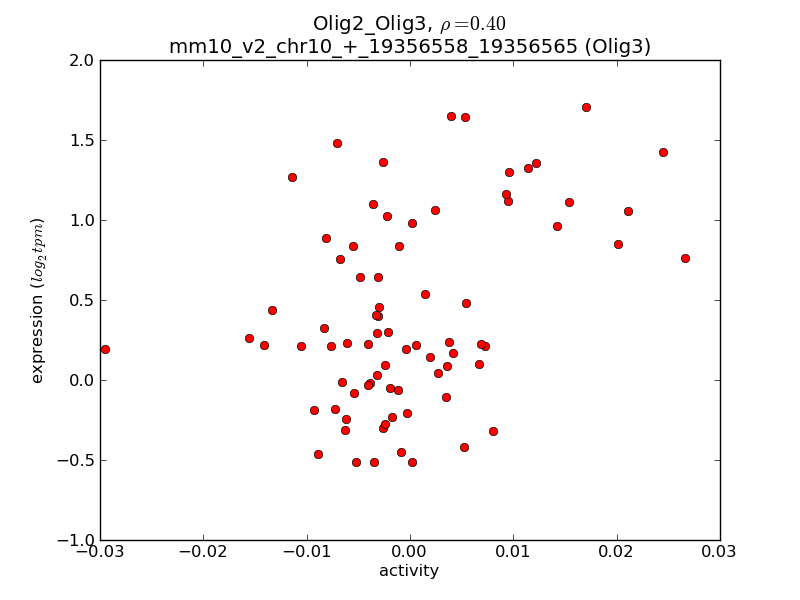
Activity-expression correlation:
| Gene Symbol | Promoter | Pearson corr. coef. | P-value | Plot |
|---|---|---|---|---|
| Olig3 | mm10_v2_chr10_+_19356558_19356565 | 0.40 | 3.1e-04 | Click! |
| Olig2 | mm10_v2_chr16_+_91225550_91225579 | -0.21 | 6.9e-02 | Click! |

Top targets:
Gene overrepresentation in biological_process category:
| Log-likelihood per target | Total log-likelihood | Term | Description |
|---|---|---|---|
| 1.3 | 5.1 | GO:0042905 | 9-cis-retinoic acid biosynthetic process(GO:0042904) 9-cis-retinoic acid metabolic process(GO:0042905) |
| 1.2 | 4.9 | GO:0003365 | establishment of cell polarity involved in ameboidal cell migration(GO:0003365) |
| 1.2 | 3.6 | GO:1902310 | positive regulation of peptidyl-serine dephosphorylation(GO:1902310) |
| 1.0 | 6.2 | GO:0098734 | protein depalmitoylation(GO:0002084) negative regulation of Golgi to plasma membrane protein transport(GO:0042997) negative regulation of establishment of protein localization to plasma membrane(GO:0090005) macromolecule depalmitoylation(GO:0098734) |
| 0.7 | 2.2 | GO:0090285 | negative regulation of protein glycosylation in Golgi(GO:0090285) |
| 0.7 | 3.3 | GO:0046950 | cellular ketone body metabolic process(GO:0046950) |
| 0.5 | 2.7 | GO:0015671 | oxygen transport(GO:0015671) |
| 0.5 | 0.9 | GO:0061339 | establishment of apical/basal cell polarity(GO:0035089) establishment of epithelial cell apical/basal polarity(GO:0045198) establishment of monopolar cell polarity(GO:0061162) establishment or maintenance of monopolar cell polarity(GO:0061339) |
| 0.4 | 1.2 | GO:0044778 | meiotic DNA integrity checkpoint(GO:0044778) |
| 0.4 | 1.2 | GO:2000373 | regulation of DNA topoisomerase (ATP-hydrolyzing) activity(GO:2000371) positive regulation of DNA topoisomerase (ATP-hydrolyzing) activity(GO:2000373) |
| 0.4 | 1.5 | GO:0006751 | glutathione catabolic process(GO:0006751) |
| 0.4 | 1.1 | GO:0002159 | desmosome assembly(GO:0002159) adherens junction maintenance(GO:0034334) intermediate filament bundle assembly(GO:0045110) maintenance of organ identity(GO:0048496) |
| 0.4 | 1.4 | GO:0014005 | microglia differentiation(GO:0014004) microglia development(GO:0014005) |
| 0.3 | 1.0 | GO:0021759 | globus pallidus development(GO:0021759) |
| 0.3 | 1.3 | GO:0006545 | glycine biosynthetic process(GO:0006545) |
| 0.3 | 1.9 | GO:1904426 | positive regulation of GTP binding(GO:1904426) |
| 0.3 | 1.0 | GO:0044837 | assembly of actomyosin apparatus involved in cytokinesis(GO:0000912) actomyosin contractile ring assembly(GO:0000915) actomyosin contractile ring organization(GO:0044837) |
| 0.3 | 1.0 | GO:1904059 | positive regulation of sensory perception of pain(GO:1904058) regulation of locomotor rhythm(GO:1904059) |
| 0.3 | 4.2 | GO:1904321 | response to forskolin(GO:1904321) cellular response to forskolin(GO:1904322) |
| 0.3 | 1.9 | GO:0032796 | uropod organization(GO:0032796) |
| 0.3 | 2.6 | GO:0042760 | very long-chain fatty acid catabolic process(GO:0042760) |
| 0.2 | 1.0 | GO:0046294 | formaldehyde catabolic process(GO:0046294) |
| 0.2 | 0.7 | GO:0002331 | pre-B cell allelic exclusion(GO:0002331) |
| 0.2 | 0.7 | GO:1902071 | positive regulation of cellular response to hypoxia(GO:1900039) regulation of hypoxia-inducible factor-1alpha signaling pathway(GO:1902071) |
| 0.2 | 5.9 | GO:0045663 | positive regulation of myoblast differentiation(GO:0045663) |
| 0.2 | 1.1 | GO:0048245 | eosinophil chemotaxis(GO:0048245) |
| 0.2 | 3.3 | GO:0033623 | regulation of integrin activation(GO:0033623) |
| 0.2 | 1.5 | GO:0032511 | late endosome to vacuole transport via multivesicular body sorting pathway(GO:0032511) |
| 0.2 | 0.6 | GO:0006404 | RNA import into nucleus(GO:0006404) |
| 0.2 | 3.5 | GO:0046069 | cGMP catabolic process(GO:0046069) |
| 0.2 | 1.5 | GO:0002523 | leukocyte migration involved in inflammatory response(GO:0002523) |
| 0.2 | 0.7 | GO:0006529 | asparagine biosynthetic process(GO:0006529) |
| 0.2 | 0.9 | GO:0000480 | endonucleolytic cleavage in 5'-ETS of tricistronic rRNA transcript (SSU-rRNA, 5.8S rRNA, LSU-rRNA)(GO:0000480) |
| 0.2 | 0.5 | GO:0031204 | posttranslational protein targeting to membrane, translocation(GO:0031204) |
| 0.2 | 2.5 | GO:1902004 | positive regulation of beta-amyloid formation(GO:1902004) |
| 0.2 | 0.8 | GO:0061086 | negative regulation of histone H3-K27 methylation(GO:0061086) |
| 0.2 | 1.6 | GO:0016446 | somatic hypermutation of immunoglobulin genes(GO:0016446) |
| 0.2 | 0.8 | GO:0070966 | nuclear-transcribed mRNA catabolic process, no-go decay(GO:0070966) |
| 0.1 | 1.3 | GO:0060510 | Type II pneumocyte differentiation(GO:0060510) |
| 0.1 | 0.6 | GO:0006269 | DNA replication, synthesis of RNA primer(GO:0006269) |
| 0.1 | 2.5 | GO:0031340 | positive regulation of vesicle fusion(GO:0031340) |
| 0.1 | 0.9 | GO:0051461 | protein import into peroxisome matrix, docking(GO:0016560) regulation of corticotropin secretion(GO:0051459) positive regulation of corticotropin secretion(GO:0051461) |
| 0.1 | 0.4 | GO:1990859 | cellular response to endothelin(GO:1990859) |
| 0.1 | 0.4 | GO:0006419 | alanyl-tRNA aminoacylation(GO:0006419) |
| 0.1 | 0.9 | GO:0061092 | bile acid secretion(GO:0032782) regulation of phospholipid translocation(GO:0061091) positive regulation of phospholipid translocation(GO:0061092) |
| 0.1 | 0.4 | GO:0016554 | cytidine to uridine editing(GO:0016554) |
| 0.1 | 0.4 | GO:0006272 | leading strand elongation(GO:0006272) |
| 0.1 | 0.6 | GO:0000117 | regulation of transcription involved in G2/M transition of mitotic cell cycle(GO:0000117) |
| 0.1 | 0.6 | GO:0046684 | response to pyrethroid(GO:0046684) |
| 0.1 | 0.4 | GO:0015866 | ADP transport(GO:0015866) |
| 0.1 | 0.7 | GO:0034587 | piRNA metabolic process(GO:0034587) |
| 0.1 | 0.3 | GO:0097278 | transforming growth factor beta activation(GO:0036363) complement-dependent cytotoxicity(GO:0097278) |
| 0.1 | 0.4 | GO:0006166 | purine ribonucleoside salvage(GO:0006166) |
| 0.1 | 0.6 | GO:0006452 | translational frameshifting(GO:0006452) positive regulation of translational termination(GO:0045905) |
| 0.1 | 0.2 | GO:1904975 | response to bleomycin(GO:1904975) cellular response to bleomycin(GO:1904976) |
| 0.1 | 0.4 | GO:0007217 | tachykinin receptor signaling pathway(GO:0007217) |
| 0.1 | 0.3 | GO:1903976 | negative regulation of glial cell migration(GO:1903976) |
| 0.1 | 0.3 | GO:0042758 | long-chain fatty acid catabolic process(GO:0042758) |
| 0.1 | 0.4 | GO:0043490 | malate-aspartate shuttle(GO:0043490) |
| 0.1 | 0.3 | GO:0007066 | female meiosis sister chromatid cohesion(GO:0007066) |
| 0.1 | 0.3 | GO:0010796 | regulation of multivesicular body size(GO:0010796) |
| 0.1 | 1.7 | GO:0043968 | histone H2A acetylation(GO:0043968) |
| 0.1 | 0.8 | GO:1901838 | positive regulation of transcription of nuclear large rRNA transcript from RNA polymerase I promoter(GO:1901838) |
| 0.1 | 0.8 | GO:0007221 | positive regulation of transcription of Notch receptor target(GO:0007221) |
| 0.1 | 0.2 | GO:1904879 | positive regulation of calcium ion transmembrane transport via high voltage-gated calcium channel(GO:1904879) |
| 0.1 | 0.6 | GO:0048386 | positive regulation of retinoic acid receptor signaling pathway(GO:0048386) |
| 0.1 | 1.1 | GO:0046855 | inositol phosphate dephosphorylation(GO:0046855) |
| 0.1 | 0.8 | GO:0006995 | cellular response to nitrogen starvation(GO:0006995) cellular response to nitrogen levels(GO:0043562) |
| 0.1 | 1.0 | GO:0009048 | dosage compensation by inactivation of X chromosome(GO:0009048) |
| 0.1 | 0.3 | GO:1904354 | negative regulation of telomere capping(GO:1904354) |
| 0.1 | 0.3 | GO:0032472 | Golgi calcium ion transport(GO:0032472) |
| 0.1 | 1.0 | GO:0048387 | negative regulation of retinoic acid receptor signaling pathway(GO:0048387) |
| 0.1 | 0.5 | GO:0098700 | neurotransmitter loading into synaptic vesicle(GO:0098700) |
| 0.1 | 0.3 | GO:0003431 | growth plate cartilage chondrocyte development(GO:0003431) |
| 0.1 | 1.2 | GO:0006958 | complement activation, classical pathway(GO:0006958) |
| 0.1 | 0.3 | GO:0006537 | glutamate biosynthetic process(GO:0006537) glutamine catabolic process(GO:0006543) |
| 0.1 | 0.3 | GO:1902308 | regulation of peptidyl-serine dephosphorylation(GO:1902308) |
| 0.1 | 0.4 | GO:0051418 | interphase microtubule nucleation by interphase microtubule organizing center(GO:0051415) microtubule nucleation by microtubule organizing center(GO:0051418) |
| 0.1 | 0.6 | GO:0019368 | fatty acid elongation, saturated fatty acid(GO:0019367) fatty acid elongation, unsaturated fatty acid(GO:0019368) fatty acid elongation, monounsaturated fatty acid(GO:0034625) fatty acid elongation, polyunsaturated fatty acid(GO:0034626) |
| 0.1 | 2.4 | GO:0086010 | membrane depolarization during action potential(GO:0086010) |
| 0.1 | 0.3 | GO:1904690 | adenosine to inosine editing(GO:0006382) regulation of cap-independent translational initiation(GO:1903677) positive regulation of cap-independent translational initiation(GO:1903679) regulation of cytoplasmic translational initiation(GO:1904688) positive regulation of cytoplasmic translational initiation(GO:1904690) |
| 0.0 | 0.4 | GO:0006398 | mRNA 3'-end processing by stem-loop binding and cleavage(GO:0006398) |
| 0.0 | 0.3 | GO:1904491 | protein localization to ciliary transition zone(GO:1904491) |
| 0.0 | 2.7 | GO:0070303 | negative regulation of stress-activated MAPK cascade(GO:0032873) negative regulation of stress-activated protein kinase signaling cascade(GO:0070303) |
| 0.0 | 5.4 | GO:0030048 | actin filament-based movement(GO:0030048) |
| 0.0 | 0.5 | GO:0018230 | peptidyl-L-cysteine S-palmitoylation(GO:0018230) peptidyl-S-diacylglycerol-L-cysteine biosynthetic process from peptidyl-cysteine(GO:0018231) |
| 0.0 | 0.3 | GO:0006265 | DNA topological change(GO:0006265) |
| 0.0 | 1.3 | GO:0001921 | positive regulation of receptor recycling(GO:0001921) |
| 0.0 | 1.4 | GO:0014037 | Schwann cell differentiation(GO:0014037) |
| 0.0 | 0.9 | GO:0048368 | lateral mesoderm development(GO:0048368) |
| 0.0 | 1.2 | GO:0001893 | maternal placenta development(GO:0001893) |
| 0.0 | 0.2 | GO:0007632 | visual behavior(GO:0007632) |
| 0.0 | 0.2 | GO:0090164 | asymmetric Golgi ribbon formation(GO:0090164) |
| 0.0 | 1.2 | GO:0034723 | DNA replication-dependent nucleosome assembly(GO:0006335) DNA replication-dependent nucleosome organization(GO:0034723) |
| 0.0 | 0.8 | GO:0008209 | androgen metabolic process(GO:0008209) |
| 0.0 | 0.4 | GO:0051490 | negative regulation of filopodium assembly(GO:0051490) |
| 0.0 | 0.1 | GO:0035609 | C-terminal protein deglutamylation(GO:0035609) |
| 0.0 | 0.6 | GO:0015701 | bicarbonate transport(GO:0015701) |
| 0.0 | 0.4 | GO:0043011 | myeloid dendritic cell differentiation(GO:0043011) |
| 0.0 | 0.8 | GO:1902857 | positive regulation of nonmotile primary cilium assembly(GO:1902857) |
| 0.0 | 0.3 | GO:2000381 | negative regulation of mesoderm development(GO:2000381) |
| 0.0 | 2.1 | GO:0010923 | negative regulation of phosphatase activity(GO:0010923) |
| 0.0 | 0.2 | GO:0009162 | deoxyribonucleoside monophosphate metabolic process(GO:0009162) |
| 0.0 | 0.1 | GO:0002182 | cytoplasmic translational elongation(GO:0002182) regulation of cytoplasmic translational elongation(GO:1900247) negative regulation of cytoplasmic translational elongation(GO:1900248) |
| 0.0 | 0.3 | GO:0031507 | heterochromatin assembly(GO:0031507) |
| 0.0 | 0.1 | GO:0070837 | dehydroascorbic acid transport(GO:0070837) |
| 0.0 | 0.2 | GO:0006123 | mitochondrial electron transport, cytochrome c to oxygen(GO:0006123) |
| 0.0 | 0.4 | GO:0032288 | myelin assembly(GO:0032288) |
| 0.0 | 1.3 | GO:0060292 | long term synaptic depression(GO:0060292) |
| 0.0 | 1.8 | GO:0002377 | immunoglobulin production(GO:0002377) |
| 0.0 | 0.5 | GO:0021702 | cerebellar Purkinje cell differentiation(GO:0021702) |
| 0.0 | 0.2 | GO:0050910 | detection of mechanical stimulus involved in sensory perception of sound(GO:0050910) |
| 0.0 | 1.3 | GO:0050868 | negative regulation of T cell activation(GO:0050868) |
| 0.0 | 0.1 | GO:2000766 | negative regulation of cytoplasmic translation(GO:2000766) |
| 0.0 | 1.6 | GO:0007156 | homophilic cell adhesion via plasma membrane adhesion molecules(GO:0007156) |
| 0.0 | 0.3 | GO:0006978 | DNA damage response, signal transduction by p53 class mediator resulting in transcription of p21 class mediator(GO:0006978) |
| 0.0 | 1.6 | GO:0043488 | regulation of mRNA stability(GO:0043488) |
| 0.0 | 0.7 | GO:0006110 | regulation of glycolytic process(GO:0006110) |
| 0.0 | 0.2 | GO:0070389 | chaperone cofactor-dependent protein refolding(GO:0070389) |
| 0.0 | 2.5 | GO:0008360 | regulation of cell shape(GO:0008360) |
| 0.0 | 0.3 | GO:1903963 | arachidonic acid secretion(GO:0050482) arachidonate transport(GO:1903963) |
| 0.0 | 2.8 | GO:0016042 | lipid catabolic process(GO:0016042) |
| 0.0 | 0.4 | GO:0030970 | retrograde protein transport, ER to cytosol(GO:0030970) |
| 0.0 | 0.1 | GO:2000671 | regulation of motor neuron apoptotic process(GO:2000671) |
| 0.0 | 0.1 | GO:0034453 | microtubule anchoring(GO:0034453) |
| 0.0 | 0.5 | GO:0071300 | cellular response to retinoic acid(GO:0071300) |
| 0.0 | 0.1 | GO:0048384 | retinoic acid receptor signaling pathway(GO:0048384) |
| 0.0 | 0.2 | GO:0007130 | synaptonemal complex assembly(GO:0007130) |
| 0.0 | 0.2 | GO:0048875 | chemical homeostasis within a tissue(GO:0048875) |
| 0.0 | 0.1 | GO:0070327 | thyroid hormone transport(GO:0070327) |
| 0.0 | 0.1 | GO:0001682 | tRNA 5'-leader removal(GO:0001682) |
Gene overrepresentation in cellular_component category:
| Log-likelihood per target | Total log-likelihood | Term | Description |
|---|---|---|---|
| 0.7 | 2.0 | GO:0044299 | C-fiber(GO:0044299) |
| 0.4 | 4.2 | GO:0031362 | anchored component of external side of plasma membrane(GO:0031362) |
| 0.3 | 2.7 | GO:0005833 | hemoglobin complex(GO:0005833) |
| 0.3 | 0.9 | GO:0071149 | TEAD-2-YAP complex(GO:0071149) |
| 0.3 | 1.1 | GO:0070552 | BRISC complex(GO:0070552) |
| 0.3 | 1.6 | GO:0001674 | female germ cell nucleus(GO:0001674) |
| 0.2 | 1.9 | GO:0005775 | vacuolar lumen(GO:0005775) |
| 0.2 | 0.9 | GO:0017071 | intracellular cyclic nucleotide activated cation channel complex(GO:0017071) |
| 0.2 | 1.3 | GO:0033010 | paranodal junction(GO:0033010) |
| 0.2 | 1.2 | GO:0030896 | checkpoint clamp complex(GO:0030896) |
| 0.2 | 1.2 | GO:0070937 | CRD-mediated mRNA stability complex(GO:0070937) |
| 0.2 | 0.6 | GO:0034457 | Mpp10 complex(GO:0034457) |
| 0.2 | 1.9 | GO:0032426 | stereocilium tip(GO:0032426) |
| 0.2 | 0.8 | GO:0097149 | centralspindlin complex(GO:0097149) |
| 0.2 | 0.5 | GO:0031205 | endoplasmic reticulum Sec complex(GO:0031205) |
| 0.1 | 0.4 | GO:0070557 | PCNA-p21 complex(GO:0070557) |
| 0.1 | 0.9 | GO:0046581 | intercellular canaliculus(GO:0046581) |
| 0.1 | 0.6 | GO:0005658 | alpha DNA polymerase:primase complex(GO:0005658) |
| 0.1 | 5.3 | GO:0008180 | COP9 signalosome(GO:0008180) |
| 0.1 | 6.6 | GO:0044295 | axonal growth cone(GO:0044295) |
| 0.1 | 1.2 | GO:0042571 | immunoglobulin complex, circulating(GO:0042571) |
| 0.1 | 1.5 | GO:0042788 | polysomal ribosome(GO:0042788) |
| 0.1 | 0.7 | GO:0060293 | P granule(GO:0043186) pole plasm(GO:0045495) germ plasm(GO:0060293) |
| 0.1 | 0.4 | GO:0000931 | gamma-tubulin large complex(GO:0000931) gamma-tubulin ring complex(GO:0008274) |
| 0.1 | 0.3 | GO:0044194 | cytolytic granule(GO:0044194) |
| 0.1 | 1.1 | GO:0030057 | desmosome(GO:0030057) |
| 0.1 | 0.2 | GO:0031417 | NatC complex(GO:0031417) |
| 0.1 | 0.3 | GO:0033063 | Rad51B-Rad51C-Rad51D-XRCC2 complex(GO:0033063) |
| 0.1 | 1.3 | GO:0031616 | spindle pole centrosome(GO:0031616) |
| 0.1 | 1.1 | GO:0031045 | dense core granule(GO:0031045) |
| 0.1 | 1.7 | GO:0043189 | NuA4 histone acetyltransferase complex(GO:0035267) H4/H2A histone acetyltransferase complex(GO:0043189) H4 histone acetyltransferase complex(GO:1902562) |
| 0.1 | 0.9 | GO:0005640 | nuclear outer membrane(GO:0005640) |
| 0.1 | 0.3 | GO:0044615 | nuclear pore nuclear basket(GO:0044615) |
| 0.1 | 0.6 | GO:0005642 | annulate lamellae(GO:0005642) |
| 0.1 | 0.3 | GO:0033391 | chromatoid body(GO:0033391) |
| 0.1 | 0.7 | GO:0000974 | Prp19 complex(GO:0000974) |
| 0.1 | 0.7 | GO:0031588 | nucleotide-activated protein kinase complex(GO:0031588) |
| 0.1 | 0.3 | GO:0036396 | MIS complex(GO:0036396) mRNA editing complex(GO:0045293) |
| 0.1 | 0.4 | GO:0071203 | WASH complex(GO:0071203) |
| 0.1 | 0.8 | GO:0031105 | septin complex(GO:0031105) |
| 0.0 | 2.5 | GO:0031201 | SNARE complex(GO:0031201) |
| 0.0 | 1.0 | GO:0000421 | autophagosome membrane(GO:0000421) |
| 0.0 | 1.5 | GO:0001772 | immunological synapse(GO:0001772) |
| 0.0 | 0.5 | GO:0001739 | sex chromatin(GO:0001739) |
| 0.0 | 0.6 | GO:0001518 | voltage-gated sodium channel complex(GO:0001518) |
| 0.0 | 0.3 | GO:0030870 | Mre11 complex(GO:0030870) |
| 0.0 | 0.2 | GO:0031673 | H zone(GO:0031673) |
| 0.0 | 1.8 | GO:0030173 | integral component of Golgi membrane(GO:0030173) |
| 0.0 | 0.2 | GO:1902636 | kinociliary basal body(GO:1902636) |
| 0.0 | 0.3 | GO:0005828 | kinetochore microtubule(GO:0005828) postsynaptic recycling endosome(GO:0098837) |
| 0.0 | 0.8 | GO:0035098 | ESC/E(Z) complex(GO:0035098) |
| 0.0 | 3.1 | GO:0001725 | stress fiber(GO:0001725) contractile actin filament bundle(GO:0097517) |
| 0.0 | 0.3 | GO:0005677 | chromatin silencing complex(GO:0005677) |
| 0.0 | 0.5 | GO:0030285 | integral component of synaptic vesicle membrane(GO:0030285) intrinsic component of synaptic vesicle membrane(GO:0098563) |
| 0.0 | 0.3 | GO:0072669 | tRNA-splicing ligase complex(GO:0072669) |
| 0.0 | 4.0 | GO:0043296 | apical junction complex(GO:0043296) |
| 0.0 | 0.9 | GO:0032040 | small-subunit processome(GO:0032040) |
| 0.0 | 1.9 | GO:0005778 | peroxisomal membrane(GO:0005778) microbody membrane(GO:0031903) |
| 0.0 | 0.2 | GO:1990454 | L-type voltage-gated calcium channel complex(GO:1990454) |
| 0.0 | 1.7 | GO:0005874 | microtubule(GO:0005874) |
| 0.0 | 0.2 | GO:1990124 | messenger ribonucleoprotein complex(GO:1990124) |
| 0.0 | 0.1 | GO:0005655 | nucleolar ribonuclease P complex(GO:0005655) |
| 0.0 | 0.2 | GO:0005751 | mitochondrial respiratory chain complex IV(GO:0005751) |
| 0.0 | 0.9 | GO:0005844 | polysome(GO:0005844) |
| 0.0 | 1.4 | GO:0043198 | dendritic shaft(GO:0043198) |
| 0.0 | 0.5 | GO:0000788 | nuclear nucleosome(GO:0000788) |
| 0.0 | 0.2 | GO:0017119 | Golgi transport complex(GO:0017119) |
| 0.0 | 0.2 | GO:0031462 | Cul2-RING ubiquitin ligase complex(GO:0031462) |
| 0.0 | 0.6 | GO:0014704 | intercalated disc(GO:0014704) |
| 0.0 | 0.2 | GO:0036038 | MKS complex(GO:0036038) |
| 0.0 | 0.2 | GO:0030008 | TRAPP complex(GO:0030008) |
| 0.0 | 1.1 | GO:0030136 | clathrin-coated vesicle(GO:0030136) |
| 0.0 | 0.3 | GO:0032588 | trans-Golgi network membrane(GO:0032588) |
| 0.0 | 0.4 | GO:0015030 | Cajal body(GO:0015030) |
| 0.0 | 0.2 | GO:0010369 | chromocenter(GO:0010369) |
Gene overrepresentation in molecular_function category:
| Log-likelihood per target | Total log-likelihood | Term | Description |
|---|---|---|---|
| 1.2 | 3.6 | GO:0004647 | phosphoserine phosphatase activity(GO:0004647) |
| 1.1 | 8.0 | GO:0015016 | [heparan sulfate]-glucosamine N-sulfotransferase activity(GO:0015016) |
| 1.0 | 5.1 | GO:0004028 | 3-chloroallyl aldehyde dehydrogenase activity(GO:0004028) |
| 1.0 | 4.9 | GO:0043532 | angiostatin binding(GO:0043532) |
| 0.8 | 3.3 | GO:0016833 | oxo-acid-lyase activity(GO:0016833) |
| 0.7 | 2.2 | GO:0071633 | dihydroceramidase activity(GO:0071633) |
| 0.6 | 6.2 | GO:0008474 | palmitoyl-(protein) hydrolase activity(GO:0008474) palmitoyl hydrolase activity(GO:0098599) |
| 0.5 | 2.7 | GO:0005344 | oxygen transporter activity(GO:0005344) |
| 0.5 | 3.5 | GO:0048101 | calmodulin-dependent cyclic-nucleotide phosphodiesterase activity(GO:0004117) calcium- and calmodulin-regulated 3',5'-cyclic-GMP phosphodiesterase activity(GO:0048101) |
| 0.4 | 1.6 | GO:0008309 | double-stranded DNA exodeoxyribonuclease activity(GO:0008309) |
| 0.4 | 1.1 | GO:0008732 | threonine aldolase activity(GO:0004793) L-allo-threonine aldolase activity(GO:0008732) |
| 0.3 | 1.0 | GO:0018738 | S-formylglutathione hydrolase activity(GO:0018738) |
| 0.3 | 3.5 | GO:0005167 | neurotrophin TRK receptor binding(GO:0005167) |
| 0.3 | 1.3 | GO:0008273 | calcium, potassium:sodium antiporter activity(GO:0008273) |
| 0.2 | 3.3 | GO:0031005 | filamin binding(GO:0031005) |
| 0.2 | 1.5 | GO:0008242 | omega peptidase activity(GO:0008242) |
| 0.2 | 0.9 | GO:0005052 | peroxisome matrix targeting signal-1 binding(GO:0005052) |
| 0.2 | 0.9 | GO:0008559 | xenobiotic-transporting ATPase activity(GO:0008559) phosphatidylcholine-translocating ATPase activity(GO:0090554) |
| 0.2 | 0.7 | GO:0004066 | asparagine synthase (glutamine-hydrolyzing) activity(GO:0004066) |
| 0.2 | 1.9 | GO:0032036 | myosin heavy chain binding(GO:0032036) |
| 0.2 | 1.6 | GO:0001206 | transcriptional repressor activity, RNA polymerase II distal enhancer sequence-specific binding(GO:0001206) |
| 0.2 | 0.5 | GO:0001729 | ceramide kinase activity(GO:0001729) |
| 0.1 | 0.4 | GO:0004731 | purine-nucleoside phosphorylase activity(GO:0004731) |
| 0.1 | 6.2 | GO:0035035 | histone acetyltransferase binding(GO:0035035) |
| 0.1 | 1.2 | GO:0034046 | poly(G) binding(GO:0034046) |
| 0.1 | 0.4 | GO:0004813 | alanine-tRNA ligase activity(GO:0004813) |
| 0.1 | 1.9 | GO:0005537 | mannose binding(GO:0005537) |
| 0.1 | 2.2 | GO:0043008 | ATP-dependent protein binding(GO:0043008) |
| 0.1 | 1.8 | GO:0004435 | phosphatidylinositol phospholipase C activity(GO:0004435) |
| 0.1 | 0.4 | GO:0004921 | interleukin-11 receptor activity(GO:0004921) interleukin-11 binding(GO:0019970) |
| 0.1 | 1.3 | GO:0070008 | serine-type exopeptidase activity(GO:0070008) |
| 0.1 | 0.7 | GO:0008607 | phosphorylase kinase regulator activity(GO:0008607) |
| 0.1 | 0.4 | GO:0004126 | cytidine deaminase activity(GO:0004126) |
| 0.1 | 0.4 | GO:0004703 | G-protein coupled receptor kinase activity(GO:0004703) |
| 0.1 | 0.4 | GO:0015183 | L-aspartate transmembrane transporter activity(GO:0015183) |
| 0.1 | 1.1 | GO:0045294 | alpha-catenin binding(GO:0045294) |
| 0.1 | 1.0 | GO:0042923 | neuropeptide binding(GO:0042923) |
| 0.1 | 0.6 | GO:0031821 | G-protein coupled serotonin receptor binding(GO:0031821) |
| 0.1 | 1.2 | GO:0034987 | immunoglobulin receptor binding(GO:0034987) |
| 0.1 | 0.6 | GO:0016312 | inositol bisphosphate phosphatase activity(GO:0016312) |
| 0.1 | 0.5 | GO:0015450 | P-P-bond-hydrolysis-driven protein transmembrane transporter activity(GO:0015450) |
| 0.1 | 1.8 | GO:0005248 | voltage-gated sodium channel activity(GO:0005248) |
| 0.1 | 0.3 | GO:0004466 | long-chain-acyl-CoA dehydrogenase activity(GO:0004466) |
| 0.1 | 0.3 | GO:0003917 | DNA topoisomerase type I activity(GO:0003917) |
| 0.1 | 0.7 | GO:0070181 | small ribosomal subunit rRNA binding(GO:0070181) |
| 0.1 | 1.0 | GO:0044323 | retinoic acid-responsive element binding(GO:0044323) |
| 0.1 | 0.2 | GO:0042284 | sphingolipid delta-4 desaturase activity(GO:0042284) |
| 0.1 | 0.3 | GO:0016422 | mRNA (2'-O-methyladenosine-N6-)-methyltransferase activity(GO:0016422) |
| 0.1 | 0.2 | GO:0051870 | methotrexate binding(GO:0051870) |
| 0.1 | 0.2 | GO:0086056 | voltage-gated calcium channel activity involved in AV node cell action potential(GO:0086056) |
| 0.1 | 2.5 | GO:0005544 | calcium-dependent phospholipid binding(GO:0005544) |
| 0.1 | 0.3 | GO:0004359 | glutaminase activity(GO:0004359) |
| 0.1 | 0.6 | GO:0009922 | fatty acid elongase activity(GO:0009922) 3-oxo-arachidoyl-CoA synthase activity(GO:0102336) 3-oxo-cerotoyl-CoA synthase activity(GO:0102337) 3-oxo-lignoceronyl-CoA synthase activity(GO:0102338) |
| 0.1 | 0.6 | GO:0017070 | U6 snRNA binding(GO:0017070) |
| 0.0 | 0.9 | GO:0001134 | transcription factor activity, transcription factor recruiting(GO:0001134) |
| 0.0 | 0.3 | GO:0000150 | recombinase activity(GO:0000150) |
| 0.0 | 0.8 | GO:0050811 | GABA receptor binding(GO:0050811) |
| 0.0 | 1.7 | GO:0017091 | AU-rich element binding(GO:0017091) |
| 0.0 | 0.1 | GO:0031871 | proteinase activated receptor binding(GO:0031871) |
| 0.0 | 1.1 | GO:0080025 | phosphatidylinositol-3,5-bisphosphate binding(GO:0080025) |
| 0.0 | 0.6 | GO:0016805 | dipeptidase activity(GO:0016805) |
| 0.0 | 0.8 | GO:0003950 | NAD+ ADP-ribosyltransferase activity(GO:0003950) |
| 0.0 | 0.4 | GO:0051011 | microtubule minus-end binding(GO:0051011) |
| 0.0 | 0.4 | GO:0015217 | ATP transmembrane transporter activity(GO:0005347) ADP transmembrane transporter activity(GO:0015217) |
| 0.0 | 0.2 | GO:0003828 | alpha-N-acetylneuraminate alpha-2,8-sialyltransferase activity(GO:0003828) |
| 0.0 | 0.6 | GO:0008510 | sodium:bicarbonate symporter activity(GO:0008510) |
| 0.0 | 0.1 | GO:0030292 | protein tyrosine kinase inhibitor activity(GO:0030292) |
| 0.0 | 0.5 | GO:0015172 | L-glutamate transmembrane transporter activity(GO:0005313) acidic amino acid transmembrane transporter activity(GO:0015172) |
| 0.0 | 0.4 | GO:0035613 | RNA stem-loop binding(GO:0035613) |
| 0.0 | 0.5 | GO:0016799 | hydrolase activity, hydrolyzing N-glycosyl compounds(GO:0016799) |
| 0.0 | 0.3 | GO:0008656 | cysteine-type endopeptidase activator activity involved in apoptotic process(GO:0008656) |
| 0.0 | 0.3 | GO:0015149 | glucose transmembrane transporter activity(GO:0005355) hexose transmembrane transporter activity(GO:0015149) |
| 0.0 | 0.1 | GO:0033300 | dehydroascorbic acid transporter activity(GO:0033300) |
| 0.0 | 0.1 | GO:0008545 | JUN kinase kinase activity(GO:0008545) |
| 0.0 | 0.3 | GO:0050815 | phosphoserine binding(GO:0050815) |
| 0.0 | 0.4 | GO:1904264 | ubiquitin protein ligase activity involved in ERAD pathway(GO:1904264) |
| 0.0 | 0.1 | GO:0004886 | 9-cis retinoic acid receptor activity(GO:0004886) |
| 0.0 | 0.2 | GO:0030976 | thiamine pyrophosphate binding(GO:0030976) |
| 0.0 | 2.2 | GO:0004860 | protein kinase inhibitor activity(GO:0004860) |
| 0.0 | 2.3 | GO:0015399 | primary active transmembrane transporter activity(GO:0015399) P-P-bond-hydrolysis-driven transmembrane transporter activity(GO:0015405) |
| 0.0 | 0.8 | GO:0005547 | phosphatidylinositol-3,4,5-trisphosphate binding(GO:0005547) |
| 0.0 | 0.1 | GO:0016979 | lipoate-protein ligase activity(GO:0016979) |
| 0.0 | 0.4 | GO:0005159 | insulin-like growth factor receptor binding(GO:0005159) |
| 0.0 | 0.3 | GO:0070628 | proteasome binding(GO:0070628) |
| 0.0 | 0.9 | GO:0043022 | ribosome binding(GO:0043022) |
| 0.0 | 1.1 | GO:0004004 | RNA helicase activity(GO:0003724) ATP-dependent RNA helicase activity(GO:0004004) |
| 0.0 | 2.8 | GO:0051015 | actin filament binding(GO:0051015) |
| 0.0 | 1.0 | GO:0003743 | translation initiation factor activity(GO:0003743) |
| 0.0 | 0.2 | GO:0031802 | type 5 metabotropic glutamate receptor binding(GO:0031802) |
| 0.0 | 0.6 | GO:0003899 | DNA-directed RNA polymerase activity(GO:0003899) |
| 0.0 | 0.1 | GO:0015349 | thyroid hormone transmembrane transporter activity(GO:0015349) |
| 0.0 | 0.3 | GO:0004623 | phospholipase A2 activity(GO:0004623) |
| 0.0 | 0.0 | GO:0008312 | 7S RNA binding(GO:0008312) endoplasmic reticulum signal peptide binding(GO:0030942) |
| 0.0 | 1.2 | GO:0004222 | metalloendopeptidase activity(GO:0004222) |
| 0.0 | 1.3 | GO:0005178 | integrin binding(GO:0005178) |
| 0.0 | 0.5 | GO:0031624 | ubiquitin conjugating enzyme binding(GO:0031624) |
| 0.0 | 0.4 | GO:0051059 | NF-kappaB binding(GO:0051059) |
| 0.0 | 0.1 | GO:0004526 | ribonuclease P activity(GO:0004526) |
| 0.0 | 0.8 | GO:0035064 | methylated histone binding(GO:0035064) |
| 0.0 | 0.2 | GO:0004129 | cytochrome-c oxidase activity(GO:0004129) heme-copper terminal oxidase activity(GO:0015002) oxidoreductase activity, acting on a heme group of donors, oxygen as acceptor(GO:0016676) |
| 0.0 | 0.3 | GO:0070840 | dynein complex binding(GO:0070840) |
| 0.0 | 0.6 | GO:0003707 | steroid hormone receptor activity(GO:0003707) |
| 0.0 | 0.5 | GO:0031492 | nucleosomal DNA binding(GO:0031492) |
| 0.0 | 0.4 | GO:0004364 | glutathione transferase activity(GO:0004364) |
Gene overrepresentation in C2:CP category:
| Log-likelihood per target | Total log-likelihood | Term | Description |
|---|---|---|---|
| 0.2 | 5.9 | PID_HEDGEHOG_2PATHWAY | Signaling events mediated by the Hedgehog family |
| 0.1 | 4.6 | PID_EPHA_FWDPATHWAY | EPHA forward signaling |
| 0.1 | 1.3 | PID_CONE_PATHWAY | Visual signal transduction: Cones |
| 0.1 | 1.3 | PID_INTEGRIN2_PATHWAY | Beta2 integrin cell surface interactions |
| 0.0 | 1.1 | PID_IL27_PATHWAY | IL27-mediated signaling events |
| 0.0 | 0.6 | PID_S1P_S1P4_PATHWAY | S1P4 pathway |
| 0.0 | 1.7 | PID_ATR_PATHWAY | ATR signaling pathway |
| 0.0 | 0.4 | PID_ALPHA_SYNUCLEIN_PATHWAY | Alpha-synuclein signaling |
| 0.0 | 0.8 | PID_AURORA_A_PATHWAY | Aurora A signaling |
| 0.0 | 0.8 | PID_CDC42_REG_PATHWAY | Regulation of CDC42 activity |
| 0.0 | 0.6 | ST_GRANULE_CELL_SURVIVAL_PATHWAY | Granule Cell Survival Pathway is a specific case of more general PAC1 Receptor Pathway. |
| 0.0 | 0.2 | PID_LYMPH_ANGIOGENESIS_PATHWAY | VEGFR3 signaling in lymphatic endothelium |
| 0.0 | 0.8 | PID_A6B1_A6B4_INTEGRIN_PATHWAY | a6b1 and a6b4 Integrin signaling |
| 0.0 | 0.8 | PID_IL4_2PATHWAY | IL4-mediated signaling events |
| 0.0 | 0.7 | ST_ERK1_ERK2_MAPK_PATHWAY | ERK1/ERK2 MAPK Pathway |
| 0.0 | 0.4 | PID_BARD1_PATHWAY | BARD1 signaling events |
Gene overrepresentation in C2:CP:REACTOME category:
| Log-likelihood per target | Total log-likelihood | Term | Description |
|---|---|---|---|
| 1.3 | 5.1 | REACTOME_ETHANOL_OXIDATION | Genes involved in Ethanol oxidation |
| 0.2 | 8.0 | REACTOME_HS_GAG_BIOSYNTHESIS | Genes involved in HS-GAG biosynthesis |
| 0.2 | 6.6 | REACTOME_MYOGENESIS | Genes involved in Myogenesis |
| 0.2 | 5.2 | REACTOME_SIGNALING_BY_HIPPO | Genes involved in Signaling by Hippo |
| 0.1 | 3.5 | REACTOME_CGMP_EFFECTS | Genes involved in cGMP effects |
| 0.1 | 3.2 | REACTOME_CELL_EXTRACELLULAR_MATRIX_INTERACTIONS | Genes involved in Cell-extracellular matrix interactions |
| 0.1 | 3.5 | REACTOME_ADHERENS_JUNCTIONS_INTERACTIONS | Genes involved in Adherens junctions interactions |
| 0.1 | 1.9 | REACTOME_ABCA_TRANSPORTERS_IN_LIPID_HOMEOSTASIS | Genes involved in ABCA transporters in lipid homeostasis |
| 0.1 | 1.8 | REACTOME_TRAFFICKING_OF_GLUR2_CONTAINING_AMPA_RECEPTORS | Genes involved in Trafficking of GluR2-containing AMPA receptors |
| 0.1 | 1.1 | REACTOME_SYNTHESIS_OF_PIPS_AT_THE_LATE_ENDOSOME_MEMBRANE | Genes involved in Synthesis of PIPs at the late endosome membrane |
| 0.1 | 0.8 | REACTOME_POL_SWITCHING | Genes involved in Polymerase switching |
| 0.1 | 1.3 | REACTOME_REGULATION_OF_KIT_SIGNALING | Genes involved in Regulation of KIT signaling |
| 0.1 | 1.5 | REACTOME_GLUTATHIONE_CONJUGATION | Genes involved in Glutathione conjugation |
| 0.1 | 2.4 | REACTOME_SPHINGOLIPID_DE_NOVO_BIOSYNTHESIS | Genes involved in Sphingolipid de novo biosynthesis |
| 0.1 | 0.7 | REACTOME_REGULATION_OF_RHEB_GTPASE_ACTIVITY_BY_AMPK | Genes involved in Regulation of Rheb GTPase activity by AMPK |
| 0.0 | 0.3 | REACTOME_THE_NLRP3_INFLAMMASOME | Genes involved in The NLRP3 inflammasome |
| 0.0 | 0.2 | REACTOME_INHIBITION_OF_INSULIN_SECRETION_BY_ADRENALINE_NORADRENALINE | Genes involved in Inhibition of Insulin Secretion by Adrenaline/Noradrenaline |
| 0.0 | 0.4 | REACTOME_RECRUITMENT_OF_NUMA_TO_MITOTIC_CENTROSOMES | Genes involved in Recruitment of NuMA to mitotic centrosomes |
| 0.0 | 0.9 | REACTOME_YAP1_AND_WWTR1_TAZ_STIMULATED_GENE_EXPRESSION | Genes involved in YAP1- and WWTR1 (TAZ)-stimulated gene expression |
| 0.0 | 0.4 | REACTOME_P130CAS_LINKAGE_TO_MAPK_SIGNALING_FOR_INTEGRINS | Genes involved in p130Cas linkage to MAPK signaling for integrins |
| 0.0 | 1.2 | REACTOME_ACTIVATION_OF_ATR_IN_RESPONSE_TO_REPLICATION_STRESS | Genes involved in Activation of ATR in response to replication stress |
| 0.0 | 0.8 | REACTOME_KINESINS | Genes involved in Kinesins |
| 0.0 | 0.4 | REACTOME_METABOLISM_OF_POLYAMINES | Genes involved in Metabolism of polyamines |
| 0.0 | 0.6 | REACTOME_PTM_GAMMA_CARBOXYLATION_HYPUSINE_FORMATION_AND_ARYLSULFATASE_ACTIVATION | Genes involved in PTM: gamma carboxylation, hypusine formation and arylsulfatase activation |
| 0.0 | 0.6 | REACTOME_SYNTHESIS_OF_VERY_LONG_CHAIN_FATTY_ACYL_COAS | Genes involved in Synthesis of very long-chain fatty acyl-CoAs |
| 0.0 | 2.1 | REACTOME_TRANSPORT_OF_INORGANIC_CATIONS_ANIONS_AND_AMINO_ACIDS_OLIGOPEPTIDES | Genes involved in Transport of inorganic cations/anions and amino acids/oligopeptides |
| 0.0 | 0.3 | REACTOME_HOMOLOGOUS_RECOMBINATION_REPAIR_OF_REPLICATION_INDEPENDENT_DOUBLE_STRAND_BREAKS | Genes involved in Homologous recombination repair of replication-independent double-strand breaks |
| 0.0 | 0.3 | REACTOME_GLUTAMATE_NEUROTRANSMITTER_RELEASE_CYCLE | Genes involved in Glutamate Neurotransmitter Release Cycle |
| 0.0 | 0.3 | REACTOME_MITOCHONDRIAL_FATTY_ACID_BETA_OXIDATION | Genes involved in Mitochondrial Fatty Acid Beta-Oxidation |
| 0.0 | 0.2 | REACTOME_G1_S_SPECIFIC_TRANSCRIPTION | Genes involved in G1/S-Specific Transcription |
| 0.0 | 0.7 | REACTOME_INTERACTIONS_OF_VPR_WITH_HOST_CELLULAR_PROTEINS | Genes involved in Interactions of Vpr with host cellular proteins |
| 0.0 | 1.2 | REACTOME_PEPTIDE_LIGAND_BINDING_RECEPTORS | Genes involved in Peptide ligand-binding receptors |
| 0.0 | 0.2 | REACTOME_VEGF_LIGAND_RECEPTOR_INTERACTIONS | Genes involved in VEGF ligand-receptor interactions |
| 0.0 | 0.6 | REACTOME_PLC_BETA_MEDIATED_EVENTS | Genes involved in PLC beta mediated events |
| 0.0 | 0.5 | REACTOME_INTERACTION_BETWEEN_L1_AND_ANKYRINS | Genes involved in Interaction between L1 and Ankyrins |
| 0.0 | 2.2 | REACTOME_SIGNALING_BY_RHO_GTPASES | Genes involved in Signaling by Rho GTPases |
| 0.0 | 0.3 | REACTOME_METABOLISM_OF_NON_CODING_RNA | Genes involved in Metabolism of non-coding RNA |
| 0.0 | 0.6 | REACTOME_MEIOTIC_RECOMBINATION | Genes involved in Meiotic Recombination |
| 0.0 | 1.5 | REACTOME_PROCESSING_OF_CAPPED_INTRON_CONTAINING_PRE_MRNA | Genes involved in Processing of Capped Intron-Containing Pre-mRNA |
| 0.0 | 0.4 | REACTOME_GLUCONEOGENESIS | Genes involved in Gluconeogenesis |
|
|
|
|