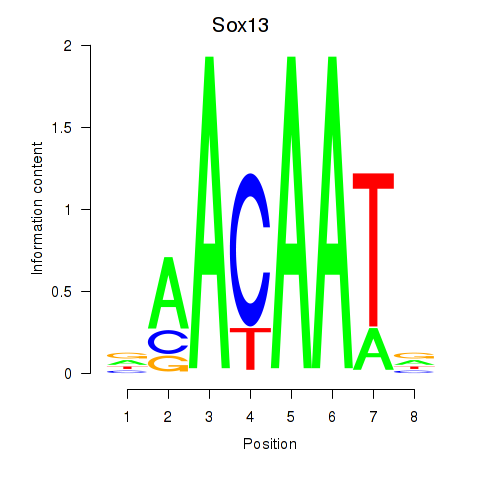
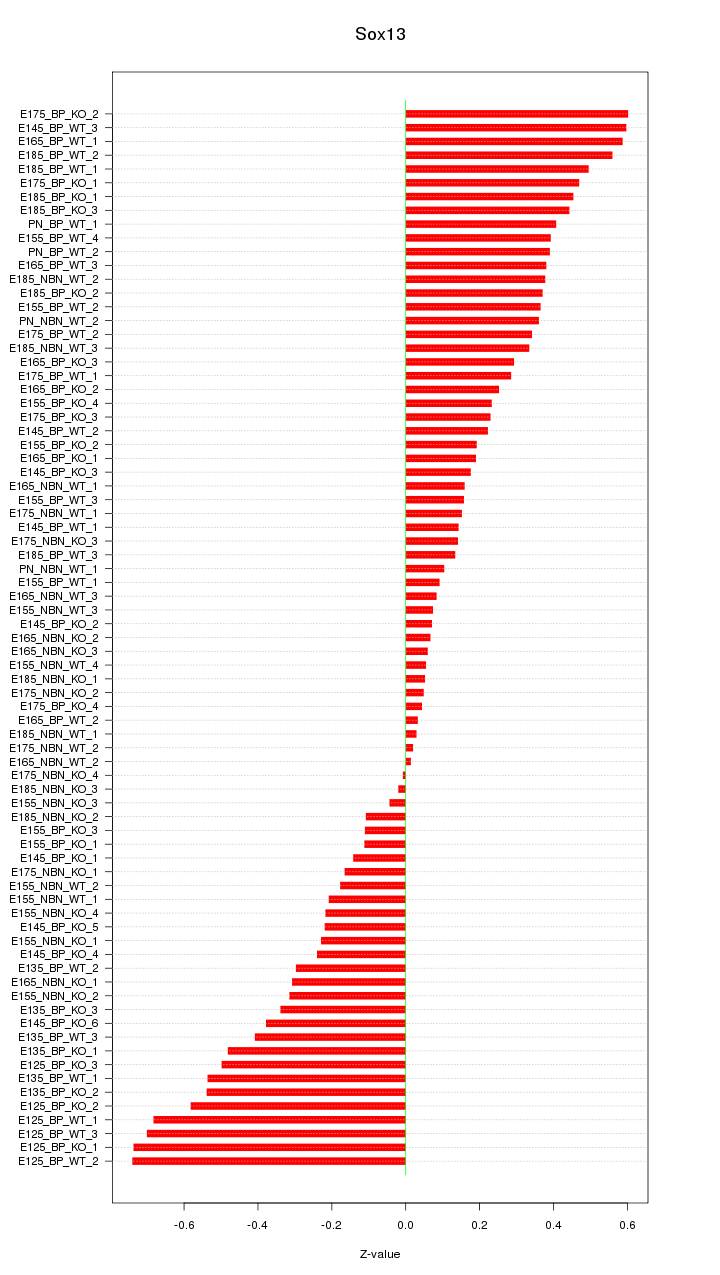
Motif ID: Sox13
Z-value: 0.339
Transcription factors associated with Sox13:
| Gene Symbol | Entrez ID | Gene Name |
|---|---|---|
| Sox13 | ENSMUSG00000070643.5 | Sox13 |
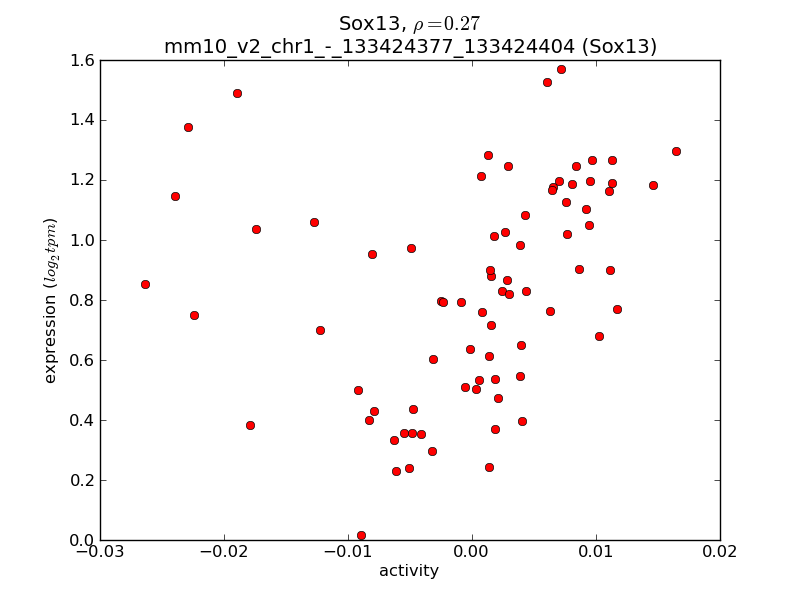
Activity-expression correlation:
| Gene Symbol | Promoter | Pearson corr. coef. | P-value | Plot |
|---|---|---|---|---|
| Sox13 | mm10_v2_chr1_-_133424377_133424404 | 0.27 | 1.6e-02 | Click! |


Top targets:
Gene overrepresentation in biological_process category:
| Log-likelihood per target | Total log-likelihood | Term | Description |
|---|---|---|---|
| 0.9 | 3.6 | GO:0032289 | central nervous system myelin formation(GO:0032289) cardiac cell fate specification(GO:0060912) |
| 0.6 | 1.8 | GO:2000016 | negative regulation of determination of dorsal identity(GO:2000016) |
| 0.4 | 7.7 | GO:0021684 | cerebellar granular layer formation(GO:0021684) cerebellar granule cell differentiation(GO:0021707) |
| 0.3 | 1.1 | GO:1904425 | negative regulation of GTP binding(GO:1904425) |
| 0.2 | 2.3 | GO:0042118 | endothelial cell activation(GO:0042118) |
| 0.2 | 1.0 | GO:2001286 | regulation of caveolin-mediated endocytosis(GO:2001286) |
| 0.2 | 1.3 | GO:0071699 | olfactory placode formation(GO:0030910) olfactory placode development(GO:0071698) olfactory placode morphogenesis(GO:0071699) |
| 0.2 | 1.8 | GO:0002903 | negative regulation of B cell apoptotic process(GO:0002903) |
| 0.2 | 1.9 | GO:0014807 | regulation of somitogenesis(GO:0014807) |
| 0.1 | 0.9 | GO:1904936 | cerebral cortex GABAergic interneuron migration(GO:0021853) interneuron migration(GO:1904936) |
| 0.1 | 0.5 | GO:0003192 | mitral valve formation(GO:0003192) cell migration involved in endocardial cushion formation(GO:0003273) condensed mesenchymal cell proliferation(GO:0072137) |
| 0.1 | 0.3 | GO:0016240 | autophagosome docking(GO:0016240) |
| 0.1 | 4.1 | GO:0030901 | midbrain development(GO:0030901) |
| 0.0 | 0.3 | GO:0005513 | detection of calcium ion(GO:0005513) |
| 0.0 | 0.5 | GO:0022027 | interkinetic nuclear migration(GO:0022027) |
| 0.0 | 1.1 | GO:0035411 | catenin import into nucleus(GO:0035411) |
| 0.0 | 0.3 | GO:0050860 | negative regulation of T cell receptor signaling pathway(GO:0050860) |
| 0.0 | 0.5 | GO:0006625 | protein targeting to peroxisome(GO:0006625) peroxisomal transport(GO:0043574) protein localization to peroxisome(GO:0072662) establishment of protein localization to peroxisome(GO:0072663) |
| 0.0 | 0.3 | GO:1902043 | positive regulation of extrinsic apoptotic signaling pathway via death domain receptors(GO:1902043) |
| 0.0 | 0.5 | GO:0032292 | myelination in peripheral nervous system(GO:0022011) peripheral nervous system axon ensheathment(GO:0032292) |
| 0.0 | 1.0 | GO:0007156 | homophilic cell adhesion via plasma membrane adhesion molecules(GO:0007156) |
| 0.0 | 0.2 | GO:0061179 | negative regulation of insulin secretion involved in cellular response to glucose stimulus(GO:0061179) |
| 0.0 | 0.1 | GO:0072697 | protein localization to cell cortex(GO:0072697) |
Gene overrepresentation in cellular_component category:
| Log-likelihood per target | Total log-likelihood | Term | Description |
|---|---|---|---|
| 0.1 | 0.3 | GO:0097629 | extrinsic component of omegasome membrane(GO:0097629) |
| 0.0 | 8.3 | GO:0005667 | transcription factor complex(GO:0005667) |
| 0.0 | 0.8 | GO:0005871 | kinesin complex(GO:0005871) |
Gene overrepresentation in molecular_function category:
| Log-likelihood per target | Total log-likelihood | Term | Description |
|---|---|---|---|
| 0.6 | 2.3 | GO:0001011 | transcription factor activity, sequence-specific DNA binding, RNA polymerase recruiting(GO:0001011) transcription factor activity, TFIIB-class binding(GO:0001087) |
| 0.3 | 1.8 | GO:0098821 | BMP receptor activity(GO:0098821) |
| 0.1 | 1.0 | GO:0019871 | potassium channel inhibitor activity(GO:0019870) sodium channel inhibitor activity(GO:0019871) |
| 0.1 | 0.4 | GO:0001069 | regulatory region RNA binding(GO:0001069) |
| 0.1 | 1.3 | GO:0035198 | miRNA binding(GO:0035198) |
| 0.0 | 1.8 | GO:0071889 | 14-3-3 protein binding(GO:0071889) |
| 0.0 | 0.2 | GO:0004111 | creatine kinase activity(GO:0004111) |
| 0.0 | 0.3 | GO:0015269 | calcium-activated potassium channel activity(GO:0015269) |
| 0.0 | 8.2 | GO:0001228 | transcriptional activator activity, RNA polymerase II transcription regulatory region sequence-specific binding(GO:0001228) |
| 0.0 | 0.3 | GO:0050136 | NADH dehydrogenase (ubiquinone) activity(GO:0008137) NADH dehydrogenase (quinone) activity(GO:0050136) |
Gene overrepresentation in C2:CP category:
| Log-likelihood per target | Total log-likelihood | Term | Description |
|---|---|---|---|
| 0.0 | 1.8 | PID_EPO_PATHWAY | EPO signaling pathway |
| 0.0 | 1.6 | PID_BMP_PATHWAY | BMP receptor signaling |
| 0.0 | 2.3 | PID_AR_PATHWAY | Coregulation of Androgen receptor activity |
| 0.0 | 1.0 | PID_TGFBR_PATHWAY | TGF-beta receptor signaling |
| 0.0 | 0.3 | PID_IL2_STAT5_PATHWAY | IL2 signaling events mediated by STAT5 |
Gene overrepresentation in C2:CP:REACTOME category:
| Log-likelihood per target | Total log-likelihood | Term | Description |
|---|---|---|---|
| 0.1 | 1.8 | REACTOME_SIGNAL_ATTENUATION | Genes involved in Signal attenuation |
| 0.1 | 2.3 | REACTOME_MYOGENESIS | Genes involved in Myogenesis |
| 0.0 | 0.3 | REACTOME_CGMP_EFFECTS | Genes involved in cGMP effects |