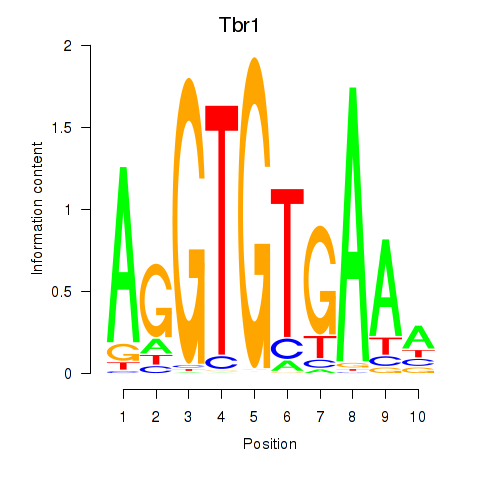
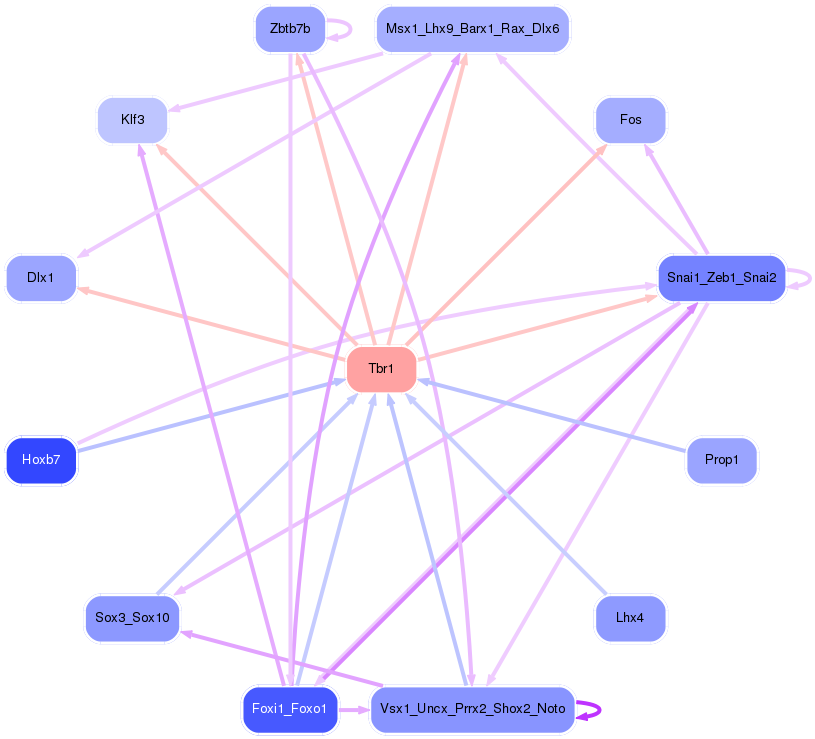
Motif ID: Tbr1
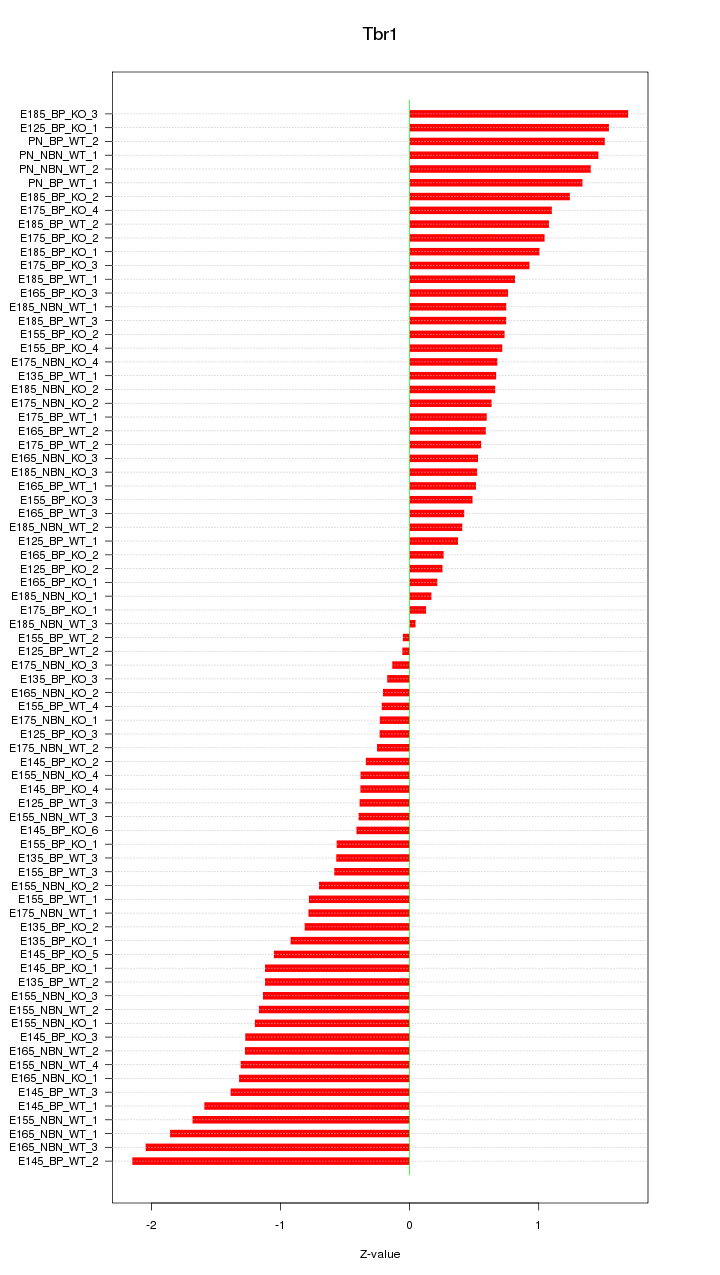
Z-value: 0.937
Transcription factors associated with Tbr1:
| Gene Symbol | Entrez ID | Gene Name |
|---|---|---|
| Tbr1 | ENSMUSG00000035033.9 | Tbr1 |
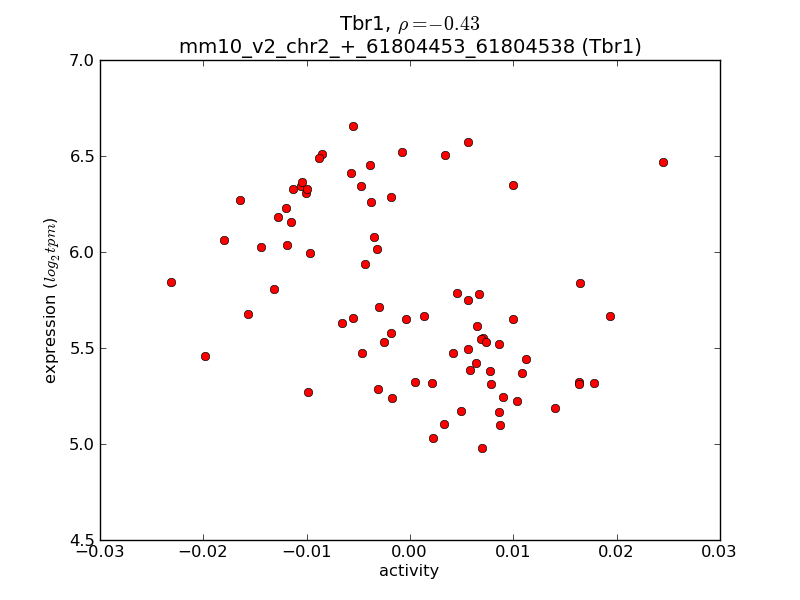
Activity-expression correlation:
| Gene Symbol | Promoter | Pearson corr. coef. | P-value | Plot |
|---|---|---|---|---|
| Tbr1 | mm10_v2_chr2_+_61804453_61804538 | -0.43 | 1.1e-04 | Click! |

Top targets:
Gene overrepresentation in biological_process category:
| Log-likelihood per target | Total log-likelihood | Term | Description |
|---|---|---|---|
| 2.6 | 7.8 | GO:0061075 | cerebral cortex GABAergic interneuron fate commitment(GO:0021893) positive regulation of neural retina development(GO:0061075) positive regulation of retina development in camera-type eye(GO:1902868) positive regulation of amacrine cell differentiation(GO:1902871) |
| 2.3 | 7.0 | GO:0030421 | defecation(GO:0030421) |
| 1.6 | 4.9 | GO:1902256 | endocardial cushion fusion(GO:0003274) apoptotic process involved in outflow tract morphogenesis(GO:0003275) atrial septum primum morphogenesis(GO:0003289) positive regulation of catagen(GO:0051795) regulation of apoptotic process involved in outflow tract morphogenesis(GO:1902256) |
| 1.3 | 3.9 | GO:1903002 | regulation of lipid transport across blood brain barrier(GO:1903000) positive regulation of lipid transport across blood brain barrier(GO:1903002) |
| 1.2 | 7.0 | GO:0032196 | regulation of transposition(GO:0010528) negative regulation of transposition(GO:0010529) transposition(GO:0032196) |
| 0.9 | 4.7 | GO:0002339 | B cell selection(GO:0002339) |
| 0.9 | 3.6 | GO:2000048 | negative regulation of cell-cell adhesion mediated by cadherin(GO:2000048) |
| 0.8 | 3.2 | GO:0001812 | positive regulation of type I hypersensitivity(GO:0001812) |
| 0.8 | 3.9 | GO:0048245 | eosinophil chemotaxis(GO:0048245) |
| 0.7 | 2.2 | GO:0019343 | cysteine biosynthetic process via cystathionine(GO:0019343) cysteine biosynthetic process(GO:0019344) |
| 0.7 | 3.5 | GO:0035262 | gonad morphogenesis(GO:0035262) |
| 0.7 | 3.5 | GO:0002457 | T cell antigen processing and presentation(GO:0002457) |
| 0.7 | 5.6 | GO:1901162 | serotonin biosynthetic process(GO:0042427) primary amino compound biosynthetic process(GO:1901162) |
| 0.7 | 2.0 | GO:0003245 | cardiac muscle tissue growth involved in heart morphogenesis(GO:0003245) |
| 0.7 | 2.6 | GO:0072137 | condensed mesenchymal cell proliferation(GO:0072137) |
| 0.6 | 1.9 | GO:0048821 | erythrocyte development(GO:0048821) |
| 0.6 | 1.9 | GO:0006116 | NADH oxidation(GO:0006116) |
| 0.6 | 1.9 | GO:1905065 | positive regulation of vascular smooth muscle cell differentiation(GO:1905065) |
| 0.6 | 1.8 | GO:0061537 | glycine secretion(GO:0061536) glycine secretion, neurotransmission(GO:0061537) |
| 0.6 | 2.3 | GO:1901894 | regulation of calcium-transporting ATPase activity(GO:1901894) |
| 0.5 | 2.1 | GO:0032788 | saturated monocarboxylic acid metabolic process(GO:0032788) unsaturated monocarboxylic acid metabolic process(GO:0032789) |
| 0.5 | 3.2 | GO:2001204 | regulation of osteoclast development(GO:2001204) |
| 0.5 | 2.1 | GO:0032610 | interleukin-1 alpha production(GO:0032610) |
| 0.5 | 1.6 | GO:0002586 | positive regulation of antigen processing and presentation of peptide or polysaccharide antigen via MHC class II(GO:0002582) regulation of antigen processing and presentation of peptide antigen via MHC class II(GO:0002586) positive regulation of antigen processing and presentation of peptide antigen via MHC class II(GO:0002588) |
| 0.5 | 1.5 | GO:1902714 | negative regulation of interferon-gamma secretion(GO:1902714) |
| 0.5 | 1.5 | GO:0003349 | epicardium-derived cardiac endothelial cell differentiation(GO:0003349) |
| 0.5 | 1.8 | GO:0045054 | constitutive secretory pathway(GO:0045054) |
| 0.4 | 1.8 | GO:0006982 | response to lipid hydroperoxide(GO:0006982) cellular response to lipid hydroperoxide(GO:0071449) |
| 0.4 | 1.3 | GO:0035621 | ER to Golgi ceramide transport(GO:0035621) ceramide transport(GO:0035627) |
| 0.4 | 1.3 | GO:0090526 | regulation of gluconeogenesis involved in cellular glucose homeostasis(GO:0090526) |
| 0.4 | 1.2 | GO:2000851 | corticosterone secretion(GO:0035934) positive regulation of glucocorticoid secretion(GO:2000851) regulation of corticosterone secretion(GO:2000852) |
| 0.4 | 2.0 | GO:0015871 | choline transport(GO:0015871) |
| 0.4 | 1.2 | GO:1900673 | olefin metabolic process(GO:1900673) |
| 0.4 | 1.2 | GO:1903984 | positive regulation of TRAIL-activated apoptotic signaling pathway(GO:1903984) |
| 0.4 | 5.9 | GO:0035994 | response to muscle stretch(GO:0035994) |
| 0.4 | 2.3 | GO:2001185 | regulation of CD8-positive, alpha-beta T cell activation(GO:2001185) |
| 0.4 | 2.2 | GO:2000483 | negative regulation of interleukin-8 secretion(GO:2000483) |
| 0.4 | 1.8 | GO:2000504 | positive regulation of blood vessel remodeling(GO:2000504) |
| 0.4 | 1.8 | GO:0080184 | response to stilbenoid(GO:0035634) response to phenylpropanoid(GO:0080184) |
| 0.4 | 1.1 | GO:0097026 | dendritic cell dendrite assembly(GO:0097026) |
| 0.4 | 5.7 | GO:0060134 | prepulse inhibition(GO:0060134) |
| 0.4 | 1.1 | GO:0038165 | oncostatin-M-mediated signaling pathway(GO:0038165) regulation of interleukin-6-mediated signaling pathway(GO:0070103) negative regulation of interleukin-6-mediated signaling pathway(GO:0070104) |
| 0.4 | 2.8 | GO:0090336 | positive regulation of brown fat cell differentiation(GO:0090336) |
| 0.3 | 1.7 | GO:0001561 | fatty acid alpha-oxidation(GO:0001561) |
| 0.3 | 1.4 | GO:0060282 | positive regulation of oocyte development(GO:0060282) |
| 0.3 | 3.0 | GO:0048752 | semicircular canal morphogenesis(GO:0048752) |
| 0.3 | 1.0 | GO:0050859 | negative regulation of B cell receptor signaling pathway(GO:0050859) |
| 0.3 | 0.9 | GO:2000501 | natural killer cell chemotaxis(GO:0035747) regulation of natural killer cell chemotaxis(GO:2000501) |
| 0.3 | 2.1 | GO:0043504 | mitochondrial DNA repair(GO:0043504) |
| 0.3 | 1.2 | GO:0061010 | gall bladder development(GO:0061010) |
| 0.3 | 1.2 | GO:0071726 | response to diacyl bacterial lipopeptide(GO:0071724) cellular response to diacyl bacterial lipopeptide(GO:0071726) |
| 0.3 | 3.3 | GO:0010447 | response to acidic pH(GO:0010447) |
| 0.3 | 0.8 | GO:0030862 | neuroblast division in subventricular zone(GO:0021849) positive regulation of polarized epithelial cell differentiation(GO:0030862) |
| 0.3 | 2.1 | GO:0035372 | protein localization to microtubule(GO:0035372) |
| 0.3 | 0.8 | GO:0007521 | muscle cell fate determination(GO:0007521) mammary placode formation(GO:0060596) |
| 0.3 | 1.8 | GO:0044130 | negative regulation of growth of symbiont in host(GO:0044130) negative regulation of growth of symbiont involved in interaction with host(GO:0044146) |
| 0.3 | 1.3 | GO:1900170 | negative regulation of glucocorticoid mediated signaling pathway(GO:1900170) |
| 0.3 | 1.0 | GO:0072531 | pyrimidine-containing compound transmembrane transport(GO:0072531) |
| 0.3 | 2.6 | GO:0015838 | amino-acid betaine transport(GO:0015838) |
| 0.3 | 0.8 | GO:0045014 | detection of carbohydrate stimulus(GO:0009730) detection of hexose stimulus(GO:0009732) detection of monosaccharide stimulus(GO:0034287) carbon catabolite repression of transcription(GO:0045013) negative regulation of transcription by glucose(GO:0045014) detection of glucose(GO:0051594) |
| 0.3 | 0.8 | GO:0002430 | complement receptor mediated signaling pathway(GO:0002430) |
| 0.3 | 1.0 | GO:0030091 | protein repair(GO:0030091) |
| 0.2 | 2.0 | GO:0015670 | carbon dioxide transport(GO:0015670) |
| 0.2 | 1.2 | GO:0051987 | positive regulation of attachment of spindle microtubules to kinetochore(GO:0051987) |
| 0.2 | 1.0 | GO:1903998 | regulation of eating behavior(GO:1903998) |
| 0.2 | 1.4 | GO:2000271 | positive regulation of fibroblast apoptotic process(GO:2000271) |
| 0.2 | 2.5 | GO:0042428 | serotonin metabolic process(GO:0042428) |
| 0.2 | 0.7 | GO:0015793 | glycerol transport(GO:0015793) renal water absorption(GO:0070295) |
| 0.2 | 0.7 | GO:0052151 | positive regulation by symbiont of host apoptotic process(GO:0052151) positive regulation of apoptotic process by virus(GO:0060139) positive regulation of intrinsic apoptotic signaling pathway in response to osmotic stress(GO:1902220) |
| 0.2 | 0.7 | GO:0015882 | L-ascorbic acid transport(GO:0015882) transepithelial L-ascorbic acid transport(GO:0070904) |
| 0.2 | 1.3 | GO:0015074 | DNA integration(GO:0015074) |
| 0.2 | 1.3 | GO:0050861 | positive regulation of B cell receptor signaling pathway(GO:0050861) |
| 0.2 | 1.1 | GO:0045213 | neurotransmitter receptor metabolic process(GO:0045213) |
| 0.2 | 1.3 | GO:0002317 | plasma cell differentiation(GO:0002317) |
| 0.2 | 1.8 | GO:0048625 | myoblast fate commitment(GO:0048625) |
| 0.2 | 0.9 | GO:2000383 | regulation of ectoderm development(GO:2000383) negative regulation of ectoderm development(GO:2000384) |
| 0.2 | 1.1 | GO:2001032 | regulation of double-strand break repair via nonhomologous end joining(GO:2001032) |
| 0.2 | 0.4 | GO:0043985 | histone H4-R3 methylation(GO:0043985) |
| 0.2 | 1.7 | GO:0040031 | snRNA modification(GO:0040031) |
| 0.2 | 1.4 | GO:0045654 | positive regulation of megakaryocyte differentiation(GO:0045654) |
| 0.2 | 1.0 | GO:1903215 | negative regulation of protein targeting to mitochondrion(GO:1903215) |
| 0.2 | 2.0 | GO:0051256 | mitotic spindle midzone assembly(GO:0051256) |
| 0.2 | 1.0 | GO:0035948 | positive regulation of gluconeogenesis by positive regulation of transcription from RNA polymerase II promoter(GO:0035948) regulation of cellular ketone metabolic process by positive regulation of transcription from RNA polymerase II promoter(GO:0072366) |
| 0.2 | 1.6 | GO:0043951 | negative regulation of cAMP-mediated signaling(GO:0043951) |
| 0.2 | 0.8 | GO:0006041 | glucosamine metabolic process(GO:0006041) |
| 0.2 | 1.8 | GO:2000194 | regulation of female gonad development(GO:2000194) |
| 0.2 | 1.0 | GO:0030240 | skeletal muscle thin filament assembly(GO:0030240) |
| 0.2 | 0.8 | GO:0051725 | protein de-ADP-ribosylation(GO:0051725) |
| 0.2 | 0.6 | GO:2000016 | negative regulation of determination of dorsal identity(GO:2000016) |
| 0.2 | 0.4 | GO:0003308 | negative regulation of Wnt signaling pathway involved in heart development(GO:0003308) |
| 0.2 | 6.0 | GO:0035335 | peptidyl-tyrosine dephosphorylation(GO:0035335) |
| 0.2 | 1.5 | GO:0009181 | purine nucleoside diphosphate catabolic process(GO:0009137) purine ribonucleoside diphosphate catabolic process(GO:0009181) |
| 0.2 | 0.6 | GO:2000256 | thrombopoietin-mediated signaling pathway(GO:0038163) positive regulation of male germ cell proliferation(GO:2000256) |
| 0.2 | 1.7 | GO:0006833 | water transport(GO:0006833) |
| 0.2 | 0.7 | GO:0048633 | positive regulation of skeletal muscle tissue growth(GO:0048633) |
| 0.2 | 1.2 | GO:0034316 | negative regulation of Arp2/3 complex-mediated actin nucleation(GO:0034316) |
| 0.2 | 1.0 | GO:2000741 | positive regulation of mesenchymal stem cell differentiation(GO:2000741) |
| 0.2 | 0.5 | GO:0043553 | negative regulation of phosphatidylinositol 3-kinase activity(GO:0043553) |
| 0.2 | 4.0 | GO:0032757 | positive regulation of interleukin-8 production(GO:0032757) |
| 0.2 | 0.5 | GO:0046110 | xanthine metabolic process(GO:0046110) |
| 0.2 | 2.6 | GO:0045647 | negative regulation of erythrocyte differentiation(GO:0045647) |
| 0.2 | 1.1 | GO:0070458 | detoxification of nitrogen compound(GO:0051410) cellular detoxification of nitrogen compound(GO:0070458) |
| 0.2 | 0.5 | GO:0006933 | negative regulation of cell adhesion involved in substrate-bound cell migration(GO:0006933) |
| 0.2 | 4.5 | GO:0045736 | negative regulation of cyclin-dependent protein serine/threonine kinase activity(GO:0045736) negative regulation of cyclin-dependent protein kinase activity(GO:1904030) |
| 0.2 | 0.6 | GO:0007386 | compartment pattern specification(GO:0007386) |
| 0.2 | 0.6 | GO:0010700 | negative regulation of norepinephrine secretion(GO:0010700) |
| 0.2 | 0.8 | GO:0045605 | negative regulation of epidermal cell differentiation(GO:0045605) |
| 0.2 | 0.5 | GO:0071921 | establishment of sister chromatid cohesion(GO:0034085) cohesin loading(GO:0071921) regulation of cohesin loading(GO:0071922) |
| 0.2 | 0.3 | GO:0060672 | epithelial cell differentiation involved in embryonic placenta development(GO:0060671) epithelial cell morphogenesis involved in placental branching(GO:0060672) |
| 0.1 | 1.9 | GO:0043252 | sodium-independent organic anion transport(GO:0043252) |
| 0.1 | 0.9 | GO:0006172 | ADP biosynthetic process(GO:0006172) |
| 0.1 | 1.0 | GO:0035735 | intraciliary transport involved in cilium morphogenesis(GO:0035735) |
| 0.1 | 0.9 | GO:0097473 | cellular response to light intensity(GO:0071484) cellular response to high light intensity(GO:0071486) retinal rod cell apoptotic process(GO:0097473) |
| 0.1 | 0.6 | GO:0002143 | tRNA wobble position uridine thiolation(GO:0002143) |
| 0.1 | 0.4 | GO:1903070 | negative regulation of ER-associated ubiquitin-dependent protein catabolic process(GO:1903070) |
| 0.1 | 0.4 | GO:0015866 | ADP transport(GO:0015866) |
| 0.1 | 0.8 | GO:1904715 | negative regulation of chaperone-mediated autophagy(GO:1904715) |
| 0.1 | 0.9 | GO:0070779 | D-aspartate transport(GO:0070777) D-aspartate import(GO:0070779) |
| 0.1 | 0.9 | GO:0006297 | nucleotide-excision repair, DNA gap filling(GO:0006297) |
| 0.1 | 0.5 | GO:0006668 | sphinganine-1-phosphate metabolic process(GO:0006668) |
| 0.1 | 2.1 | GO:2000096 | positive regulation of Wnt signaling pathway, planar cell polarity pathway(GO:2000096) |
| 0.1 | 0.4 | GO:1902528 | regulation of protein linear polyubiquitination(GO:1902528) positive regulation of protein linear polyubiquitination(GO:1902530) |
| 0.1 | 0.8 | GO:0010748 | negative regulation of plasma membrane long-chain fatty acid transport(GO:0010748) positive regulation of fatty acid beta-oxidation(GO:0032000) |
| 0.1 | 0.9 | GO:0060999 | positive regulation of dendritic spine development(GO:0060999) |
| 0.1 | 5.4 | GO:0035411 | catenin import into nucleus(GO:0035411) |
| 0.1 | 0.6 | GO:0071267 | amino acid salvage(GO:0043102) L-methionine biosynthetic process(GO:0071265) L-methionine salvage(GO:0071267) |
| 0.1 | 1.1 | GO:0050858 | negative regulation of antigen receptor-mediated signaling pathway(GO:0050858) negative regulation of T cell receptor signaling pathway(GO:0050860) |
| 0.1 | 1.0 | GO:0044791 | modulation by host of viral release from host cell(GO:0044789) positive regulation by host of viral release from host cell(GO:0044791) |
| 0.1 | 1.4 | GO:0043589 | skin morphogenesis(GO:0043589) |
| 0.1 | 0.4 | GO:1904020 | regulation of G-protein coupled receptor internalization(GO:1904020) |
| 0.1 | 0.4 | GO:0003278 | apoptotic process involved in heart morphogenesis(GO:0003278) |
| 0.1 | 0.4 | GO:0044028 | DNA hypomethylation(GO:0044028) hypomethylation of CpG island(GO:0044029) |
| 0.1 | 0.7 | GO:0045218 | zonula adherens maintenance(GO:0045218) |
| 0.1 | 0.2 | GO:1900747 | negative regulation of vascular endothelial growth factor signaling pathway(GO:1900747) |
| 0.1 | 1.1 | GO:2000786 | positive regulation of autophagosome assembly(GO:2000786) |
| 0.1 | 0.4 | GO:0050747 | positive regulation of lipoprotein metabolic process(GO:0050747) |
| 0.1 | 0.1 | GO:2000095 | regulation of Wnt signaling pathway, planar cell polarity pathway(GO:2000095) |
| 0.1 | 0.3 | GO:1904504 | regulation of lipophagy(GO:1904502) positive regulation of lipophagy(GO:1904504) |
| 0.1 | 0.4 | GO:0042693 | muscle cell fate commitment(GO:0042693) |
| 0.1 | 0.3 | GO:0006556 | S-adenosylmethionine biosynthetic process(GO:0006556) |
| 0.1 | 0.4 | GO:0015744 | succinate transport(GO:0015744) |
| 0.1 | 0.3 | GO:0035526 | retrograde transport, plasma membrane to Golgi(GO:0035526) |
| 0.1 | 0.2 | GO:0002423 | natural killer cell mediated cytotoxicity directed against tumor cell target(GO:0002420) natural killer cell mediated immune response to tumor cell(GO:0002423) regulation of natural killer cell mediated immune response to tumor cell(GO:0002855) regulation of natural killer cell mediated cytotoxicity directed against tumor cell target(GO:0002858) |
| 0.1 | 0.7 | GO:0035331 | negative regulation of hippo signaling(GO:0035331) |
| 0.1 | 0.3 | GO:2000569 | T-helper 2 cell activation(GO:0035712) regulation of T-helper 2 cell activation(GO:2000569) positive regulation of T-helper 2 cell activation(GO:2000570) |
| 0.1 | 1.4 | GO:0055059 | asymmetric neuroblast division(GO:0055059) |
| 0.1 | 1.2 | GO:0002385 | mucosal immune response(GO:0002385) |
| 0.1 | 1.4 | GO:0006953 | acute-phase response(GO:0006953) |
| 0.1 | 2.1 | GO:2000001 | regulation of DNA damage checkpoint(GO:2000001) |
| 0.1 | 0.6 | GO:0010572 | positive regulation of platelet activation(GO:0010572) |
| 0.1 | 0.6 | GO:0044331 | cell-cell adhesion mediated by cadherin(GO:0044331) |
| 0.1 | 0.5 | GO:1903232 | melanosome assembly(GO:1903232) |
| 0.1 | 0.4 | GO:0006121 | mitochondrial electron transport, succinate to ubiquinone(GO:0006121) |
| 0.1 | 4.3 | GO:0046676 | negative regulation of insulin secretion(GO:0046676) |
| 0.1 | 0.4 | GO:0045947 | negative regulation of translational initiation(GO:0045947) |
| 0.1 | 1.3 | GO:0021891 | olfactory bulb interneuron development(GO:0021891) |
| 0.1 | 0.7 | GO:0036506 | maintenance of unfolded protein(GO:0036506) tail-anchored membrane protein insertion into ER membrane(GO:0071816) maintenance of unfolded protein involved in ERAD pathway(GO:1904378) |
| 0.1 | 0.3 | GO:0043686 | co-translational protein modification(GO:0043686) |
| 0.1 | 4.4 | GO:0043666 | regulation of phosphoprotein phosphatase activity(GO:0043666) |
| 0.1 | 1.3 | GO:0032464 | positive regulation of protein homooligomerization(GO:0032464) |
| 0.1 | 0.5 | GO:0051684 | maintenance of Golgi location(GO:0051684) |
| 0.1 | 0.3 | GO:0010730 | negative regulation of hydrogen peroxide metabolic process(GO:0010727) negative regulation of hydrogen peroxide biosynthetic process(GO:0010730) |
| 0.1 | 1.0 | GO:0007220 | Notch receptor processing(GO:0007220) |
| 0.1 | 0.5 | GO:0000707 | meiotic DNA recombinase assembly(GO:0000707) |
| 0.1 | 2.9 | GO:0070306 | lens fiber cell differentiation(GO:0070306) |
| 0.1 | 0.3 | GO:0006478 | peptidyl-tyrosine sulfation(GO:0006478) |
| 0.1 | 1.3 | GO:0010457 | centriole-centriole cohesion(GO:0010457) |
| 0.1 | 1.0 | GO:0051574 | positive regulation of histone H3-K9 methylation(GO:0051574) |
| 0.1 | 0.7 | GO:0043402 | glucocorticoid mediated signaling pathway(GO:0043402) |
| 0.1 | 0.8 | GO:0043011 | myeloid dendritic cell differentiation(GO:0043011) |
| 0.1 | 2.2 | GO:0018345 | protein palmitoylation(GO:0018345) |
| 0.1 | 1.8 | GO:0071108 | protein K48-linked deubiquitination(GO:0071108) |
| 0.1 | 0.2 | GO:0071638 | negative regulation of monocyte chemotactic protein-1 production(GO:0071638) |
| 0.1 | 0.5 | GO:0034773 | histone H4-K20 trimethylation(GO:0034773) |
| 0.1 | 0.2 | GO:0010940 | positive regulation of necrotic cell death(GO:0010940) |
| 0.1 | 0.1 | GO:0036015 | response to interleukin-3(GO:0036015) cellular response to interleukin-3(GO:0036016) |
| 0.1 | 0.4 | GO:0006307 | DNA dealkylation involved in DNA repair(GO:0006307) |
| 0.1 | 0.8 | GO:0007175 | negative regulation of epidermal growth factor-activated receptor activity(GO:0007175) |
| 0.1 | 0.4 | GO:0042276 | error-prone translesion synthesis(GO:0042276) |
| 0.1 | 1.0 | GO:0002495 | antigen processing and presentation of peptide antigen via MHC class II(GO:0002495) antigen processing and presentation of peptide or polysaccharide antigen via MHC class II(GO:0002504) |
| 0.1 | 1.2 | GO:0050691 | regulation of defense response to virus by host(GO:0050691) |
| 0.1 | 1.8 | GO:0050873 | brown fat cell differentiation(GO:0050873) |
| 0.1 | 0.1 | GO:0048312 | intracellular distribution of mitochondria(GO:0048312) |
| 0.1 | 2.8 | GO:0045599 | negative regulation of fat cell differentiation(GO:0045599) |
| 0.1 | 0.5 | GO:0032693 | negative regulation of interleukin-10 production(GO:0032693) |
| 0.1 | 0.2 | GO:1904395 | retinal rod cell differentiation(GO:0060221) positive regulation of skeletal muscle acetylcholine-gated channel clustering(GO:1904395) positive regulation of neuromuscular junction development(GO:1904398) |
| 0.1 | 2.6 | GO:0050709 | negative regulation of protein secretion(GO:0050709) |
| 0.1 | 0.4 | GO:0002315 | marginal zone B cell differentiation(GO:0002315) |
| 0.1 | 1.8 | GO:0070232 | regulation of T cell apoptotic process(GO:0070232) |
| 0.1 | 0.3 | GO:0060903 | positive regulation of meiosis I(GO:0060903) |
| 0.1 | 0.2 | GO:0032474 | otolith morphogenesis(GO:0032474) |
| 0.1 | 0.4 | GO:0035562 | negative regulation of chromatin binding(GO:0035562) |
| 0.1 | 1.0 | GO:0070584 | mitochondrion morphogenesis(GO:0070584) |
| 0.1 | 0.2 | GO:0006049 | UDP-N-acetylglucosamine catabolic process(GO:0006049) |
| 0.1 | 0.4 | GO:0006446 | regulation of translational initiation(GO:0006446) |
| 0.1 | 0.9 | GO:1904262 | negative regulation of TORC1 signaling(GO:1904262) |
| 0.1 | 1.7 | GO:0009409 | response to cold(GO:0009409) |
| 0.1 | 1.1 | GO:0006767 | water-soluble vitamin metabolic process(GO:0006767) |
| 0.1 | 0.2 | GO:0071688 | striated muscle myosin thick filament assembly(GO:0071688) |
| 0.1 | 0.5 | GO:0035269 | protein O-linked mannosylation(GO:0035269) |
| 0.1 | 0.2 | GO:0048209 | regulation of vesicle targeting, to, from or within Golgi(GO:0048209) |
| 0.1 | 0.7 | GO:0008272 | sulfate transport(GO:0008272) |
| 0.1 | 0.2 | GO:0006564 | L-serine biosynthetic process(GO:0006564) |
| 0.1 | 0.3 | GO:0006686 | sphingomyelin biosynthetic process(GO:0006686) |
| 0.1 | 0.1 | GO:0071351 | interleukin-18-mediated signaling pathway(GO:0035655) cellular response to interleukin-18(GO:0071351) |
| 0.1 | 0.2 | GO:0015788 | UDP-N-acetylglucosamine transport(GO:0015788) |
| 0.1 | 0.6 | GO:0043568 | positive regulation of insulin-like growth factor receptor signaling pathway(GO:0043568) |
| 0.1 | 1.4 | GO:0043123 | positive regulation of I-kappaB kinase/NF-kappaB signaling(GO:0043123) |
| 0.1 | 0.2 | GO:0032497 | detection of molecule of bacterial origin(GO:0032490) detection of lipopolysaccharide(GO:0032497) |
| 0.1 | 0.4 | GO:0006544 | glycine metabolic process(GO:0006544) |
| 0.1 | 0.3 | GO:0019585 | uronic acid metabolic process(GO:0006063) glucuronate metabolic process(GO:0019585) cellular glucuronidation(GO:0052695) |
| 0.1 | 0.5 | GO:1903818 | positive regulation of voltage-gated potassium channel activity(GO:1903818) |
| 0.1 | 0.4 | GO:0032534 | regulation of microvillus assembly(GO:0032534) |
| 0.1 | 0.6 | GO:0007250 | activation of NF-kappaB-inducing kinase activity(GO:0007250) |
| 0.1 | 0.6 | GO:0072112 | renal filtration cell differentiation(GO:0061318) glomerular visceral epithelial cell differentiation(GO:0072112) glomerular epithelial cell differentiation(GO:0072311) |
| 0.1 | 0.6 | GO:0048643 | positive regulation of skeletal muscle tissue development(GO:0048643) |
| 0.1 | 0.3 | GO:0034379 | very-low-density lipoprotein particle assembly(GO:0034379) |
| 0.1 | 0.2 | GO:0018094 | protein polyglycylation(GO:0018094) |
| 0.1 | 0.7 | GO:0010758 | regulation of macrophage chemotaxis(GO:0010758) |
| 0.1 | 0.4 | GO:0015868 | purine ribonucleotide transport(GO:0015868) |
| 0.1 | 1.0 | GO:0021860 | pyramidal neuron development(GO:0021860) |
| 0.0 | 2.3 | GO:0042771 | intrinsic apoptotic signaling pathway in response to DNA damage by p53 class mediator(GO:0042771) |
| 0.0 | 0.2 | GO:0036353 | histone H2A-K119 monoubiquitination(GO:0036353) |
| 0.0 | 0.5 | GO:0035970 | peptidyl-threonine dephosphorylation(GO:0035970) |
| 0.0 | 0.3 | GO:0002523 | leukocyte migration involved in inflammatory response(GO:0002523) |
| 0.0 | 0.4 | GO:0009072 | aromatic amino acid family metabolic process(GO:0009072) |
| 0.0 | 0.2 | GO:0046684 | response to pyrethroid(GO:0046684) |
| 0.0 | 0.4 | GO:0051894 | positive regulation of focal adhesion assembly(GO:0051894) |
| 0.0 | 0.2 | GO:0046512 | sphingosine biosynthetic process(GO:0046512) sphingoid biosynthetic process(GO:0046520) |
| 0.0 | 0.4 | GO:0014883 | transition between fast and slow fiber(GO:0014883) |
| 0.0 | 0.8 | GO:0034453 | microtubule anchoring(GO:0034453) |
| 0.0 | 0.2 | GO:0045835 | negative regulation of meiotic nuclear division(GO:0045835) |
| 0.0 | 1.1 | GO:0060441 | epithelial tube branching involved in lung morphogenesis(GO:0060441) |
| 0.0 | 0.3 | GO:0072189 | ureter development(GO:0072189) |
| 0.0 | 1.5 | GO:0021591 | ventricular system development(GO:0021591) |
| 0.0 | 1.3 | GO:1900026 | positive regulation of substrate adhesion-dependent cell spreading(GO:1900026) |
| 0.0 | 0.2 | GO:1900116 | sequestering of extracellular ligand from receptor(GO:0035581) extracellular regulation of signal transduction(GO:1900115) extracellular negative regulation of signal transduction(GO:1900116) |
| 0.0 | 0.2 | GO:0043569 | negative regulation of insulin-like growth factor receptor signaling pathway(GO:0043569) |
| 0.0 | 1.4 | GO:0001919 | regulation of receptor recycling(GO:0001919) |
| 0.0 | 0.1 | GO:0001951 | intestinal D-glucose absorption(GO:0001951) terminal web assembly(GO:1902896) |
| 0.0 | 0.2 | GO:0060693 | regulation of branching involved in salivary gland morphogenesis(GO:0060693) |
| 0.0 | 1.0 | GO:1900047 | negative regulation of blood coagulation(GO:0030195) negative regulation of hemostasis(GO:1900047) |
| 0.0 | 0.4 | GO:0060055 | angiogenesis involved in wound healing(GO:0060055) |
| 0.0 | 0.1 | GO:0035963 | response to interleukin-13(GO:0035962) cellular response to interleukin-13(GO:0035963) |
| 0.0 | 0.6 | GO:0050832 | defense response to fungus(GO:0050832) |
| 0.0 | 0.1 | GO:0032286 | central nervous system myelin maintenance(GO:0032286) |
| 0.0 | 0.1 | GO:0072675 | osteoclast fusion(GO:0072675) |
| 0.0 | 0.1 | GO:0070814 | hydrogen sulfide biosynthetic process(GO:0070814) |
| 0.0 | 1.5 | GO:0045744 | negative regulation of G-protein coupled receptor protein signaling pathway(GO:0045744) |
| 0.0 | 0.7 | GO:0010829 | negative regulation of glucose transport(GO:0010829) negative regulation of glucose import(GO:0046325) |
| 0.0 | 0.3 | GO:0007602 | phototransduction(GO:0007602) |
| 0.0 | 0.6 | GO:1900153 | regulation of nuclear-transcribed mRNA catabolic process, deadenylation-dependent decay(GO:1900151) positive regulation of nuclear-transcribed mRNA catabolic process, deadenylation-dependent decay(GO:1900153) |
| 0.0 | 0.1 | GO:0002002 | regulation of angiotensin levels in blood(GO:0002002) regulation of angiotensin metabolic process(GO:0060177) |
| 0.0 | 0.1 | GO:0046598 | positive regulation of viral entry into host cell(GO:0046598) |
| 0.0 | 0.1 | GO:0045204 | MAPK export from nucleus(GO:0045204) |
| 0.0 | 0.4 | GO:0048387 | negative regulation of retinoic acid receptor signaling pathway(GO:0048387) |
| 0.0 | 0.9 | GO:0015985 | energy coupled proton transport, down electrochemical gradient(GO:0015985) ATP synthesis coupled proton transport(GO:0015986) |
| 0.0 | 1.7 | GO:0006635 | fatty acid beta-oxidation(GO:0006635) |
| 0.0 | 0.2 | GO:0051013 | microtubule severing(GO:0051013) |
| 0.0 | 0.3 | GO:0042573 | retinoic acid metabolic process(GO:0042573) |
| 0.0 | 1.2 | GO:0006779 | porphyrin-containing compound biosynthetic process(GO:0006779) tetrapyrrole biosynthetic process(GO:0033014) |
| 0.0 | 0.3 | GO:0042178 | xenobiotic catabolic process(GO:0042178) |
| 0.0 | 0.1 | GO:0006384 | transcription initiation from RNA polymerase III promoter(GO:0006384) |
| 0.0 | 0.6 | GO:0042219 | cellular modified amino acid catabolic process(GO:0042219) |
| 0.0 | 0.2 | GO:0006551 | leucine metabolic process(GO:0006551) |
| 0.0 | 0.2 | GO:0006621 | protein retention in ER lumen(GO:0006621) |
| 0.0 | 0.1 | GO:0032429 | regulation of phospholipase A2 activity(GO:0032429) |
| 0.0 | 0.2 | GO:0006561 | proline biosynthetic process(GO:0006561) |
| 0.0 | 0.4 | GO:0030574 | collagen catabolic process(GO:0030574) |
| 0.0 | 1.7 | GO:0030032 | lamellipodium assembly(GO:0030032) |
| 0.0 | 0.5 | GO:0051457 | maintenance of protein location in nucleus(GO:0051457) |
| 0.0 | 0.1 | GO:0048496 | maintenance of organ identity(GO:0048496) |
| 0.0 | 0.2 | GO:0060391 | positive regulation of SMAD protein import into nucleus(GO:0060391) |
| 0.0 | 1.1 | GO:0007019 | microtubule depolymerization(GO:0007019) |
| 0.0 | 0.9 | GO:0051973 | positive regulation of telomerase activity(GO:0051973) |
| 0.0 | 0.3 | GO:0030813 | positive regulation of nucleotide catabolic process(GO:0030813) positive regulation of glycolytic process(GO:0045821) positive regulation of cofactor metabolic process(GO:0051194) positive regulation of coenzyme metabolic process(GO:0051197) |
| 0.0 | 0.3 | GO:0044253 | positive regulation of collagen metabolic process(GO:0010714) positive regulation of collagen biosynthetic process(GO:0032967) positive regulation of multicellular organismal metabolic process(GO:0044253) |
| 0.0 | 0.9 | GO:0015749 | monosaccharide transport(GO:0015749) |
| 0.0 | 0.1 | GO:0000920 | cell separation after cytokinesis(GO:0000920) |
| 0.0 | 0.6 | GO:0006383 | transcription from RNA polymerase III promoter(GO:0006383) |
| 0.0 | 0.2 | GO:0046329 | negative regulation of JNK cascade(GO:0046329) |
| 0.0 | 0.5 | GO:0006730 | one-carbon metabolic process(GO:0006730) |
| 0.0 | 0.4 | GO:0071577 | zinc II ion transmembrane transport(GO:0071577) |
| 0.0 | 0.3 | GO:0008584 | male gonad development(GO:0008584) development of primary male sexual characteristics(GO:0046546) |
| 0.0 | 0.1 | GO:0006177 | GMP biosynthetic process(GO:0006177) |
| 0.0 | 0.9 | GO:0030500 | regulation of bone mineralization(GO:0030500) |
| 0.0 | 0.2 | GO:0006610 | ribosomal protein import into nucleus(GO:0006610) |
| 0.0 | 0.9 | GO:0010811 | positive regulation of cell-substrate adhesion(GO:0010811) |
| 0.0 | 0.8 | GO:0045670 | regulation of osteoclast differentiation(GO:0045670) |
| 0.0 | 0.3 | GO:0006120 | mitochondrial electron transport, NADH to ubiquinone(GO:0006120) |
| 0.0 | 0.3 | GO:0036010 | protein localization to endosome(GO:0036010) |
| 0.0 | 0.4 | GO:0002088 | lens development in camera-type eye(GO:0002088) |
| 0.0 | 0.1 | GO:0031642 | negative regulation of myelination(GO:0031642) |
| 0.0 | 0.3 | GO:0021884 | forebrain neuron development(GO:0021884) |
| 0.0 | 0.7 | GO:0080171 | lysosome organization(GO:0007040) lytic vacuole organization(GO:0080171) |
| 0.0 | 0.1 | GO:0001980 | regulation of systemic arterial blood pressure by ischemic conditions(GO:0001980) |
| 0.0 | 0.3 | GO:0048240 | sperm capacitation(GO:0048240) |
| 0.0 | 0.1 | GO:0045040 | protein import into mitochondrial outer membrane(GO:0045040) |
| 0.0 | 0.4 | GO:0016578 | histone deubiquitination(GO:0016578) |
| 0.0 | 0.3 | GO:0031297 | replication fork processing(GO:0031297) |
| 0.0 | 0.1 | GO:0007131 | reciprocal meiotic recombination(GO:0007131) reciprocal DNA recombination(GO:0035825) |
| 0.0 | 0.3 | GO:0006754 | ATP biosynthetic process(GO:0006754) |
| 0.0 | 0.1 | GO:0033299 | secretion of lysosomal enzymes(GO:0033299) |
| 0.0 | 0.5 | GO:0000387 | spliceosomal snRNP assembly(GO:0000387) |
| 0.0 | 0.3 | GO:0014046 | dopamine secretion(GO:0014046) regulation of dopamine secretion(GO:0014059) |
| 0.0 | 0.1 | GO:0060575 | intestinal epithelial cell differentiation(GO:0060575) |
| 0.0 | 0.0 | GO:0010958 | regulation of amino acid import(GO:0010958) |
| 0.0 | 1.4 | GO:0051297 | centrosome organization(GO:0051297) |
| 0.0 | 0.6 | GO:0000266 | mitochondrial fission(GO:0000266) |
| 0.0 | 0.8 | GO:0051453 | regulation of intracellular pH(GO:0051453) |
| 0.0 | 0.1 | GO:0006491 | N-glycan processing(GO:0006491) |
| 0.0 | 0.1 | GO:0015809 | arginine transport(GO:0015809) |
| 0.0 | 0.6 | GO:0045740 | positive regulation of DNA replication(GO:0045740) |
| 0.0 | 0.7 | GO:2001022 | positive regulation of response to DNA damage stimulus(GO:2001022) |
| 0.0 | 0.1 | GO:0071803 | positive regulation of podosome assembly(GO:0071803) |
| 0.0 | 0.2 | GO:1903861 | positive regulation of dendrite extension(GO:1903861) |
| 0.0 | 0.7 | GO:2001243 | negative regulation of intrinsic apoptotic signaling pathway(GO:2001243) |
| 0.0 | 0.1 | GO:1901623 | regulation of lymphocyte chemotaxis(GO:1901623) |
| 0.0 | 0.8 | GO:0042147 | retrograde transport, endosome to Golgi(GO:0042147) |
| 0.0 | 0.4 | GO:0035690 | cellular response to drug(GO:0035690) |
| 0.0 | 0.4 | GO:0000027 | ribosomal large subunit assembly(GO:0000027) |
Gene overrepresentation in cellular_component category:
| Log-likelihood per target | Total log-likelihood | Term | Description |
|---|---|---|---|
| 1.3 | 3.9 | GO:0034363 | intermediate-density lipoprotein particle(GO:0034363) |
| 1.0 | 5.9 | GO:0035976 | AP1 complex(GO:0035976) |
| 0.9 | 3.7 | GO:0031838 | haptoglobin-hemoglobin complex(GO:0031838) |
| 0.7 | 8.9 | GO:0000164 | protein phosphatase type 1 complex(GO:0000164) |
| 0.6 | 1.9 | GO:0044299 | C-fiber(GO:0044299) |
| 0.6 | 2.6 | GO:0019815 | B cell receptor complex(GO:0019815) |
| 0.5 | 1.5 | GO:0036125 | mitochondrial fatty acid beta-oxidation multienzyme complex(GO:0016507) fatty acid beta-oxidation multienzyme complex(GO:0036125) |
| 0.4 | 1.3 | GO:0005584 | collagen type I trimer(GO:0005584) |
| 0.4 | 1.6 | GO:0061702 | inflammasome complex(GO:0061702) |
| 0.4 | 2.3 | GO:0032299 | ribonuclease H2 complex(GO:0032299) |
| 0.4 | 2.2 | GO:0031262 | Ndc80 complex(GO:0031262) |
| 0.4 | 1.1 | GO:0005896 | interleukin-6 receptor complex(GO:0005896) |
| 0.3 | 2.1 | GO:0042613 | MHC class II protein complex(GO:0042613) |
| 0.3 | 1.7 | GO:0016035 | zeta DNA polymerase complex(GO:0016035) |
| 0.3 | 3.3 | GO:0000940 | condensed chromosome outer kinetochore(GO:0000940) |
| 0.2 | 1.0 | GO:0042105 | alpha-beta T cell receptor complex(GO:0042105) |
| 0.2 | 1.4 | GO:0097504 | Gemini of coiled bodies(GO:0097504) |
| 0.2 | 2.4 | GO:0042571 | immunoglobulin complex(GO:0019814) immunoglobulin complex, circulating(GO:0042571) |
| 0.2 | 0.7 | GO:0070557 | PCNA-p21 complex(GO:0070557) |
| 0.2 | 1.7 | GO:0070652 | HAUS complex(GO:0070652) |
| 0.2 | 2.2 | GO:0031362 | anchored component of external side of plasma membrane(GO:0031362) |
| 0.2 | 1.0 | GO:0097441 | basilar dendrite(GO:0097441) |
| 0.2 | 1.8 | GO:0070369 | beta-catenin-TCF7L2 complex(GO:0070369) |
| 0.2 | 1.0 | GO:0033093 | multivesicular body membrane(GO:0032585) Weibel-Palade body(GO:0033093) |
| 0.2 | 0.9 | GO:0098560 | cytoplasmic side of late endosome membrane(GO:0098560) |
| 0.2 | 1.9 | GO:0032591 | dendritic spine membrane(GO:0032591) |
| 0.2 | 1.3 | GO:0000127 | transcription factor TFIIIC complex(GO:0000127) |
| 0.2 | 2.0 | GO:0043197 | dendritic spine(GO:0043197) neuron spine(GO:0044309) |
| 0.2 | 0.8 | GO:0008622 | epsilon DNA polymerase complex(GO:0008622) |
| 0.2 | 0.5 | GO:0045009 | melanosome membrane(GO:0033162) chitosome(GO:0045009) |
| 0.2 | 0.9 | GO:0042575 | DNA polymerase complex(GO:0042575) |
| 0.1 | 1.0 | GO:0030915 | Smc5-Smc6 complex(GO:0030915) |
| 0.1 | 0.6 | GO:0031092 | platelet alpha granule membrane(GO:0031092) |
| 0.1 | 1.3 | GO:1990316 | ATG1/ULK1 kinase complex(GO:1990316) |
| 0.1 | 0.8 | GO:0005796 | Golgi lumen(GO:0005796) |
| 0.1 | 0.5 | GO:1990590 | ATF1-ATF4 transcription factor complex(GO:1990590) |
| 0.1 | 0.4 | GO:0005943 | phosphatidylinositol 3-kinase complex, class IA(GO:0005943) |
| 0.1 | 1.0 | GO:0070765 | gamma-secretase complex(GO:0070765) |
| 0.1 | 0.8 | GO:0035686 | sperm fibrous sheath(GO:0035686) |
| 0.1 | 0.7 | GO:0097513 | myosin II filament(GO:0097513) |
| 0.1 | 0.3 | GO:0048269 | methionine adenosyltransferase complex(GO:0048269) |
| 0.1 | 0.7 | GO:0071818 | BAT3 complex(GO:0071818) ER membrane insertion complex(GO:0072379) |
| 0.1 | 0.5 | GO:0033063 | Rad51B-Rad51C-Rad51D-XRCC2 complex(GO:0033063) |
| 0.1 | 0.5 | GO:0005861 | troponin complex(GO:0005861) |
| 0.1 | 0.3 | GO:0005965 | protein farnesyltransferase complex(GO:0005965) |
| 0.1 | 1.8 | GO:0097225 | sperm midpiece(GO:0097225) |
| 0.1 | 0.4 | GO:0045283 | mitochondrial respiratory chain complex II, succinate dehydrogenase complex (ubiquinone)(GO:0005749) succinate dehydrogenase complex (ubiquinone)(GO:0045257) respiratory chain complex II(GO:0045273) succinate dehydrogenase complex(GO:0045281) fumarate reductase complex(GO:0045283) |
| 0.1 | 1.8 | GO:0033017 | sarcoplasmic reticulum membrane(GO:0033017) |
| 0.1 | 1.3 | GO:0042581 | specific granule(GO:0042581) |
| 0.1 | 0.4 | GO:0090661 | box H/ACA telomerase RNP complex(GO:0090661) |
| 0.1 | 0.3 | GO:0098842 | postsynaptic early endosome(GO:0098842) |
| 0.1 | 0.9 | GO:0045298 | tubulin complex(GO:0045298) |
| 0.1 | 8.9 | GO:0005604 | basement membrane(GO:0005604) |
| 0.1 | 0.4 | GO:0005784 | Sec61 translocon complex(GO:0005784) translocon complex(GO:0071256) |
| 0.1 | 0.2 | GO:0046696 | lipopolysaccharide receptor complex(GO:0046696) |
| 0.1 | 0.3 | GO:0035339 | SPOTS complex(GO:0035339) |
| 0.1 | 2.0 | GO:0097386 | glial cell projection(GO:0097386) |
| 0.1 | 0.8 | GO:0000815 | ESCRT III complex(GO:0000815) |
| 0.1 | 1.1 | GO:0000276 | mitochondrial proton-transporting ATP synthase complex, coupling factor F(o)(GO:0000276) |
| 0.1 | 2.4 | GO:0032588 | trans-Golgi network membrane(GO:0032588) |
| 0.1 | 0.9 | GO:0005922 | connexon complex(GO:0005922) |
| 0.1 | 3.6 | GO:0045171 | intercellular bridge(GO:0045171) |
| 0.1 | 0.7 | GO:0005915 | zonula adherens(GO:0005915) |
| 0.1 | 2.6 | GO:0016235 | aggresome(GO:0016235) |
| 0.1 | 1.2 | GO:0002080 | acrosomal membrane(GO:0002080) |
| 0.1 | 0.7 | GO:0016442 | RISC complex(GO:0016442) RNAi effector complex(GO:0031332) |
| 0.1 | 0.9 | GO:0032593 | insulin-responsive compartment(GO:0032593) |
| 0.1 | 0.7 | GO:0072546 | ER membrane protein complex(GO:0072546) |
| 0.0 | 0.5 | GO:0031080 | nuclear pore outer ring(GO:0031080) |
| 0.0 | 0.9 | GO:0032156 | septin cytoskeleton(GO:0032156) |
| 0.0 | 0.6 | GO:0005921 | gap junction(GO:0005921) |
| 0.0 | 0.1 | GO:0045095 | keratin filament(GO:0045095) |
| 0.0 | 0.3 | GO:0045335 | phagocytic vesicle(GO:0045335) |
| 0.0 | 0.3 | GO:0071986 | Ragulator complex(GO:0071986) |
| 0.0 | 0.6 | GO:0032433 | filopodium tip(GO:0032433) |
| 0.0 | 0.3 | GO:0001674 | female germ cell nucleus(GO:0001674) |
| 0.0 | 0.6 | GO:0031528 | microvillus membrane(GO:0031528) |
| 0.0 | 1.0 | GO:0030992 | intraciliary transport particle B(GO:0030992) |
| 0.0 | 0.9 | GO:0035098 | ESC/E(Z) complex(GO:0035098) |
| 0.0 | 0.2 | GO:0005859 | muscle myosin complex(GO:0005859) |
| 0.0 | 1.0 | GO:0031526 | brush border membrane(GO:0031526) |
| 0.0 | 0.6 | GO:0030018 | Z disc(GO:0030018) |
| 0.0 | 2.0 | GO:0001750 | photoreceptor outer segment(GO:0001750) |
| 0.0 | 0.2 | GO:0030896 | checkpoint clamp complex(GO:0030896) |
| 0.0 | 2.1 | GO:0005881 | cytoplasmic microtubule(GO:0005881) |
| 0.0 | 6.5 | GO:0005777 | peroxisome(GO:0005777) microbody(GO:0042579) |
| 0.0 | 0.2 | GO:0042719 | mitochondrial intermembrane space protein transporter complex(GO:0042719) |
| 0.0 | 0.5 | GO:0036513 | Derlin-1 retrotranslocation complex(GO:0036513) |
| 0.0 | 0.3 | GO:0000138 | Golgi trans cisterna(GO:0000138) |
| 0.0 | 0.5 | GO:0005671 | Ada2/Gcn5/Ada3 transcription activator complex(GO:0005671) |
| 0.0 | 0.4 | GO:0000124 | SAGA complex(GO:0000124) |
| 0.0 | 0.2 | GO:0098644 | complex of collagen trimers(GO:0098644) |
| 0.0 | 1.7 | GO:0000315 | organellar large ribosomal subunit(GO:0000315) mitochondrial large ribosomal subunit(GO:0005762) |
| 0.0 | 0.2 | GO:0000813 | ESCRT I complex(GO:0000813) |
| 0.0 | 0.4 | GO:0005736 | DNA-directed RNA polymerase I complex(GO:0005736) |
| 0.0 | 0.4 | GO:0030136 | clathrin-coated vesicle(GO:0030136) |
| 0.0 | 0.2 | GO:0042629 | mast cell granule(GO:0042629) |
| 0.0 | 0.2 | GO:1990726 | Lsm1-7-Pat1 complex(GO:1990726) |
| 0.0 | 3.7 | GO:0005770 | late endosome(GO:0005770) |
| 0.0 | 2.0 | GO:0015934 | large ribosomal subunit(GO:0015934) |
| 0.0 | 9.9 | GO:0005667 | transcription factor complex(GO:0005667) |
| 0.0 | 5.3 | GO:0016324 | apical plasma membrane(GO:0016324) |
| 0.0 | 0.8 | GO:0030686 | 90S preribosome(GO:0030686) |
| 0.0 | 0.2 | GO:0061700 | GATOR2 complex(GO:0061700) |
| 0.0 | 0.1 | GO:0089717 | spanning component of plasma membrane(GO:0044214) spanning component of membrane(GO:0089717) |
| 0.0 | 0.8 | GO:0016528 | sarcoplasm(GO:0016528) |
| 0.0 | 0.8 | GO:0031594 | neuromuscular junction(GO:0031594) |
| 0.0 | 2.7 | GO:0005741 | mitochondrial outer membrane(GO:0005741) |
| 0.0 | 0.0 | GO:0005865 | striated muscle thin filament(GO:0005865) myofilament(GO:0036379) |
| 0.0 | 0.3 | GO:0008305 | integrin complex(GO:0008305) protein complex involved in cell adhesion(GO:0098636) |
| 0.0 | 1.7 | GO:0031227 | intrinsic component of endoplasmic reticulum membrane(GO:0031227) |
| 0.0 | 0.0 | GO:0071001 | U4/U6 snRNP(GO:0071001) |
| 0.0 | 0.1 | GO:0030061 | mitochondrial crista(GO:0030061) |
| 0.0 | 0.1 | GO:1990357 | terminal web(GO:1990357) |
| 0.0 | 0.2 | GO:0001518 | voltage-gated sodium channel complex(GO:0001518) |
| 0.0 | 1.5 | GO:0005814 | centriole(GO:0005814) |
| 0.0 | 0.5 | GO:0042645 | nucleoid(GO:0009295) mitochondrial nucleoid(GO:0042645) |
| 0.0 | 0.3 | GO:0045178 | basal part of cell(GO:0045178) |
| 0.0 | 0.2 | GO:0001669 | acrosomal vesicle(GO:0001669) |
| 0.0 | 0.6 | GO:0005801 | cis-Golgi network(GO:0005801) |
| 0.0 | 0.7 | GO:0010494 | cytoplasmic stress granule(GO:0010494) |
| 0.0 | 2.2 | GO:0030027 | lamellipodium(GO:0030027) |
| 0.0 | 0.7 | GO:0005758 | mitochondrial intermembrane space(GO:0005758) |
| 0.0 | 2.9 | GO:0031965 | nuclear membrane(GO:0031965) |
| 0.0 | 0.3 | GO:0032590 | dendrite membrane(GO:0032590) |
| 0.0 | 0.1 | GO:0001520 | outer dense fiber(GO:0001520) |
| 0.0 | 0.0 | GO:1990037 | Lewy body core(GO:1990037) |
| 0.0 | 0.3 | GO:0030285 | integral component of synaptic vesicle membrane(GO:0030285) intrinsic component of synaptic vesicle membrane(GO:0098563) |
| 0.0 | 0.1 | GO:0030141 | secretory granule(GO:0030141) |
| 0.0 | 0.6 | GO:0005901 | caveola(GO:0005901) |
| 0.0 | 0.5 | GO:0005788 | endoplasmic reticulum lumen(GO:0005788) |
| 0.0 | 0.6 | GO:0055037 | recycling endosome(GO:0055037) |
| 0.0 | 1.5 | GO:0001650 | fibrillar center(GO:0001650) |
| 0.0 | 0.2 | GO:0001741 | XY body(GO:0001741) |
| 0.0 | 0.2 | GO:0046540 | U4/U6 x U5 tri-snRNP complex(GO:0046540) |
Gene overrepresentation in molecular_function category:
| Log-likelihood per target | Total log-likelihood | Term | Description |
|---|---|---|---|
| 1.9 | 5.6 | GO:0004510 | tryptophan 5-monooxygenase activity(GO:0004510) |
| 1.7 | 7.0 | GO:0047844 | deoxycytidine deaminase activity(GO:0047844) |
| 1.3 | 3.9 | GO:0046911 | hydroxyapatite binding(GO:0046848) metal chelating activity(GO:0046911) phosphatidylcholine-sterol O-acyltransferase activator activity(GO:0060228) |
| 1.2 | 4.9 | GO:0034714 | type III transforming growth factor beta receptor binding(GO:0034714) |
| 0.9 | 3.7 | GO:0031720 | haptoglobin binding(GO:0031720) |
| 0.8 | 2.5 | GO:0036132 | 13-prostaglandin reductase activity(GO:0036132) 15-oxoprostaglandin 13-oxidase activity(GO:0047522) |
| 0.7 | 2.0 | GO:0005118 | sevenless binding(GO:0005118) |
| 0.6 | 1.7 | GO:0098809 | nitrite reductase activity(GO:0098809) |
| 0.5 | 2.0 | GO:0019864 | immunoglobulin receptor activity(GO:0019763) IgG receptor activity(GO:0019770) IgG binding(GO:0019864) |
| 0.5 | 2.0 | GO:0015220 | choline transmembrane transporter activity(GO:0015220) |
| 0.5 | 3.5 | GO:0032453 | histone demethylase activity (H3-K4 specific)(GO:0032453) |
| 0.5 | 2.0 | GO:0019863 | IgE binding(GO:0019863) Fc-gamma receptor I complex binding(GO:0034988) |
| 0.5 | 2.9 | GO:0050786 | RAGE receptor binding(GO:0050786) |
| 0.5 | 1.9 | GO:0031727 | CCR2 chemokine receptor binding(GO:0031727) |
| 0.5 | 5.2 | GO:0008430 | selenium binding(GO:0008430) |
| 0.4 | 1.3 | GO:0000992 | polymerase III regulatory region sequence-specific DNA binding(GO:0000992) RNA polymerase III type 1 promoter sequence-specific DNA binding(GO:0001002) RNA polymerase III type 2 promoter sequence-specific DNA binding(GO:0001003) RNA polymerase III transcription factor activity, sequence-specific DNA binding(GO:0001034) |
| 0.4 | 1.7 | GO:0004090 | carbonyl reductase (NADPH) activity(GO:0004090) |
| 0.4 | 4.9 | GO:0034987 | immunoglobulin receptor binding(GO:0034987) |
| 0.4 | 6.0 | GO:0017017 | MAP kinase tyrosine/serine/threonine phosphatase activity(GO:0017017) |
| 0.4 | 1.2 | GO:0071723 | lipopeptide binding(GO:0071723) |
| 0.4 | 1.5 | GO:0016508 | long-chain-enoyl-CoA hydratase activity(GO:0016508) long-chain-3-hydroxyacyl-CoA dehydrogenase activity(GO:0016509) |
| 0.4 | 1.1 | GO:0004923 | leukemia inhibitory factor receptor activity(GO:0004923) oncostatin-M receptor activity(GO:0004924) |
| 0.4 | 3.2 | GO:1990239 | steroid hormone binding(GO:1990239) |
| 0.3 | 1.4 | GO:0015143 | urate transmembrane transporter activity(GO:0015143) salt transmembrane transporter activity(GO:1901702) |
| 0.3 | 1.0 | GO:0008113 | peptide-methionine (S)-S-oxide reductase activity(GO:0008113) |
| 0.3 | 1.0 | GO:0005001 | transmembrane receptor protein tyrosine phosphatase activity(GO:0005001) transmembrane receptor protein phosphatase activity(GO:0019198) |
| 0.3 | 4.5 | GO:0004861 | cyclin-dependent protein serine/threonine kinase inhibitor activity(GO:0004861) |
| 0.3 | 4.0 | GO:0030296 | protein tyrosine kinase activator activity(GO:0030296) |
| 0.3 | 0.9 | GO:0046899 | nucleoside triphosphate adenylate kinase activity(GO:0046899) |
| 0.3 | 2.0 | GO:0004523 | RNA-DNA hybrid ribonuclease activity(GO:0004523) |
| 0.3 | 3.8 | GO:0005328 | neurotransmitter:sodium symporter activity(GO:0005328) |
| 0.3 | 1.1 | GO:0097108 | hedgehog family protein binding(GO:0097108) |
| 0.3 | 1.6 | GO:0005138 | interleukin-6 receptor binding(GO:0005138) |
| 0.3 | 3.3 | GO:0015643 | toxic substance binding(GO:0015643) |
| 0.3 | 1.5 | GO:0016936 | galactoside binding(GO:0016936) |
| 0.3 | 1.0 | GO:0033743 | peptide-methionine (R)-S-oxide reductase activity(GO:0033743) |
| 0.2 | 1.2 | GO:0043515 | kinetochore binding(GO:0043515) |
| 0.2 | 1.0 | GO:0004741 | [pyruvate dehydrogenase (lipoamide)] phosphatase activity(GO:0004741) |
| 0.2 | 0.7 | GO:0004875 | complement receptor activity(GO:0004875) |
| 0.2 | 1.7 | GO:0004614 | phosphoglucomutase activity(GO:0004614) |
| 0.2 | 0.7 | GO:0004711 | ribosomal protein S6 kinase activity(GO:0004711) |
| 0.2 | 1.4 | GO:0008297 | single-stranded DNA exodeoxyribonuclease activity(GO:0008297) |
| 0.2 | 2.1 | GO:0043023 | ribosomal large subunit binding(GO:0043023) |
| 0.2 | 0.9 | GO:0017108 | 5'-flap endonuclease activity(GO:0017108) |
| 0.2 | 0.7 | GO:0070890 | L-ascorbate:sodium symporter activity(GO:0008520) L-ascorbic acid transporter activity(GO:0015229) dehydroascorbic acid transporter activity(GO:0033300) sodium-dependent L-ascorbate transmembrane transporter activity(GO:0070890) |
| 0.2 | 1.3 | GO:0097001 | ceramide binding(GO:0097001) |
| 0.2 | 2.3 | GO:0015250 | water channel activity(GO:0015250) |
| 0.2 | 1.3 | GO:0070728 | leucine binding(GO:0070728) |
| 0.2 | 1.1 | GO:0008172 | S-methyltransferase activity(GO:0008172) |
| 0.2 | 2.9 | GO:0005544 | calcium-dependent phospholipid binding(GO:0005544) |
| 0.2 | 2.5 | GO:0004089 | carbonate dehydratase activity(GO:0004089) |
| 0.2 | 1.6 | GO:0008140 | cAMP response element binding protein binding(GO:0008140) |
| 0.2 | 1.8 | GO:0008420 | CTD phosphatase activity(GO:0008420) |
| 0.2 | 1.9 | GO:0043262 | adenosine-diphosphatase activity(GO:0043262) |
| 0.2 | 1.3 | GO:0015125 | bile acid transmembrane transporter activity(GO:0015125) |
| 0.2 | 1.7 | GO:0030976 | thiamine pyrophosphate binding(GO:0030976) |
| 0.2 | 2.0 | GO:0046625 | sphingolipid binding(GO:0046625) |
| 0.2 | 0.6 | GO:0005124 | scavenger receptor binding(GO:0005124) |
| 0.2 | 0.2 | GO:0004647 | phosphoserine phosphatase activity(GO:0004647) |
| 0.2 | 0.5 | GO:0036313 | phosphatidylinositol 3-kinase catalytic subunit binding(GO:0036313) |
| 0.2 | 1.3 | GO:0070290 | N-acylphosphatidylethanolamine-specific phospholipase D activity(GO:0070290) |
| 0.2 | 10.5 | GO:0001102 | RNA polymerase II activating transcription factor binding(GO:0001102) |
| 0.2 | 0.5 | GO:0035651 | AP-1 adaptor complex binding(GO:0035650) AP-3 adaptor complex binding(GO:0035651) |
| 0.2 | 0.9 | GO:0015501 | sodium:amino acid symporter activity(GO:0005283) glutamate:sodium symporter activity(GO:0015501) |
| 0.1 | 0.4 | GO:0031779 | melanocortin receptor binding(GO:0031779) type 3 melanocortin receptor binding(GO:0031781) type 4 melanocortin receptor binding(GO:0031782) |
| 0.1 | 0.6 | GO:0042806 | fucose binding(GO:0042806) |
| 0.1 | 0.4 | GO:0005343 | organic acid:sodium symporter activity(GO:0005343) |
| 0.1 | 0.4 | GO:0001716 | L-amino-acid oxidase activity(GO:0001716) |
| 0.1 | 0.7 | GO:0031419 | cobalamin binding(GO:0031419) |
| 0.1 | 3.7 | GO:0001968 | fibronectin binding(GO:0001968) |
| 0.1 | 0.4 | GO:0019211 | phosphatase activator activity(GO:0019211) |
| 0.1 | 1.3 | GO:0005068 | transmembrane receptor protein tyrosine kinase adaptor activity(GO:0005068) |
| 0.1 | 3.2 | GO:1900750 | glutathione binding(GO:0043295) oligopeptide binding(GO:1900750) |
| 0.1 | 0.4 | GO:0008177 | succinate dehydrogenase (ubiquinone) activity(GO:0008177) |
| 0.1 | 0.6 | GO:0003839 | gamma-glutamylcyclotransferase activity(GO:0003839) |
| 0.1 | 1.2 | GO:0016634 | oxidoreductase activity, acting on the CH-CH group of donors, oxygen as acceptor(GO:0016634) |
| 0.1 | 0.6 | GO:0008427 | calcium-dependent protein kinase inhibitor activity(GO:0008427) |
| 0.1 | 0.3 | GO:0004758 | serine C-palmitoyltransferase activity(GO:0004758) C-palmitoyltransferase activity(GO:0016454) |
| 0.1 | 2.0 | GO:0008510 | sodium:bicarbonate symporter activity(GO:0008510) |
| 0.1 | 1.2 | GO:0071933 | Arp2/3 complex binding(GO:0071933) |
| 0.1 | 4.0 | GO:0005504 | fatty acid binding(GO:0005504) |
| 0.1 | 4.6 | GO:0004864 | protein phosphatase inhibitor activity(GO:0004864) |
| 0.1 | 0.7 | GO:0004971 | AMPA glutamate receptor activity(GO:0004971) |
| 0.1 | 0.9 | GO:0031730 | CCR5 chemokine receptor binding(GO:0031730) |
| 0.1 | 0.8 | GO:0045294 | alpha-catenin binding(GO:0045294) |
| 0.1 | 0.5 | GO:0004303 | estradiol 17-beta-dehydrogenase activity(GO:0004303) |
| 0.1 | 0.7 | GO:0043423 | 3-phosphoinositide-dependent protein kinase binding(GO:0043423) |
| 0.1 | 0.2 | GO:0035373 | chondroitin sulfate proteoglycan binding(GO:0035373) |
| 0.1 | 1.2 | GO:0008190 | eukaryotic initiation factor 4E binding(GO:0008190) |
| 0.1 | 0.5 | GO:0031014 | troponin T binding(GO:0031014) |
| 0.1 | 3.4 | GO:0008307 | structural constituent of muscle(GO:0008307) |
| 0.1 | 0.3 | GO:0004660 | protein farnesyltransferase activity(GO:0004660) |
| 0.1 | 1.4 | GO:0030898 | actin-dependent ATPase activity(GO:0030898) |
| 0.1 | 0.3 | GO:0000099 | sulfur amino acid transmembrane transporter activity(GO:0000099) |
| 0.1 | 0.7 | GO:0070097 | delta-catenin binding(GO:0070097) |
| 0.1 | 1.3 | GO:0048407 | platelet-derived growth factor binding(GO:0048407) |
| 0.1 | 0.5 | GO:0008821 | crossover junction endodeoxyribonuclease activity(GO:0008821) |
| 0.1 | 1.8 | GO:0070016 | gamma-catenin binding(GO:0045295) armadillo repeat domain binding(GO:0070016) |
| 0.1 | 0.8 | GO:0004185 | serine-type carboxypeptidase activity(GO:0004185) |
| 0.1 | 0.6 | GO:0098821 | BMP receptor activity(GO:0098821) |
| 0.1 | 0.5 | GO:0016846 | carbon-sulfur lyase activity(GO:0016846) |
| 0.1 | 0.3 | GO:0008476 | protein-tyrosine sulfotransferase activity(GO:0008476) |
| 0.1 | 1.3 | GO:0051400 | BH domain binding(GO:0051400) |
| 0.1 | 1.1 | GO:0048020 | CCR chemokine receptor binding(GO:0048020) |
| 0.1 | 0.5 | GO:0016725 | oxidoreductase activity, acting on CH or CH2 groups(GO:0016725) |
| 0.1 | 0.2 | GO:0071633 | dihydroceramidase activity(GO:0071633) |
| 0.1 | 2.0 | GO:0070840 | dynein complex binding(GO:0070840) |
| 0.1 | 0.8 | GO:0019213 | deacetylase activity(GO:0019213) |
| 0.1 | 1.5 | GO:0042287 | MHC protein binding(GO:0042287) |
| 0.1 | 1.7 | GO:0003887 | DNA-directed DNA polymerase activity(GO:0003887) |
| 0.1 | 6.1 | GO:0008083 | growth factor activity(GO:0008083) |
| 0.1 | 1.4 | GO:0005044 | scavenger receptor activity(GO:0005044) |
| 0.1 | 1.0 | GO:0070403 | NAD+ binding(GO:0070403) |
| 0.1 | 1.1 | GO:0098641 | cadherin binding involved in cell-cell adhesion(GO:0098641) |
| 0.1 | 0.3 | GO:0001851 | complement component C3b binding(GO:0001851) |
| 0.1 | 3.8 | GO:0017022 | myosin binding(GO:0017022) |
| 0.1 | 0.2 | GO:0003827 | alpha-1,3-mannosylglycoprotein 2-beta-N-acetylglucosaminyltransferase activity(GO:0003827) |
| 0.1 | 0.7 | GO:0005229 | intracellular calcium activated chloride channel activity(GO:0005229) |
| 0.1 | 0.2 | GO:0030629 | U6 snRNA 3'-end binding(GO:0030629) |
| 0.1 | 1.7 | GO:0019707 | protein-cysteine S-palmitoyltransferase activity(GO:0019706) protein-cysteine S-acyltransferase activity(GO:0019707) |
| 0.1 | 0.2 | GO:0003998 | acylphosphatase activity(GO:0003998) |
| 0.1 | 0.3 | GO:0033188 | sphingomyelin synthase activity(GO:0033188) ceramide cholinephosphotransferase activity(GO:0047493) |
| 0.1 | 0.4 | GO:0034513 | box H/ACA snoRNA binding(GO:0034513) |
| 0.1 | 2.0 | GO:0050840 | extracellular matrix binding(GO:0050840) |
| 0.1 | 0.2 | GO:0004492 | methylmalonyl-CoA decarboxylase activity(GO:0004492) |
| 0.1 | 0.7 | GO:0008656 | cysteine-type endopeptidase activator activity involved in apoptotic process(GO:0008656) |
| 0.1 | 2.4 | GO:0070888 | E-box binding(GO:0070888) |
| 0.1 | 0.2 | GO:0001875 | lipopolysaccharide receptor activity(GO:0001875) |
| 0.1 | 0.8 | GO:0045499 | chemorepellent activity(GO:0045499) |
| 0.1 | 0.3 | GO:0043891 | glyceraldehyde-3-phosphate dehydrogenase (NAD+) (phosphorylating) activity(GO:0004365) glyceraldehyde-3-phosphate dehydrogenase (NAD(P)+) (phosphorylating) activity(GO:0043891) |
| 0.1 | 1.8 | GO:0030676 | Rac guanyl-nucleotide exchange factor activity(GO:0030676) |
| 0.1 | 3.9 | GO:0004252 | serine-type endopeptidase activity(GO:0004252) |
| 0.1 | 0.2 | GO:0008853 | exodeoxyribonuclease III activity(GO:0008853) |
| 0.1 | 0.2 | GO:0070736 | protein-glycine ligase activity(GO:0070735) protein-glycine ligase activity, initiating(GO:0070736) |
| 0.1 | 0.5 | GO:0000182 | rDNA binding(GO:0000182) |
| 0.1 | 1.0 | GO:0030506 | ankyrin binding(GO:0030506) |
| 0.0 | 0.2 | GO:0046923 | ER retention sequence binding(GO:0046923) |
| 0.0 | 0.2 | GO:0004735 | pyrroline-5-carboxylate reductase activity(GO:0004735) |
| 0.0 | 0.2 | GO:0035614 | snRNA stem-loop binding(GO:0035614) |
| 0.0 | 0.6 | GO:0005123 | death receptor binding(GO:0005123) |
| 0.0 | 0.9 | GO:0004707 | MAP kinase activity(GO:0004707) |
| 0.0 | 0.4 | GO:0046934 | phosphatidylinositol-4,5-bisphosphate 3-kinase activity(GO:0046934) phosphatidylinositol bisphosphate kinase activity(GO:0052813) |
| 0.0 | 0.6 | GO:0016783 | sulfurtransferase activity(GO:0016783) |
| 0.0 | 0.4 | GO:0008429 | phosphatidylethanolamine binding(GO:0008429) |
| 0.0 | 0.5 | GO:0005243 | gap junction channel activity(GO:0005243) |
| 0.0 | 1.4 | GO:0033613 | activating transcription factor binding(GO:0033613) |
| 0.0 | 0.7 | GO:0031702 | type 1 angiotensin receptor binding(GO:0031702) |
| 0.0 | 1.0 | GO:0080025 | phosphatidylinositol-3,5-bisphosphate binding(GO:0080025) |
| 0.0 | 0.5 | GO:0034979 | NAD-dependent protein deacetylase activity(GO:0034979) |
| 0.0 | 3.8 | GO:0019905 | syntaxin binding(GO:0019905) |
| 0.0 | 2.4 | GO:0000981 | RNA polymerase II transcription factor activity, sequence-specific DNA binding(GO:0000981) |
| 0.0 | 0.4 | GO:0003689 | DNA clamp loader activity(GO:0003689) protein-DNA loading ATPase activity(GO:0033170) |
| 0.0 | 0.3 | GO:0001055 | RNA polymerase II activity(GO:0001055) |
| 0.0 | 3.1 | GO:0004843 | thiol-dependent ubiquitin-specific protease activity(GO:0004843) |
| 0.0 | 1.4 | GO:0048487 | beta-tubulin binding(GO:0048487) |
| 0.0 | 0.1 | GO:0086038 | calcium:sodium antiporter activity involved in regulation of cardiac muscle cell membrane potential(GO:0086038) |
| 0.0 | 0.8 | GO:0017134 | fibroblast growth factor binding(GO:0017134) |
| 0.0 | 0.3 | GO:0008517 | folic acid transporter activity(GO:0008517) |
| 0.0 | 0.1 | GO:0003938 | IMP dehydrogenase activity(GO:0003938) |
| 0.0 | 0.5 | GO:0005092 | GDP-dissociation inhibitor activity(GO:0005092) |
| 0.0 | 0.9 | GO:0050699 | WW domain binding(GO:0050699) |
| 0.0 | 0.8 | GO:0071889 | 14-3-3 protein binding(GO:0071889) |
| 0.0 | 0.4 | GO:0004435 | phosphatidylinositol phospholipase C activity(GO:0004435) |
| 0.0 | 0.9 | GO:0005080 | protein kinase C binding(GO:0005080) |
| 0.0 | 4.3 | GO:0001078 | transcriptional repressor activity, RNA polymerase II core promoter proximal region sequence-specific binding(GO:0001078) |
| 0.0 | 0.5 | GO:0002039 | p53 binding(GO:0002039) |
| 0.0 | 0.1 | GO:0004920 | interleukin-10 receptor activity(GO:0004920) |
| 0.0 | 0.1 | GO:0008239 | dipeptidyl-peptidase activity(GO:0008239) |
| 0.0 | 0.2 | GO:0001848 | complement binding(GO:0001848) |
| 0.0 | 0.3 | GO:0004576 | oligosaccharyl transferase activity(GO:0004576) dolichyl-diphosphooligosaccharide-protein glycotransferase activity(GO:0004579) |
| 0.0 | 0.1 | GO:0017081 | chloride channel regulator activity(GO:0017081) |
| 0.0 | 0.3 | GO:0005251 | delayed rectifier potassium channel activity(GO:0005251) |
| 0.0 | 0.3 | GO:0048038 | quinone binding(GO:0048038) |
| 0.0 | 0.8 | GO:0031624 | ubiquitin conjugating enzyme binding(GO:0031624) |
| 0.0 | 0.4 | GO:0008143 | poly(A) binding(GO:0008143) |
| 0.0 | 0.4 | GO:0004653 | polypeptide N-acetylgalactosaminyltransferase activity(GO:0004653) |
| 0.0 | 0.1 | GO:0097642 | calcitonin family receptor activity(GO:0097642) |
| 0.0 | 0.8 | GO:0001205 | transcriptional activator activity, RNA polymerase II distal enhancer sequence-specific binding(GO:0001205) |
| 0.0 | 0.4 | GO:0004601 | peroxidase activity(GO:0004601) |
| 0.0 | 0.4 | GO:0015215 | nucleotide transmembrane transporter activity(GO:0015215) |
| 0.0 | 0.3 | GO:0015020 | glucuronosyltransferase activity(GO:0015020) |
| 0.0 | 0.9 | GO:0003705 | transcription factor activity, RNA polymerase II distal enhancer sequence-specific binding(GO:0003705) |
| 0.0 | 0.4 | GO:0004540 | ribonuclease activity(GO:0004540) |
| 0.0 | 0.2 | GO:0003995 | acyl-CoA dehydrogenase activity(GO:0003995) |
| 0.0 | 4.3 | GO:0030695 | GTPase regulator activity(GO:0030695) |
| 0.0 | 0.4 | GO:0043027 | cysteine-type endopeptidase inhibitor activity involved in apoptotic process(GO:0043027) |
| 0.0 | 0.2 | GO:0004364 | glutathione transferase activity(GO:0004364) |
| 0.0 | 0.1 | GO:0046703 | natural killer cell lectin-like receptor binding(GO:0046703) |
| 0.0 | 0.3 | GO:0004697 | protein kinase C activity(GO:0004697) |
| 0.0 | 0.1 | GO:0008474 | palmitoyl-(protein) hydrolase activity(GO:0008474) palmitoyl hydrolase activity(GO:0098599) |
| 0.0 | 0.5 | GO:0016811 | hydrolase activity, acting on carbon-nitrogen (but not peptide) bonds, in linear amides(GO:0016811) |
| 0.0 | 0.2 | GO:0031402 | sodium ion binding(GO:0031402) |
| 0.0 | 0.1 | GO:0019855 | calcium channel inhibitor activity(GO:0019855) |
| 0.0 | 0.1 | GO:0015181 | arginine transmembrane transporter activity(GO:0015181) |
| 0.0 | 0.8 | GO:0001085 | RNA polymerase II transcription factor binding(GO:0001085) |
| 0.0 | 0.1 | GO:0052629 | phosphatidylinositol-3,5-bisphosphate 3-phosphatase activity(GO:0052629) |
| 0.0 | 0.5 | GO:0043621 | protein self-association(GO:0043621) |
| 0.0 | 0.2 | GO:0051428 | peptide hormone receptor binding(GO:0051428) |
| 0.0 | 0.8 | GO:0003727 | single-stranded RNA binding(GO:0003727) |
| 0.0 | 0.2 | GO:0042562 | hormone binding(GO:0042562) |
| 0.0 | 0.1 | GO:0015929 | hexosaminidase activity(GO:0015929) |
Gene overrepresentation in C2:CP category:
| Log-likelihood per target | Total log-likelihood | Term | Description |
|---|---|---|---|
| 0.5 | 4.9 | SA_MMP_CYTOKINE_CONNECTION | Cytokines can induce activation of matrix metalloproteinases, which degrade extracellular matrix. |
| 0.3 | 5.9 | PID_TCR_RAS_PATHWAY | Ras signaling in the CD4+ TCR pathway |
| 0.2 | 7.0 | PID_SYNDECAN_4_PATHWAY | Syndecan-4-mediated signaling events |
| 0.2 | 2.2 | PID_INTEGRIN2_PATHWAY | Beta2 integrin cell surface interactions |
| 0.1 | 12.3 | PID_SMAD2_3NUCLEAR_PATHWAY | Regulation of nuclear SMAD2/3 signaling |
| 0.1 | 1.1 | PID_IL27_PATHWAY | IL27-mediated signaling events |
| 0.1 | 3.7 | PID_GMCSF_PATHWAY | GMCSF-mediated signaling events |
| 0.1 | 1.6 | ST_INTERLEUKIN_4_PATHWAY | Interleukin 4 (IL-4) Pathway |
| 0.1 | 1.4 | SIG_IL4RECEPTOR_IN_B_LYPHOCYTES | Genes related to IL4 rceptor signaling in B lymphocytes |
| 0.1 | 0.4 | PID_FRA_PATHWAY | Validated transcriptional targets of AP1 family members Fra1 and Fra2 |
| 0.1 | 1.3 | PID_S1P_S1P1_PATHWAY | S1P1 pathway |
| 0.1 | 1.2 | PID_SYNDECAN_3_PATHWAY | Syndecan-3-mediated signaling events |
| 0.1 | 2.9 | PID_NFAT_TFPATHWAY | Calcineurin-regulated NFAT-dependent transcription in lymphocytes |
| 0.1 | 1.0 | PID_SYNDECAN_2_PATHWAY | Syndecan-2-mediated signaling events |
| 0.1 | 3.0 | PID_ILK_PATHWAY | Integrin-linked kinase signaling |
| 0.1 | 0.8 | PID_ERBB_NETWORK_PATHWAY | ErbB receptor signaling network |
| 0.1 | 4.0 | PID_PLK1_PATHWAY | PLK1 signaling events |
| 0.1 | 1.1 | PID_PRL_SIGNALING_EVENTS_PATHWAY | Signaling events mediated by PRL |
| 0.1 | 2.1 | ST_WNT_BETA_CATENIN_PATHWAY | Wnt/beta-catenin Pathway |
| 0.1 | 2.0 | PID_RAS_PATHWAY | Regulation of Ras family activation |
| 0.1 | 1.4 | PID_FOXM1_PATHWAY | FOXM1 transcription factor network |
| 0.1 | 1.1 | PID_HEDGEHOG_2PATHWAY | Signaling events mediated by the Hedgehog family |
| 0.0 | 0.7 | PID_AVB3_OPN_PATHWAY | Osteopontin-mediated events |
| 0.0 | 1.1 | PID_INTEGRIN_A4B1_PATHWAY | Alpha4 beta1 integrin signaling events |
| 0.0 | 0.3 | PID_IL2_PI3K_PATHWAY | IL2 signaling events mediated by PI3K |
| 0.0 | 0.6 | SA_CASPASE_CASCADE | Apoptosis is mediated by caspases, cysteine proteases arranged in a proteolytic cascade. |
| 0.0 | 1.3 | NABA_COLLAGENS | Genes encoding collagen proteins |
| 0.0 | 2.0 | PID_E2F_PATHWAY | E2F transcription factor network |
| 0.0 | 1.1 | PID_HNF3A_PATHWAY | FOXA1 transcription factor network |
| 0.0 | 0.9 | ST_ERK1_ERK2_MAPK_PATHWAY | ERK1/ERK2 MAPK Pathway |
| 0.0 | 1.1 | PID_AURORA_B_PATHWAY | Aurora B signaling |
| 0.0 | 0.3 | PID_RHODOPSIN_PATHWAY | Visual signal transduction: Rods |
| 0.0 | 1.0 | SIG_REGULATION_OF_THE_ACTIN_CYTOSKELETON_BY_RHO_GTPASES | Genes related to regulation of the actin cytoskeleton |
| 0.0 | 1.5 | PID_HDAC_CLASSI_PATHWAY | Signaling events mediated by HDAC Class I |
| 0.0 | 1.1 | PID_FANCONI_PATHWAY | Fanconi anemia pathway |
| 0.0 | 0.8 | NABA_PROTEOGLYCANS | Genes encoding proteoglycans |
| 0.0 | 1.0 | PID_BMP_PATHWAY | BMP receptor signaling |
| 0.0 | 0.6 | PID_KIT_PATHWAY | Signaling events mediated by Stem cell factor receptor (c-Kit) |
| 0.0 | 0.3 | PID_IL8_CXCR1_PATHWAY | IL8- and CXCR1-mediated signaling events |
| 0.0 | 0.7 | PID_REG_GR_PATHWAY | Glucocorticoid receptor regulatory network |
| 0.0 | 0.9 | PID_NOTCH_PATHWAY | Notch signaling pathway |
| 0.0 | 0.4 | PID_ARF6_PATHWAY | Arf6 signaling events |
| 0.0 | 2.4 | NABA_SECRETED_FACTORS | Genes encoding secreted soluble factors |
| 0.0 | 0.5 | PID_ECADHERIN_STABILIZATION_PATHWAY | Stabilization and expansion of the E-cadherin adherens junction |
| 0.0 | 0.1 | PID_IL23_PATHWAY | IL23-mediated signaling events |
| 0.0 | 0.5 | PID_RB_1PATHWAY | Regulation of retinoblastoma protein |
| 0.0 | 0.8 | PID_BETA_CATENIN_NUC_PATHWAY | Regulation of nuclear beta catenin signaling and target gene transcription |
| 0.0 | 0.7 | PID_RHOA_REG_PATHWAY | Regulation of RhoA activity |
| 0.0 | 0.3 | PID_TELOMERASE_PATHWAY | Regulation of Telomerase |
Gene overrepresentation in C2:CP:REACTOME category:
| Log-likelihood per target | Total log-likelihood | Term | Description |
|---|---|---|---|
| 1.1 | 3.3 | REACTOME_ENDOSOMAL_VACUOLAR_PATHWAY | Genes involved in Endosomal/Vacuolar pathway |
| 0.5 | 5.6 | REACTOME_AMINE_DERIVED_HORMONES | Genes involved in Amine-derived hormones |
| 0.3 | 5.9 | REACTOME_ACTIVATION_OF_THE_AP1_FAMILY_OF_TRANSCRIPTION_FACTORS | Genes involved in Activation of the AP-1 family of transcription factors |
| 0.3 | 3.9 | REACTOME_HDL_MEDIATED_LIPID_TRANSPORT | Genes involved in HDL-mediated lipid transport |
| 0.3 | 2.3 | REACTOME_PASSIVE_TRANSPORT_BY_AQUAPORINS | Genes involved in Passive Transport by Aquaporins |
| 0.3 | 4.4 | REACTOME_SIGNAL_REGULATORY_PROTEIN_SIRP_FAMILY_INTERACTIONS | Genes involved in Signal regulatory protein (SIRP) family interactions |
| 0.2 | 1.6 | REACTOME_THE_NLRP3_INFLAMMASOME | Genes involved in The NLRP3 inflammasome |
| 0.2 | 3.8 | REACTOME_AMINE_COMPOUND_SLC_TRANSPORTERS | Genes involved in Amine compound SLC transporters |
| 0.2 | 1.3 | REACTOME_TRANSPORT_OF_ORGANIC_ANIONS | Genes involved in Transport of organic anions |
| 0.1 | 1.3 | REACTOME_ADVANCED_GLYCOSYLATION_ENDPRODUCT_RECEPTOR_SIGNALING | Genes involved in Advanced glycosylation endproduct receptor signaling |
| 0.1 | 1.6 | REACTOME_TRAF6_MEDIATED_INDUCTION_OF_TAK1_COMPLEX | Genes involved in TRAF6 mediated induction of TAK1 complex |
| 0.1 | 2.6 | REACTOME_SULFUR_AMINO_ACID_METABOLISM | Genes involved in Sulfur amino acid metabolism |
| 0.1 | 1.6 | REACTOME_PLATELET_ADHESION_TO_EXPOSED_COLLAGEN | Genes involved in Platelet Adhesion to exposed collagen |
| 0.1 | 3.2 | REACTOME_GLUTATHIONE_CONJUGATION | Genes involved in Glutathione conjugation |
| 0.1 | 0.8 | REACTOME_GRB2_EVENTS_IN_ERBB2_SIGNALING | Genes involved in GRB2 events in ERBB2 signaling |
| 0.1 | 2.9 | REACTOME_CHEMOKINE_RECEPTORS_BIND_CHEMOKINES | Genes involved in Chemokine receptors bind chemokines |
| 0.1 | 1.4 | REACTOME_APOPTOSIS_INDUCED_DNA_FRAGMENTATION | Genes involved in Apoptosis induced DNA fragmentation |
| 0.1 | 0.6 | REACTOME_ORGANIC_CATION_ANION_ZWITTERION_TRANSPORT | Genes involved in Organic cation/anion/zwitterion transport |
| 0.1 | 0.7 | REACTOME_REPAIR_SYNTHESIS_FOR_GAP_FILLING_BY_DNA_POL_IN_TC_NER | Genes involved in Repair synthesis for gap-filling by DNA polymerase in TC-NER |
| 0.1 | 1.1 | REACTOME_IL_6_SIGNALING | Genes involved in Interleukin-6 signaling |
| 0.1 | 1.5 | REACTOME_MITOCHONDRIAL_FATTY_ACID_BETA_OXIDATION | Genes involved in Mitochondrial Fatty Acid Beta-Oxidation |
| 0.1 | 2.4 | REACTOME_AKT_PHOSPHORYLATES_TARGETS_IN_THE_CYTOSOL | Genes involved in AKT phosphorylates targets in the cytosol |
| 0.1 | 1.0 | REACTOME_NRIF_SIGNALS_CELL_DEATH_FROM_THE_NUCLEUS | Genes involved in NRIF signals cell death from the nucleus |
| 0.1 | 1.0 | REACTOME_REGULATION_OF_PYRUVATE_DEHYDROGENASE_PDH_COMPLEX | Genes involved in Regulation of pyruvate dehydrogenase (PDH) complex |
| 0.1 | 0.8 | REACTOME_FACILITATIVE_NA_INDEPENDENT_GLUCOSE_TRANSPORTERS | Genes involved in Facilitative Na+-independent glucose transporters |
| 0.1 | 0.6 | REACTOME_SYNTHESIS_SECRETION_AND_INACTIVATION_OF_GIP | Genes involved in Synthesis, Secretion, and Inactivation of Glucose-dependent Insulinotropic Polypeptide (GIP) |
| 0.1 | 0.3 | REACTOME_OLFACTORY_SIGNALING_PATHWAY | Genes involved in Olfactory Signaling Pathway |
| 0.1 | 5.3 | REACTOME_RESPONSE_TO_ELEVATED_PLATELET_CYTOSOLIC_CA2_ | Genes involved in Response to elevated platelet cytosolic Ca2+ |
| 0.1 | 0.2 | REACTOME_REGULATION_OF_COMPLEMENT_CASCADE | Genes involved in Regulation of Complement cascade |
| 0.1 | 0.4 | REACTOME_TRAFFICKING_AND_PROCESSING_OF_ENDOSOMAL_TLR | Genes involved in Trafficking and processing of endosomal TLR |
| 0.1 | 0.8 | REACTOME_SOS_MEDIATED_SIGNALLING | Genes involved in SOS-mediated signalling |
| 0.1 | 0.5 | REACTOME_REMOVAL_OF_THE_FLAP_INTERMEDIATE_FROM_THE_C_STRAND | Genes involved in Removal of the Flap Intermediate from the C-strand |
| 0.1 | 1.2 | REACTOME_REGULATION_OF_BETA_CELL_DEVELOPMENT | Genes involved in Regulation of beta-cell development |
| 0.1 | 1.8 | REACTOME_INTERFERON_ALPHA_BETA_SIGNALING | Genes involved in Interferon alpha/beta signaling |
| 0.0 | 0.8 | REACTOME_SYNTHESIS_OF_SUBSTRATES_IN_N_GLYCAN_BIOSYTHESIS | Genes involved in Synthesis of substrates in N-glycan biosythesis |
| 0.0 | 0.4 | REACTOME_BILE_SALT_AND_ORGANIC_ANION_SLC_TRANSPORTERS | Genes involved in Bile salt and organic anion SLC transporters |
| 0.0 | 1.4 | REACTOME_RNA_POL_III_TRANSCRIPTION_INITIATION_FROM_TYPE_2_PROMOTER | Genes involved in RNA Polymerase III Transcription Initiation From Type 2 Promoter |
| 0.0 | 0.5 | REACTOME_PURINE_CATABOLISM | Genes involved in Purine catabolism |
| 0.0 | 0.1 | REACTOME_INTRINSIC_PATHWAY | Genes involved in Intrinsic Pathway |
| 0.0 | 0.5 | REACTOME_GAP_JUNCTION_ASSEMBLY | Genes involved in Gap junction assembly |
| 0.0 | 1.0 | REACTOME_CELL_EXTRACELLULAR_MATRIX_INTERACTIONS | Genes involved in Cell-extracellular matrix interactions |
| 0.0 | 0.6 | REACTOME_DEGRADATION_OF_THE_EXTRACELLULAR_MATRIX | Genes involved in Degradation of the extracellular matrix |
| 0.0 | 0.6 | REACTOME_GLYCOGEN_BREAKDOWN_GLYCOGENOLYSIS | Genes involved in Glycogen breakdown (glycogenolysis) |
| 0.0 | 0.9 | REACTOME_NUCLEAR_EVENTS_KINASE_AND_TRANSCRIPTION_FACTOR_ACTIVATION | Genes involved in Nuclear Events (kinase and transcription factor activation) |
| 0.0 | 0.3 | REACTOME_P38MAPK_EVENTS | Genes involved in p38MAPK events |
| 0.0 | 1.4 | REACTOME_G1_PHASE | Genes involved in G1 Phase |
| 0.0 | 0.4 | REACTOME_DEPOSITION_OF_NEW_CENPA_CONTAINING_NUCLEOSOMES_AT_THE_CENTROMERE | Genes involved in Deposition of New CENPA-containing Nucleosomes at the Centromere |
| 0.0 | 0.7 | REACTOME_BRANCHED_CHAIN_AMINO_ACID_CATABOLISM | Genes involved in Branched-chain amino acid catabolism |
| 0.0 | 0.9 | REACTOME_ENDOSOMAL_SORTING_COMPLEX_REQUIRED_FOR_TRANSPORT_ESCRT | Genes involved in Endosomal Sorting Complex Required For Transport (ESCRT) |
| 0.0 | 0.7 | REACTOME_STRIATED_MUSCLE_CONTRACTION | Genes involved in Striated Muscle Contraction |
| 0.0 | 0.4 | REACTOME_SIGNALING_BY_CONSTITUTIVELY_ACTIVE_EGFR | Genes involved in Signaling by constitutively active EGFR |
| 0.0 | 1.5 | REACTOME_AMYLOIDS | Genes involved in Amyloids |
| 0.0 | 0.4 | REACTOME_NOTCH_HLH_TRANSCRIPTION_PATHWAY | Genes involved in Notch-HLH transcription pathway |
| 0.0 | 0.7 | REACTOME_BMAL1_CLOCK_NPAS2_ACTIVATES_CIRCADIAN_EXPRESSION | Genes involved in BMAL1:CLOCK/NPAS2 Activates Circadian Expression |
| 0.0 | 0.6 | REACTOME_PHASE1_FUNCTIONALIZATION_OF_COMPOUNDS | Genes involved in Phase 1 - Functionalization of compounds |
| 0.0 | 0.8 | REACTOME_GLYCOSPHINGOLIPID_METABOLISM | Genes involved in Glycosphingolipid metabolism |
| 0.0 | 0.5 | REACTOME_INTEGRIN_ALPHAIIB_BETA3_SIGNALING | Genes involved in Integrin alphaIIb beta3 signaling |
| 0.0 | 1.3 | REACTOME_EXTRACELLULAR_MATRIX_ORGANIZATION | Genes involved in Extracellular matrix organization |
| 0.0 | 0.7 | REACTOME_SEMA4D_INDUCED_CELL_MIGRATION_AND_GROWTH_CONE_COLLAPSE | Genes involved in Sema4D induced cell migration and growth-cone collapse |
| 0.0 | 0.6 | REACTOME_YAP1_AND_WWTR1_TAZ_STIMULATED_GENE_EXPRESSION | Genes involved in YAP1- and WWTR1 (TAZ)-stimulated gene expression |
| 0.0 | 2.2 | REACTOME_MITOTIC_PROMETAPHASE | Genes involved in Mitotic Prometaphase |
| 0.0 | 0.2 | REACTOME_CS_DS_DEGRADATION | Genes involved in CS/DS degradation |
| 0.0 | 0.4 | REACTOME_FORMATION_OF_ATP_BY_CHEMIOSMOTIC_COUPLING | Genes involved in Formation of ATP by chemiosmotic coupling |
| 0.0 | 1.8 | REACTOME_DNA_REPAIR | Genes involved in DNA Repair |
| 0.0 | 0.6 | REACTOME_ACTIVATION_OF_ATR_IN_RESPONSE_TO_REPLICATION_STRESS | Genes involved in Activation of ATR in response to replication stress |
| 0.0 | 0.3 | REACTOME_IMMUNOREGULATORY_INTERACTIONS_BETWEEN_A_LYMPHOID_AND_A_NON_LYMPHOID_CELL | Genes involved in Immunoregulatory interactions between a Lymphoid and a non-Lymphoid cell |
| 0.0 | 0.3 | REACTOME_ACTIVATION_OF_GENES_BY_ATF4 | Genes involved in Activation of Genes by ATF4 |
| 0.0 | 0.4 | REACTOME_AMINO_ACID_SYNTHESIS_AND_INTERCONVERSION_TRANSAMINATION | Genes involved in Amino acid synthesis and interconversion (transamination) |
| 0.0 | 0.3 | REACTOME_CITRIC_ACID_CYCLE_TCA_CYCLE | Genes involved in Citric acid cycle (TCA cycle) |
| 0.0 | 0.6 | REACTOME_APOPTOTIC_CLEAVAGE_OF_CELLULAR_PROTEINS | Genes involved in Apoptotic cleavage of cellular proteins |
| 0.0 | 0.4 | REACTOME_INTRINSIC_PATHWAY_FOR_APOPTOSIS | Genes involved in Intrinsic Pathway for Apoptosis |
| 0.0 | 0.5 | REACTOME_METABOLISM_OF_NON_CODING_RNA | Genes involved in Metabolism of non-coding RNA |
| 0.0 | 0.3 | REACTOME_ACTIVATED_NOTCH1_TRANSMITS_SIGNAL_TO_THE_NUCLEUS | Genes involved in Activated NOTCH1 Transmits Signal to the Nucleus |
| 0.0 | 0.4 | REACTOME_SYNTHESIS_OF_PA | Genes involved in Synthesis of PA |
| 0.0 | 0.2 | REACTOME_SIGNALING_BY_EGFR_IN_CANCER | Genes involved in Signaling by EGFR in Cancer |
| 0.0 | 1.0 | REACTOME_TRANSPORT_OF_INORGANIC_CATIONS_ANIONS_AND_AMINO_ACIDS_OLIGOPEPTIDES | Genes involved in Transport of inorganic cations/anions and amino acids/oligopeptides |