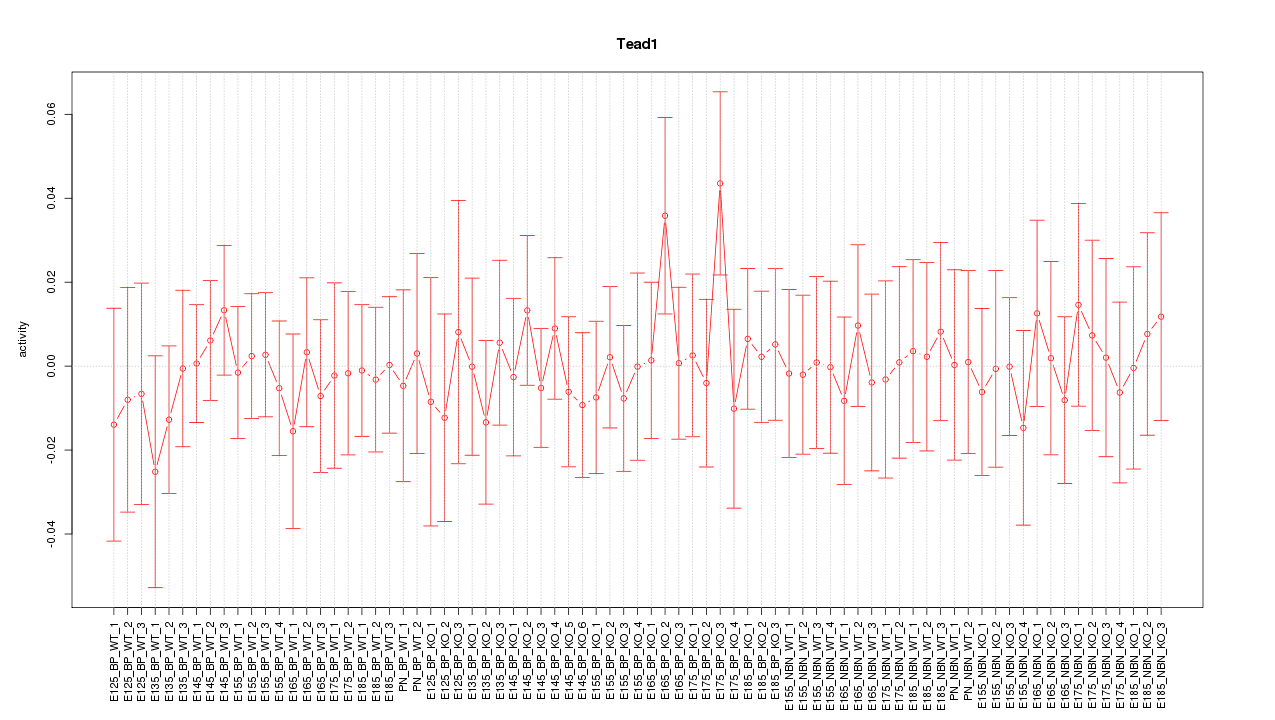
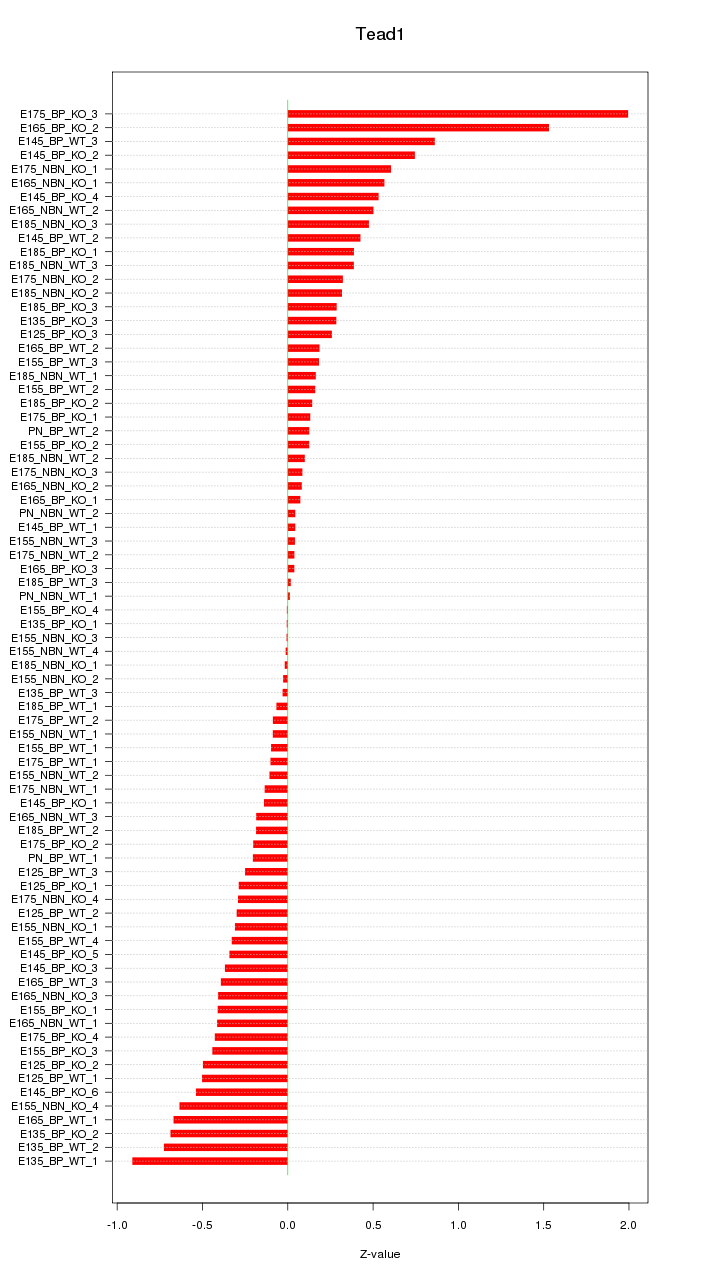
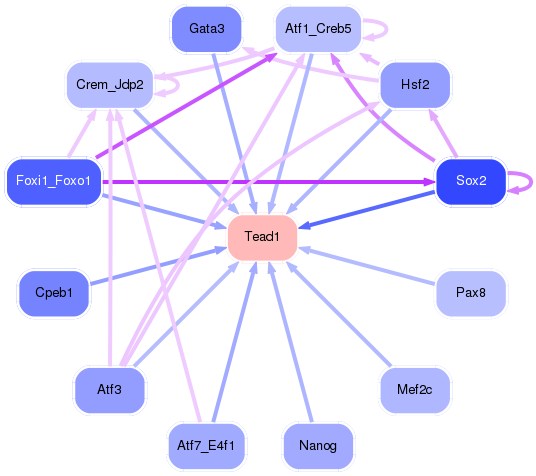
Motif ID: Tead1
Z-value: 0.452

Transcription factors associated with Tead1:
| Gene Symbol | Entrez ID | Gene Name |
|---|---|---|
| Tead1 | ENSMUSG00000055320.10 | Tead1 |
Activity-expression correlation:
| Gene Symbol | Promoter | Pearson corr. coef. | P-value | Plot |
|---|---|---|---|---|
| Tead1 | mm10_v2_chr7_+_112742025_112742060 | 0.07 | 5.6e-01 | Click! |

Top targets:
Gene overrepresentation in biological_process category:
| Log-likelihood per target | Total log-likelihood | Term | Description |
|---|---|---|---|
| 1.5 | 7.6 | GO:1903609 | negative regulation of peptidyl-tyrosine autophosphorylation(GO:1900085) negative regulation of inward rectifier potassium channel activity(GO:1903609) |
| 0.8 | 3.3 | GO:0070318 | positive regulation of G0 to G1 transition(GO:0070318) |
| 0.6 | 3.6 | GO:0032346 | positive regulation of aldosterone metabolic process(GO:0032346) positive regulation of aldosterone biosynthetic process(GO:0032349) leading edge cell differentiation(GO:0035026) regulation of Rho-dependent protein serine/threonine kinase activity(GO:2000298) |
| 0.4 | 1.2 | GO:0021529 | spinal cord oligodendrocyte cell differentiation(GO:0021529) spinal cord oligodendrocyte cell fate specification(GO:0021530) |
| 0.3 | 1.0 | GO:0033634 | positive regulation of cell-cell adhesion mediated by integrin(GO:0033634) |
| 0.3 | 2.8 | GO:0010839 | negative regulation of keratinocyte proliferation(GO:0010839) |
| 0.3 | 0.8 | GO:0009182 | purine deoxyribonucleoside diphosphate metabolic process(GO:0009182) dGDP metabolic process(GO:0046066) GDP metabolic process(GO:0046710) |
| 0.2 | 1.7 | GO:2000124 | regulation of endocannabinoid signaling pathway(GO:2000124) |
| 0.2 | 2.8 | GO:0031274 | positive regulation of pseudopodium assembly(GO:0031274) |
| 0.2 | 0.9 | GO:0051562 | negative regulation of mitochondrial calcium ion concentration(GO:0051562) |
| 0.2 | 0.6 | GO:0038165 | oncostatin-M-mediated signaling pathway(GO:0038165) regulation of interleukin-6-mediated signaling pathway(GO:0070103) negative regulation of interleukin-6-mediated signaling pathway(GO:0070104) |
| 0.2 | 0.8 | GO:0042360 | vitamin E metabolic process(GO:0042360) |
| 0.1 | 0.9 | GO:1901300 | positive regulation of hydrogen peroxide-mediated programmed cell death(GO:1901300) |
| 0.1 | 0.8 | GO:0043922 | negative regulation by host of viral transcription(GO:0043922) |
| 0.1 | 2.5 | GO:0033198 | response to ATP(GO:0033198) |
| 0.1 | 7.8 | GO:0030032 | lamellipodium assembly(GO:0030032) |
| 0.1 | 0.3 | GO:1990414 | replication-born double-strand break repair via sister chromatid exchange(GO:1990414) |
| 0.1 | 0.4 | GO:1902732 | positive regulation of chondrocyte proliferation(GO:1902732) |
| 0.1 | 0.7 | GO:0021894 | cerebral cortex GABAergic interneuron development(GO:0021894) |
| 0.1 | 0.4 | GO:2001168 | regulation of histone H2B ubiquitination(GO:2001166) positive regulation of histone H2B ubiquitination(GO:2001168) |
| 0.1 | 0.6 | GO:0007016 | cytoskeletal anchoring at plasma membrane(GO:0007016) |
| 0.1 | 0.5 | GO:0072257 | metanephric nephron tubule epithelial cell differentiation(GO:0072257) regulation of metanephric nephron tubule epithelial cell differentiation(GO:0072307) |
| 0.1 | 1.7 | GO:0070536 | protein K63-linked deubiquitination(GO:0070536) |
| 0.1 | 0.4 | GO:0044791 | modulation by host of viral release from host cell(GO:0044789) positive regulation by host of viral release from host cell(GO:0044791) |
| 0.1 | 0.3 | GO:1904491 | protein localization to ciliary transition zone(GO:1904491) |
| 0.0 | 0.3 | GO:0019673 | dolichol metabolic process(GO:0019348) GDP-mannose metabolic process(GO:0019673) |
| 0.0 | 0.2 | GO:0045657 | positive regulation of monocyte differentiation(GO:0045657) |
| 0.0 | 0.2 | GO:0006481 | C-terminal protein methylation(GO:0006481) |
| 0.0 | 1.2 | GO:0018345 | protein palmitoylation(GO:0018345) |
| 0.0 | 0.7 | GO:0060707 | trophoblast giant cell differentiation(GO:0060707) |
| 0.0 | 0.1 | GO:1904207 | chemokine (C-C motif) ligand 2 secretion(GO:0035926) regulation of chemokine (C-C motif) ligand 2 secretion(GO:1904207) positive regulation of chemokine (C-C motif) ligand 2 secretion(GO:1904209) |
| 0.0 | 2.3 | GO:0042058 | regulation of epidermal growth factor receptor signaling pathway(GO:0042058) |
| 0.0 | 0.2 | GO:0042699 | follicle-stimulating hormone signaling pathway(GO:0042699) |
| 0.0 | 0.8 | GO:2000637 | positive regulation of gene silencing by miRNA(GO:2000637) |
| 0.0 | 1.8 | GO:0070527 | platelet aggregation(GO:0070527) |
| 0.0 | 1.8 | GO:0032755 | positive regulation of interleukin-6 production(GO:0032755) |
| 0.0 | 0.1 | GO:1904395 | positive regulation of receptor clustering(GO:1903911) positive regulation of skeletal muscle acetylcholine-gated channel clustering(GO:1904395) |
| 0.0 | 0.9 | GO:0006890 | retrograde vesicle-mediated transport, Golgi to ER(GO:0006890) |
| 0.0 | 0.4 | GO:0042219 | cellular modified amino acid catabolic process(GO:0042219) |
| 0.0 | 0.6 | GO:0007520 | myoblast fusion(GO:0007520) |
| 0.0 | 0.4 | GO:0030325 | adrenal gland development(GO:0030325) |
Gene overrepresentation in cellular_component category:
| Log-likelihood per target | Total log-likelihood | Term | Description |
|---|---|---|---|
| 0.9 | 3.6 | GO:0070022 | transforming growth factor beta receptor homodimeric complex(GO:0070022) |
| 0.6 | 2.5 | GO:0008282 | ATP-sensitive potassium channel complex(GO:0008282) |
| 0.5 | 7.1 | GO:0034098 | VCP-NPL4-UFD1 AAA ATPase complex(GO:0034098) |
| 0.2 | 0.6 | GO:0005896 | interleukin-6 receptor complex(GO:0005896) |
| 0.1 | 1.1 | GO:0097197 | tetraspanin-enriched microdomain(GO:0097197) |
| 0.1 | 2.3 | GO:0016460 | myosin II complex(GO:0016460) |
| 0.1 | 1.6 | GO:0043196 | varicosity(GO:0043196) |
| 0.1 | 0.3 | GO:0033185 | dolichol-phosphate-mannose synthase complex(GO:0033185) |
| 0.1 | 8.0 | GO:0001725 | stress fiber(GO:0001725) contractile actin filament bundle(GO:0097517) |
| 0.1 | 3.3 | GO:0005801 | cis-Golgi network(GO:0005801) |
| 0.0 | 2.8 | GO:0001750 | photoreceptor outer segment(GO:0001750) |
| 0.0 | 0.6 | GO:0030126 | COPI vesicle coat(GO:0030126) |
| 0.0 | 0.7 | GO:0016010 | dystrophin-associated glycoprotein complex(GO:0016010) glycoprotein complex(GO:0090665) |
| 0.0 | 0.4 | GO:0008024 | cyclin/CDK positive transcription elongation factor complex(GO:0008024) |
| 0.0 | 0.1 | GO:0033269 | internode region of axon(GO:0033269) |
| 0.0 | 2.6 | GO:0005913 | cell-cell adherens junction(GO:0005913) |
| 0.0 | 0.2 | GO:0030877 | beta-catenin destruction complex(GO:0030877) |
| 0.0 | 0.1 | GO:0016600 | flotillin complex(GO:0016600) |
| 0.0 | 0.7 | GO:0031941 | filamentous actin(GO:0031941) |
| 0.0 | 3.2 | GO:0000139 | Golgi membrane(GO:0000139) |
Gene overrepresentation in molecular_function category:
| Log-likelihood per target | Total log-likelihood | Term | Description |
|---|---|---|---|
| 1.5 | 7.6 | GO:0070320 | inward rectifier potassium channel inhibitor activity(GO:0070320) |
| 0.8 | 2.5 | GO:0015272 | ATP-activated inward rectifier potassium channel activity(GO:0015272) |
| 0.3 | 1.0 | GO:0022833 | mechanically-gated ion channel activity(GO:0008381) mechanically gated channel activity(GO:0022833) |
| 0.3 | 3.6 | GO:0035615 | clathrin adaptor activity(GO:0035615) endocytic adaptor activity(GO:0098748) |
| 0.3 | 0.8 | GO:0044715 | 8-oxo-dGDP phosphatase activity(GO:0044715) |
| 0.2 | 0.9 | GO:0004699 | calcium-independent protein kinase C activity(GO:0004699) |
| 0.2 | 0.6 | GO:0004923 | leukemia inhibitory factor receptor activity(GO:0004923) oncostatin-M receptor activity(GO:0004924) |
| 0.2 | 1.4 | GO:0015379 | potassium:chloride symporter activity(GO:0015379) potassium ion symporter activity(GO:0022820) |
| 0.2 | 0.2 | GO:0031762 | alpha-1A adrenergic receptor binding(GO:0031691) alpha-1B adrenergic receptor binding(GO:0031692) follicle-stimulating hormone receptor binding(GO:0031762) |
| 0.2 | 1.8 | GO:0032036 | myosin heavy chain binding(GO:0032036) |
| 0.2 | 2.8 | GO:0098641 | cadherin binding involved in cell-cell adhesion(GO:0098641) |
| 0.2 | 3.3 | GO:0005520 | insulin-like growth factor binding(GO:0005520) |
| 0.1 | 2.8 | GO:0045295 | gamma-catenin binding(GO:0045295) |
| 0.1 | 1.7 | GO:0047372 | acylglycerol lipase activity(GO:0047372) |
| 0.1 | 0.4 | GO:0003839 | gamma-glutamylcyclotransferase activity(GO:0003839) |
| 0.1 | 0.3 | GO:0004582 | dolichyl-phosphate beta-D-mannosyltransferase activity(GO:0004582) |
| 0.1 | 0.6 | GO:0030274 | LIM domain binding(GO:0030274) |
| 0.1 | 0.3 | GO:0009378 | four-way junction helicase activity(GO:0009378) |
| 0.1 | 0.6 | GO:0035497 | cAMP response element binding(GO:0035497) |
| 0.0 | 0.4 | GO:0097322 | 7SK snRNA binding(GO:0097322) |
| 0.0 | 0.2 | GO:0003880 | protein C-terminal carboxyl O-methyltransferase activity(GO:0003880) |
| 0.0 | 1.2 | GO:0019707 | protein-cysteine S-palmitoyltransferase activity(GO:0019706) protein-cysteine S-acyltransferase activity(GO:0019707) |
| 0.0 | 0.7 | GO:0008510 | sodium:bicarbonate symporter activity(GO:0008510) |
| 0.0 | 1.2 | GO:0071837 | HMG box domain binding(GO:0071837) |
| 0.0 | 2.2 | GO:0004252 | serine-type endopeptidase activity(GO:0004252) |
| 0.0 | 0.9 | GO:0070888 | E-box binding(GO:0070888) |
| 0.0 | 0.2 | GO:0070016 | armadillo repeat domain binding(GO:0070016) |
| 0.0 | 1.7 | GO:0004843 | thiol-dependent ubiquitin-specific protease activity(GO:0004843) |
| 0.0 | 0.7 | GO:0003755 | peptidyl-prolyl cis-trans isomerase activity(GO:0003755) |
| 0.0 | 0.9 | GO:0001221 | transcription cofactor binding(GO:0001221) |
| 0.0 | 0.7 | GO:0017112 | Rab guanyl-nucleotide exchange factor activity(GO:0017112) |
| 0.0 | 0.1 | GO:0019911 | structural constituent of myelin sheath(GO:0019911) |
| 0.0 | 0.1 | GO:0008420 | CTD phosphatase activity(GO:0008420) |
| 0.0 | 5.1 | GO:0003779 | actin binding(GO:0003779) |
| 0.0 | 1.8 | GO:0001078 | transcriptional repressor activity, RNA polymerase II core promoter proximal region sequence-specific binding(GO:0001078) |
Gene overrepresentation in C2:CP category:
| Log-likelihood per target | Total log-likelihood | Term | Description |
|---|---|---|---|
| 0.2 | 7.0 | PID_WNT_CANONICAL_PATHWAY | Canonical Wnt signaling pathway |
| 0.1 | 7.1 | PID_TGFBR_PATHWAY | TGF-beta receptor signaling |
| 0.1 | 2.8 | PID_NFAT_TFPATHWAY | Calcineurin-regulated NFAT-dependent transcription in lymphocytes |
| 0.1 | 2.5 | PID_HNF3B_PATHWAY | FOXA2 and FOXA3 transcription factor networks |
| 0.1 | 0.9 | PID_LPA4_PATHWAY | LPA4-mediated signaling events |
| 0.0 | 1.4 | PID_HDAC_CLASSIII_PATHWAY | Signaling events mediated by HDAC Class III |
| 0.0 | 0.6 | PID_IL27_PATHWAY | IL27-mediated signaling events |
| 0.0 | 1.8 | PID_ILK_PATHWAY | Integrin-linked kinase signaling |
| 0.0 | 0.1 | ST_INTERFERON_GAMMA_PATHWAY | Interferon gamma pathway. |
| 0.0 | 0.6 | PID_NECTIN_PATHWAY | Nectin adhesion pathway |
| 0.0 | 0.9 | PID_RAC1_REG_PATHWAY | Regulation of RAC1 activity |
Gene overrepresentation in C2:CP:REACTOME category:
| Log-likelihood per target | Total log-likelihood | Term | Description |
|---|---|---|---|
| 0.4 | 9.2 | REACTOME_HORMONE_SENSITIVE_LIPASE_HSL_MEDIATED_TRIACYLGLYCEROL_HYDROLYSIS | Genes involved in Hormone-sensitive lipase (HSL)-mediated triacylglycerol hydrolysis |
| 0.3 | 8.4 | REACTOME_DCC_MEDIATED_ATTRACTIVE_SIGNALING | Genes involved in DCC mediated attractive signaling |
| 0.2 | 5.3 | REACTOME_RNA_POL_I_TRANSCRIPTION_TERMINATION | Genes involved in RNA Polymerase I Transcription Termination |
| 0.2 | 3.5 | REACTOME_GAP_JUNCTION_DEGRADATION | Genes involved in Gap junction degradation |
| 0.1 | 3.4 | REACTOME_YAP1_AND_WWTR1_TAZ_STIMULATED_GENE_EXPRESSION | Genes involved in YAP1- and WWTR1 (TAZ)-stimulated gene expression |
| 0.1 | 0.8 | REACTOME_HDL_MEDIATED_LIPID_TRANSPORT | Genes involved in HDL-mediated lipid transport |
| 0.1 | 1.8 | REACTOME_SEMA4D_INDUCED_CELL_MIGRATION_AND_GROWTH_CONE_COLLAPSE | Genes involved in Sema4D induced cell migration and growth-cone collapse |
| 0.1 | 0.6 | REACTOME_IL_6_SIGNALING | Genes involved in Interleukin-6 signaling |
| 0.1 | 0.6 | REACTOME_P130CAS_LINKAGE_TO_MAPK_SIGNALING_FOR_INTEGRINS | Genes involved in p130Cas linkage to MAPK signaling for integrins |
| 0.0 | 0.6 | REACTOME_COPI_MEDIATED_TRANSPORT | Genes involved in COPI Mediated Transport |
| 0.0 | 2.0 | REACTOME_INWARDLY_RECTIFYING_K_CHANNELS | Genes involved in Inwardly rectifying K+ channels |
| 0.0 | 0.9 | REACTOME_SIGNALING_BY_NODAL | Genes involved in Signaling by NODAL |
| 0.0 | 0.5 | REACTOME_POST_CHAPERONIN_TUBULIN_FOLDING_PATHWAY | Genes involved in Post-chaperonin tubulin folding pathway |
| 0.0 | 0.9 | REACTOME_EFFECTS_OF_PIP2_HYDROLYSIS | Genes involved in Effects of PIP2 hydrolysis |
| 0.0 | 2.2 | REACTOME_TRANSPORT_OF_INORGANIC_CATIONS_ANIONS_AND_AMINO_ACIDS_OLIGOPEPTIDES | Genes involved in Transport of inorganic cations/anions and amino acids/oligopeptides |
| 0.0 | 0.3 | REACTOME_SYNTHESIS_OF_SUBSTRATES_IN_N_GLYCAN_BIOSYTHESIS | Genes involved in Synthesis of substrates in N-glycan biosythesis |
| 0.0 | 0.6 | REACTOME_MYOGENESIS | Genes involved in Myogenesis |
| 0.0 | 0.4 | REACTOME_ELONGATION_ARREST_AND_RECOVERY | Genes involved in Elongation arrest and recovery |
| 0.0 | 1.1 | REACTOME_PPARA_ACTIVATES_GENE_EXPRESSION | Genes involved in PPARA Activates Gene Expression |
| 0.0 | 0.1 | REACTOME_G_ALPHA1213_SIGNALLING_EVENTS | Genes involved in G alpha (12/13) signalling events |