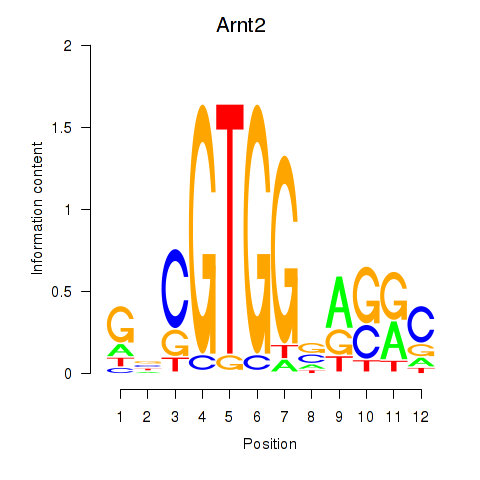
| 0.3 |
0.8 |
GO:0033364 |
endosome to lysosome transport via multivesicular body sorting pathway(GO:0032510) mast cell secretory granule organization(GO:0033364) |
| 0.1 |
0.4 |
GO:0071336 |
lung growth(GO:0060437) positive regulation of fat cell proliferation(GO:0070346) regulation of hair follicle cell proliferation(GO:0071336) positive regulation of hair follicle cell proliferation(GO:0071338) |
| 0.1 |
0.6 |
GO:0072318 |
clathrin coat disassembly(GO:0072318) |
| 0.1 |
0.4 |
GO:0032485 |
regulation of Ral protein signal transduction(GO:0032485) |
| 0.1 |
0.4 |
GO:1902031 |
regulation of NADP metabolic process(GO:1902031) |
| 0.0 |
0.0 |
GO:0033122 |
regulation of purine nucleotide catabolic process(GO:0033121) negative regulation of purine nucleotide catabolic process(GO:0033122) |
| 0.0 |
0.1 |
GO:1902915 |
negative regulation of protein K63-linked ubiquitination(GO:1900045) negative regulation of protein polyubiquitination(GO:1902915) |
| 0.0 |
0.6 |
GO:0046855 |
phosphorylated carbohydrate dephosphorylation(GO:0046838) inositol phosphate dephosphorylation(GO:0046855) |
| 0.0 |
0.1 |
GO:0070829 |
heterochromatin maintenance(GO:0070829) |
| 0.0 |
0.3 |
GO:0035721 |
intraciliary retrograde transport(GO:0035721) |
| 0.0 |
0.2 |
GO:0000055 |
ribosomal large subunit export from nucleus(GO:0000055) |
| 0.0 |
0.7 |
GO:0031571 |
mitotic G1 DNA damage checkpoint(GO:0031571) |
| 0.0 |
0.3 |
GO:0071218 |
cellular response to misfolded protein(GO:0071218) |
| 0.0 |
0.1 |
GO:0002317 |
plasma cell differentiation(GO:0002317) |
| 0.0 |
1.6 |
GO:0007050 |
cell cycle arrest(GO:0007050) |
| 0.0 |
0.1 |
GO:0060056 |
mammary gland involution(GO:0060056) |


