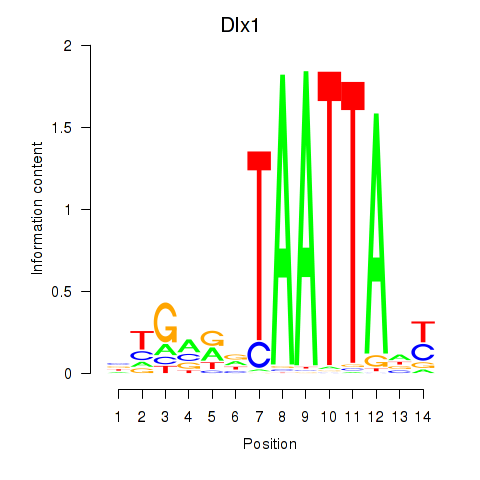
Motif ID: Dlx1
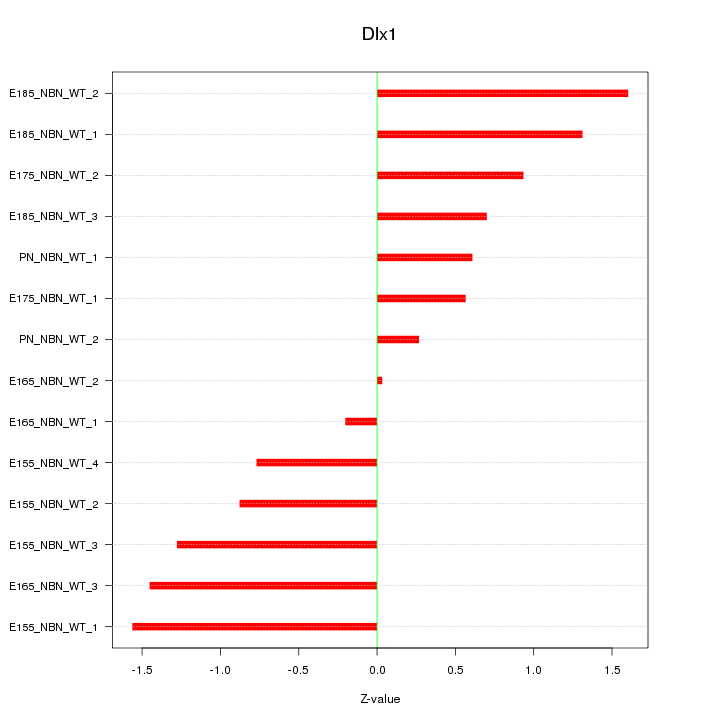
Z-value: 1.000
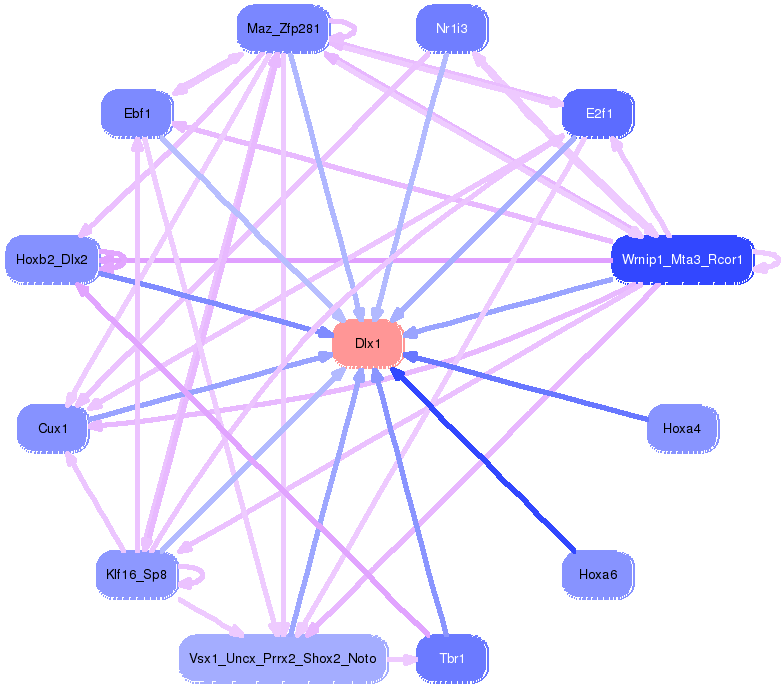
Transcription factors associated with Dlx1:
| Gene Symbol | Entrez ID | Gene Name |
|---|---|---|
| Dlx1 | ENSMUSG00000041911.3 | Dlx1 |
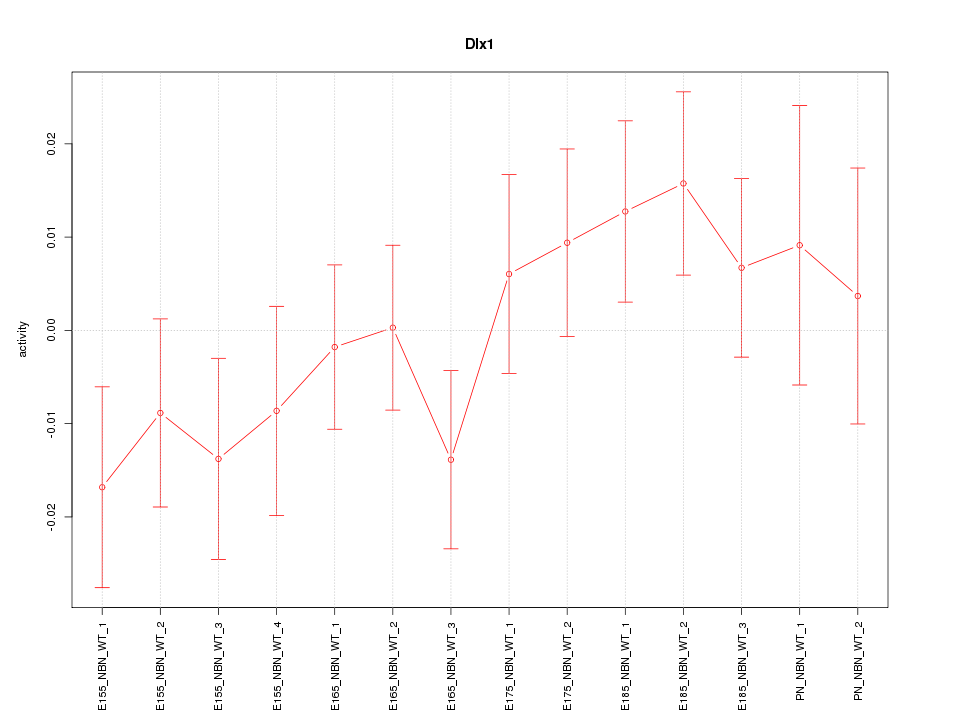
Activity-expression correlation:
| Gene Symbol | Promoter | Pearson corr. coef. | P-value | Plot |
|---|---|---|---|---|
| Dlx1 | mm10_v2_chr2_+_71529085_71529110 | 0.77 | 1.4e-03 | Click! |

Top targets:
Gene overrepresentation in biological_process category:
| Log-likelihood per target | Total log-likelihood | Term | Description |
|---|---|---|---|
| 0.9 | 2.7 | GO:0008228 | opsonization(GO:0008228) modulation of molecular function in other organism(GO:0044359) negative regulation of molecular function in other organism(GO:0044362) negative regulation of molecular function in other organism involved in symbiotic interaction(GO:0052204) modulation of molecular function in other organism involved in symbiotic interaction(GO:0052205) negative regulation by host of symbiont molecular function(GO:0052405) modification by host of symbiont molecular function(GO:0052428) |
| 0.6 | 2.6 | GO:0072592 | oxygen metabolic process(GO:0072592) |
| 0.6 | 1.8 | GO:0046368 | GDP-L-fucose metabolic process(GO:0046368) |
| 0.5 | 2.0 | GO:0010700 | negative regulation of norepinephrine secretion(GO:0010700) |
| 0.5 | 2.8 | GO:0036233 | glycine import(GO:0036233) |
| 0.4 | 1.3 | GO:2000314 | negative regulation of fibroblast growth factor receptor signaling pathway involved in neural plate anterior/posterior pattern formation(GO:2000314) |
| 0.4 | 1.8 | GO:0046552 | eye photoreceptor cell fate commitment(GO:0042706) photoreceptor cell fate commitment(GO:0046552) |
| 0.4 | 1.2 | GO:1904395 | retinal rod cell differentiation(GO:0060221) regulation of skeletal muscle acetylcholine-gated channel clustering(GO:1904393) positive regulation of skeletal muscle acetylcholine-gated channel clustering(GO:1904395) |
| 0.4 | 3.1 | GO:0033353 | S-adenosylmethionine cycle(GO:0033353) |
| 0.4 | 1.5 | GO:0043490 | malate-aspartate shuttle(GO:0043490) |
| 0.4 | 1.1 | GO:1902498 | regulation of protein autoubiquitination(GO:1902498) |
| 0.4 | 1.4 | GO:0032788 | saturated monocarboxylic acid metabolic process(GO:0032788) unsaturated monocarboxylic acid metabolic process(GO:0032789) |
| 0.3 | 1.2 | GO:0006538 | glutamate catabolic process(GO:0006538) |
| 0.3 | 2.0 | GO:0019532 | oxalate transport(GO:0019532) |
| 0.3 | 0.8 | GO:0009193 | pyrimidine ribonucleoside diphosphate metabolic process(GO:0009193) UDP metabolic process(GO:0046048) |
| 0.2 | 0.7 | GO:0033364 | mast cell secretory granule organization(GO:0033364) |
| 0.2 | 0.7 | GO:2000564 | CD8-positive, alpha-beta T cell proliferation(GO:0035740) regulation of CD8-positive, alpha-beta T cell proliferation(GO:2000564) positive regulation of CD8-positive, alpha-beta T cell activation(GO:2001187) |
| 0.2 | 0.7 | GO:0072204 | cell-cell signaling involved in kidney development(GO:0060995) Wnt signaling pathway involved in kidney development(GO:0061289) canonical Wnt signaling pathway involved in metanephric kidney development(GO:0061290) cell-cell signaling involved in metanephros development(GO:0072204) |
| 0.2 | 0.7 | GO:0002554 | serotonin secretion by platelet(GO:0002554) interleukin-3 production(GO:0032632) beta selection(GO:0043366) |
| 0.2 | 1.6 | GO:0006686 | sphingomyelin biosynthetic process(GO:0006686) |
| 0.2 | 1.5 | GO:0010273 | detoxification of copper ion(GO:0010273) stress response to copper ion(GO:1990169) |
| 0.2 | 0.6 | GO:0010898 | positive regulation of triglyceride catabolic process(GO:0010898) |
| 0.2 | 2.2 | GO:0051923 | sulfation(GO:0051923) |
| 0.2 | 1.3 | GO:1990118 | sodium ion import across plasma membrane(GO:0098719) sodium ion import into cell(GO:1990118) |
| 0.2 | 0.9 | GO:0030091 | protein repair(GO:0030091) |
| 0.2 | 0.5 | GO:2001180 | negative regulation of interleukin-18 production(GO:0032701) negative regulation of interleukin-10 secretion(GO:2001180) |
| 0.2 | 1.9 | GO:0006120 | mitochondrial electron transport, NADH to ubiquinone(GO:0006120) |
| 0.2 | 2.9 | GO:0006953 | acute-phase response(GO:0006953) |
| 0.1 | 1.2 | GO:0045743 | positive regulation of fibroblast growth factor receptor signaling pathway(GO:0045743) |
| 0.1 | 2.0 | GO:0051482 | positive regulation of cytosolic calcium ion concentration involved in phospholipase C-activating G-protein coupled signaling pathway(GO:0051482) |
| 0.1 | 0.4 | GO:0006419 | alanyl-tRNA aminoacylation(GO:0006419) |
| 0.1 | 2.4 | GO:0002495 | antigen processing and presentation of peptide antigen via MHC class II(GO:0002495) |
| 0.1 | 0.4 | GO:0046110 | xanthine metabolic process(GO:0046110) |
| 0.1 | 0.6 | GO:0042167 | heme catabolic process(GO:0042167) pigment catabolic process(GO:0046149) |
| 0.1 | 0.6 | GO:0033762 | response to glucagon(GO:0033762) |
| 0.1 | 0.5 | GO:1900533 | medium-chain fatty-acyl-CoA catabolic process(GO:0036114) long-chain fatty-acyl-CoA catabolic process(GO:0036116) palmitic acid metabolic process(GO:1900533) palmitic acid biosynthetic process(GO:1900535) |
| 0.1 | 0.3 | GO:0043988 | histone H3-S28 phosphorylation(GO:0043988) |
| 0.1 | 0.3 | GO:1902528 | regulation of protein linear polyubiquitination(GO:1902528) positive regulation of protein linear polyubiquitination(GO:1902530) |
| 0.1 | 0.8 | GO:2000809 | neuroligin clustering involved in postsynaptic membrane assembly(GO:0097118) positive regulation of synaptic vesicle clustering(GO:2000809) |
| 0.1 | 0.5 | GO:0015819 | lysine transport(GO:0015819) |
| 0.1 | 0.5 | GO:0051661 | maintenance of centrosome location(GO:0051661) |
| 0.1 | 0.5 | GO:0040031 | snRNA modification(GO:0040031) |
| 0.1 | 0.4 | GO:0010749 | regulation of nitric oxide mediated signal transduction(GO:0010749) |
| 0.1 | 0.4 | GO:0006742 | NADP catabolic process(GO:0006742) pyridine nucleotide catabolic process(GO:0019364) |
| 0.1 | 1.1 | GO:0045741 | positive regulation of epidermal growth factor-activated receptor activity(GO:0045741) |
| 0.1 | 0.6 | GO:0045002 | double-strand break repair via single-strand annealing(GO:0045002) |
| 0.1 | 0.3 | GO:0006990 | positive regulation of transcription from RNA polymerase II promoter involved in unfolded protein response(GO:0006990) |
| 0.1 | 2.3 | GO:0015985 | energy coupled proton transport, down electrochemical gradient(GO:0015985) ATP synthesis coupled proton transport(GO:0015986) |
| 0.1 | 0.3 | GO:1901475 | pyruvate transmembrane transport(GO:1901475) |
| 0.1 | 2.2 | GO:0007214 | gamma-aminobutyric acid signaling pathway(GO:0007214) |
| 0.1 | 0.2 | GO:0060126 | positive regulation of inositol trisphosphate biosynthetic process(GO:0032962) somatotropin secreting cell differentiation(GO:0060126) |
| 0.1 | 0.3 | GO:0010808 | positive regulation of synaptic vesicle priming(GO:0010808) positive regulation of synaptic vesicle exocytosis(GO:2000302) |
| 0.1 | 0.3 | GO:0006041 | glucosamine metabolic process(GO:0006041) |
| 0.1 | 0.5 | GO:0061087 | positive regulation of histone H3-K27 methylation(GO:0061087) |
| 0.1 | 1.0 | GO:0048240 | sperm capacitation(GO:0048240) |
| 0.1 | 0.4 | GO:0042127 | regulation of cell proliferation(GO:0042127) |
| 0.1 | 0.7 | GO:0051001 | negative regulation of nitric-oxide synthase activity(GO:0051001) |
| 0.1 | 0.4 | GO:0032713 | negative regulation of interleukin-4 production(GO:0032713) |
| 0.1 | 0.5 | GO:0042415 | norepinephrine metabolic process(GO:0042415) |
| 0.1 | 0.2 | GO:0031038 | myosin II filament organization(GO:0031038) regulation of myosin II filament organization(GO:0043519) |
| 0.1 | 0.3 | GO:0072488 | ammonium transmembrane transport(GO:0072488) |
| 0.1 | 1.5 | GO:1902259 | regulation of delayed rectifier potassium channel activity(GO:1902259) |
| 0.1 | 0.3 | GO:0036518 | chemorepulsion of dopaminergic neuron axon(GO:0036518) |
| 0.1 | 1.3 | GO:0006907 | pinocytosis(GO:0006907) |
| 0.1 | 0.7 | GO:0090162 | establishment of epithelial cell polarity(GO:0090162) |
| 0.1 | 0.5 | GO:0036158 | outer dynein arm assembly(GO:0036158) |
| 0.1 | 0.8 | GO:0032367 | intracellular cholesterol transport(GO:0032367) |
| 0.1 | 2.0 | GO:0071384 | cellular response to corticosteroid stimulus(GO:0071384) cellular response to glucocorticoid stimulus(GO:0071385) |
| 0.1 | 0.5 | GO:0045719 | negative regulation of glycogen biosynthetic process(GO:0045719) negative regulation of glycogen metabolic process(GO:0070874) |
| 0.1 | 0.3 | GO:0046602 | regulation of mitotic centrosome separation(GO:0046602) |
| 0.1 | 0.9 | GO:0072520 | seminiferous tubule development(GO:0072520) |
| 0.1 | 0.2 | GO:0006556 | S-adenosylmethionine biosynthetic process(GO:0006556) |
| 0.1 | 0.4 | GO:0032020 | ISG15-protein conjugation(GO:0032020) |
| 0.1 | 0.3 | GO:0098789 | pre-mRNA cleavage required for polyadenylation(GO:0098789) |
| 0.1 | 0.5 | GO:0010457 | centriole-centriole cohesion(GO:0010457) |
| 0.1 | 0.6 | GO:0006268 | DNA unwinding involved in DNA replication(GO:0006268) |
| 0.1 | 0.3 | GO:0045583 | regulation of cytotoxic T cell differentiation(GO:0045583) positive regulation of cytotoxic T cell differentiation(GO:0045585) |
| 0.0 | 0.4 | GO:0000712 | resolution of meiotic recombination intermediates(GO:0000712) |
| 0.0 | 0.1 | GO:0033278 | cell proliferation in midbrain(GO:0033278) |
| 0.0 | 0.1 | GO:0044340 | canonical Wnt signaling pathway involved in regulation of cell proliferation(GO:0044340) |
| 0.0 | 0.3 | GO:0010908 | regulation of heparan sulfate proteoglycan biosynthetic process(GO:0010908) positive regulation of heparan sulfate proteoglycan biosynthetic process(GO:0010909) canonical Wnt signaling pathway involved in positive regulation of epithelial to mesenchymal transition(GO:0044334) myoblast fate commitment(GO:0048625) positive regulation of proteoglycan biosynthetic process(GO:1902730) |
| 0.0 | 0.8 | GO:0007614 | short-term memory(GO:0007614) |
| 0.0 | 0.2 | GO:0035609 | C-terminal protein deglutamylation(GO:0035609) |
| 0.0 | 0.2 | GO:1990564 | protein polyufmylation(GO:1990564) protein K69-linked ufmylation(GO:1990592) |
| 0.0 | 0.4 | GO:0071578 | zinc II ion transmembrane import(GO:0071578) |
| 0.0 | 0.1 | GO:0035610 | protein side chain deglutamylation(GO:0035610) |
| 0.0 | 0.2 | GO:2001022 | positive regulation of response to DNA damage stimulus(GO:2001022) |
| 0.0 | 1.2 | GO:0032728 | positive regulation of interferon-beta production(GO:0032728) |
| 0.0 | 0.7 | GO:0006677 | glycosylceramide metabolic process(GO:0006677) |
| 0.0 | 0.2 | GO:0051012 | microtubule sliding(GO:0051012) negative regulation of nonmotile primary cilium assembly(GO:1902856) |
| 0.0 | 1.1 | GO:0010972 | negative regulation of G2/M transition of mitotic cell cycle(GO:0010972) |
| 0.0 | 0.3 | GO:0036462 | TRAIL-activated apoptotic signaling pathway(GO:0036462) |
| 0.0 | 0.7 | GO:0030212 | hyaluronan metabolic process(GO:0030212) |
| 0.0 | 0.3 | GO:0042754 | histone H3-K9 dimethylation(GO:0036123) negative regulation of circadian rhythm(GO:0042754) |
| 0.0 | 0.1 | GO:0090365 | regulation of mRNA modification(GO:0090365) |
| 0.0 | 0.2 | GO:0016584 | nucleosome positioning(GO:0016584) |
| 0.0 | 0.3 | GO:0019985 | translesion synthesis(GO:0019985) |
| 0.0 | 0.2 | GO:0016255 | attachment of GPI anchor to protein(GO:0016255) |
| 0.0 | 0.5 | GO:0043968 | histone H2A acetylation(GO:0043968) |
| 0.0 | 0.2 | GO:0097186 | amelogenesis(GO:0097186) |
| 0.0 | 0.6 | GO:0046827 | positive regulation of protein export from nucleus(GO:0046827) |
| 0.0 | 0.9 | GO:0007200 | phospholipase C-activating G-protein coupled receptor signaling pathway(GO:0007200) |
| 0.0 | 0.1 | GO:0031509 | telomeric heterochromatin assembly(GO:0031509) negative regulation of chromosome condensation(GO:1902340) |
| 0.0 | 0.2 | GO:0002523 | leukocyte migration involved in inflammatory response(GO:0002523) |
| 0.0 | 1.9 | GO:0019882 | antigen processing and presentation(GO:0019882) |
| 0.0 | 0.1 | GO:0006668 | sphinganine-1-phosphate metabolic process(GO:0006668) |
| 0.0 | 0.3 | GO:0030497 | fatty acid elongation(GO:0030497) |
| 0.0 | 0.1 | GO:0006592 | ornithine biosynthetic process(GO:0006592) |
| 0.0 | 0.1 | GO:0051694 | pointed-end actin filament capping(GO:0051694) |
| 0.0 | 1.0 | GO:0022900 | electron transport chain(GO:0022900) |
| 0.0 | 0.9 | GO:0019228 | neuronal action potential(GO:0019228) |
| 0.0 | 0.3 | GO:0090051 | negative regulation of cell migration involved in sprouting angiogenesis(GO:0090051) |
| 0.0 | 0.1 | GO:0000389 | generation of catalytic spliceosome for second transesterification step(GO:0000350) mRNA 3'-splice site recognition(GO:0000389) |
| 0.0 | 0.4 | GO:0006491 | N-glycan processing(GO:0006491) |
| 0.0 | 0.5 | GO:0031365 | N-terminal protein amino acid modification(GO:0031365) |
| 0.0 | 0.0 | GO:0097089 | methyl-branched fatty acid metabolic process(GO:0097089) |
| 0.0 | 0.1 | GO:0006451 | selenocysteine incorporation(GO:0001514) translational readthrough(GO:0006451) |
| 0.0 | 0.2 | GO:0090557 | establishment of endothelial intestinal barrier(GO:0090557) |
| 0.0 | 0.1 | GO:0046208 | spermine catabolic process(GO:0046208) |
| 0.0 | 0.3 | GO:0045653 | negative regulation of megakaryocyte differentiation(GO:0045653) |
| 0.0 | 0.3 | GO:0034508 | centromere complex assembly(GO:0034508) |
| 0.0 | 0.1 | GO:0071392 | cellular response to estradiol stimulus(GO:0071392) |
| 0.0 | 0.2 | GO:0039702 | viral budding via host ESCRT complex(GO:0039702) |
| 0.0 | 0.3 | GO:0001921 | positive regulation of receptor recycling(GO:0001921) |
| 0.0 | 0.1 | GO:0000478 | endonucleolytic cleavage involved in rRNA processing(GO:0000478) |
| 0.0 | 0.1 | GO:0006977 | DNA damage response, signal transduction by p53 class mediator resulting in cell cycle arrest(GO:0006977) |
| 0.0 | 0.0 | GO:0007525 | somatic muscle development(GO:0007525) |
| 0.0 | 0.3 | GO:0000027 | ribosomal large subunit assembly(GO:0000027) |
| 0.0 | 1.4 | GO:0006909 | phagocytosis(GO:0006909) |
| 0.0 | 0.3 | GO:0032008 | positive regulation of TOR signaling(GO:0032008) |
Gene overrepresentation in cellular_component category:
| Log-likelihood per target | Total log-likelihood | Term | Description |
|---|---|---|---|
| 0.2 | 2.7 | GO:0000276 | mitochondrial proton-transporting ATP synthase complex, coupling factor F(o)(GO:0000276) |
| 0.2 | 0.9 | GO:0030121 | AP-1 adaptor complex(GO:0030121) |
| 0.2 | 0.8 | GO:0071438 | NADPH oxidase complex(GO:0043020) invadopodium membrane(GO:0071438) |
| 0.2 | 0.7 | GO:0019815 | B cell receptor complex(GO:0019815) |
| 0.2 | 0.8 | GO:0036056 | filtration diaphragm(GO:0036056) slit diaphragm(GO:0036057) |
| 0.2 | 1.6 | GO:0000138 | Golgi trans cisterna(GO:0000138) |
| 0.1 | 4.1 | GO:0032588 | trans-Golgi network membrane(GO:0032588) |
| 0.1 | 0.9 | GO:0005828 | kinetochore microtubule(GO:0005828) |
| 0.1 | 1.8 | GO:0032580 | Golgi cisterna membrane(GO:0032580) |
| 0.1 | 2.2 | GO:1902710 | GABA receptor complex(GO:1902710) GABA-A receptor complex(GO:1902711) |
| 0.1 | 0.6 | GO:0000444 | MIS12/MIND type complex(GO:0000444) |
| 0.1 | 0.5 | GO:0036449 | microtubule minus-end(GO:0036449) |
| 0.1 | 0.7 | GO:0042629 | mast cell granule(GO:0042629) |
| 0.1 | 1.5 | GO:0043205 | fibril(GO:0043205) |
| 0.1 | 0.3 | GO:0030690 | Noc1p-Noc2p complex(GO:0030690) |
| 0.1 | 1.1 | GO:0035686 | sperm fibrous sheath(GO:0035686) |
| 0.1 | 5.7 | GO:0070469 | respiratory chain(GO:0070469) |
| 0.1 | 0.3 | GO:0032133 | chromosome passenger complex(GO:0032133) |
| 0.1 | 3.3 | GO:0030672 | synaptic vesicle membrane(GO:0030672) exocytic vesicle membrane(GO:0099501) |
| 0.1 | 0.5 | GO:0033269 | internode region of axon(GO:0033269) |
| 0.1 | 0.3 | GO:0033553 | rDNA heterochromatin(GO:0033553) |
| 0.1 | 0.3 | GO:0097226 | sperm mitochondrial sheath(GO:0097226) |
| 0.1 | 1.0 | GO:0016010 | dystrophin-associated glycoprotein complex(GO:0016010) glycoprotein complex(GO:0090665) |
| 0.1 | 0.3 | GO:0031313 | extrinsic component of endosome membrane(GO:0031313) |
| 0.1 | 0.2 | GO:0048269 | methionine adenosyltransferase complex(GO:0048269) |
| 0.1 | 0.7 | GO:0042612 | MHC class I protein complex(GO:0042612) |
| 0.1 | 0.3 | GO:1990131 | EGO complex(GO:0034448) Gtr1-Gtr2 GTPase complex(GO:1990131) |
| 0.0 | 0.4 | GO:0016272 | prefoldin complex(GO:0016272) |
| 0.0 | 0.6 | GO:0005662 | DNA replication factor A complex(GO:0005662) |
| 0.0 | 0.1 | GO:0070557 | PCNA-p21 complex(GO:0070557) |
| 0.0 | 0.2 | GO:0034709 | methylosome(GO:0034709) |
| 0.0 | 1.0 | GO:0055038 | recycling endosome membrane(GO:0055038) |
| 0.0 | 0.3 | GO:0070369 | beta-catenin-TCF7L2 complex(GO:0070369) |
| 0.0 | 0.2 | GO:0042765 | GPI-anchor transamidase complex(GO:0042765) |
| 0.0 | 0.1 | GO:0097149 | centralspindlin complex(GO:0097149) |
| 0.0 | 0.2 | GO:0030915 | Smc5-Smc6 complex(GO:0030915) |
| 0.0 | 0.3 | GO:0005687 | U4 snRNP(GO:0005687) |
| 0.0 | 0.2 | GO:0030478 | actin cap(GO:0030478) |
| 0.0 | 0.2 | GO:0000815 | ESCRT III complex(GO:0000815) |
| 0.0 | 0.2 | GO:0046581 | intercellular canaliculus(GO:0046581) |
| 0.0 | 0.5 | GO:0043189 | NuA4 histone acetyltransferase complex(GO:0035267) H4/H2A histone acetyltransferase complex(GO:0043189) H4 histone acetyltransferase complex(GO:1902562) |
| 0.0 | 1.7 | GO:0008076 | voltage-gated potassium channel complex(GO:0008076) |
| 0.0 | 1.4 | GO:0009925 | basal plasma membrane(GO:0009925) |
| 0.0 | 0.1 | GO:0036195 | muscle cell projection(GO:0036194) muscle cell projection membrane(GO:0036195) |
| 0.0 | 0.3 | GO:0005847 | mRNA cleavage and polyadenylation specificity factor complex(GO:0005847) |
| 0.0 | 0.1 | GO:0016327 | apicolateral plasma membrane(GO:0016327) |
| 0.0 | 0.2 | GO:0031932 | TORC2 complex(GO:0031932) |
| 0.0 | 0.9 | GO:0005811 | lipid particle(GO:0005811) |
| 0.0 | 0.9 | GO:0031594 | neuromuscular junction(GO:0031594) |
| 0.0 | 1.1 | GO:0001669 | acrosomal vesicle(GO:0001669) |
| 0.0 | 0.3 | GO:0000159 | protein phosphatase type 2A complex(GO:0000159) |
| 0.0 | 0.2 | GO:0000940 | condensed chromosome outer kinetochore(GO:0000940) |
| 0.0 | 1.5 | GO:0043204 | perikaryon(GO:0043204) |
| 0.0 | 0.6 | GO:0001750 | photoreceptor outer segment(GO:0001750) |
| 0.0 | 0.1 | GO:0005744 | mitochondrial inner membrane presequence translocase complex(GO:0005744) |
| 0.0 | 0.3 | GO:0048786 | presynaptic active zone(GO:0048786) |
| 0.0 | 0.4 | GO:0032391 | photoreceptor connecting cilium(GO:0032391) |
| 0.0 | 0.8 | GO:0072562 | blood microparticle(GO:0072562) |
| 0.0 | 1.3 | GO:0005923 | bicellular tight junction(GO:0005923) |
Gene overrepresentation in molecular_function category:
| Log-likelihood per target | Total log-likelihood | Term | Description |
|---|---|---|---|
| 0.7 | 2.2 | GO:0050656 | 3'-phosphoadenosine 5'-phosphosulfate binding(GO:0050656) |
| 0.7 | 2.0 | GO:0019770 | IgG receptor activity(GO:0019770) |
| 0.5 | 2.7 | GO:0001849 | complement component C1q binding(GO:0001849) |
| 0.5 | 2.8 | GO:0015375 | glycine:sodium symporter activity(GO:0015375) |
| 0.4 | 3.1 | GO:0004013 | adenosylhomocysteinase activity(GO:0004013) trialkylsulfonium hydrolase activity(GO:0016802) |
| 0.4 | 1.2 | GO:0035373 | chondroitin sulfate proteoglycan binding(GO:0035373) |
| 0.4 | 1.6 | GO:0033188 | sphingomyelin synthase activity(GO:0033188) ceramide cholinephosphotransferase activity(GO:0047493) |
| 0.3 | 0.8 | GO:0030171 | voltage-gated proton channel activity(GO:0030171) |
| 0.2 | 2.0 | GO:0070290 | N-acylphosphatidylethanolamine-specific phospholipase D activity(GO:0070290) |
| 0.2 | 1.1 | GO:0005314 | high-affinity glutamate transmembrane transporter activity(GO:0005314) |
| 0.2 | 0.6 | GO:0008534 | oxidized purine nucleobase lesion DNA N-glycosylase activity(GO:0008534) |
| 0.2 | 1.4 | GO:0045028 | G-protein coupled nucleotide receptor activity(GO:0001608) G-protein coupled adenosine receptor activity(GO:0001609) G-protein coupled purinergic nucleotide receptor activity(GO:0045028) |
| 0.2 | 2.0 | GO:0019531 | oxalate transmembrane transporter activity(GO:0019531) |
| 0.2 | 1.2 | GO:0004351 | glutamate decarboxylase activity(GO:0004351) |
| 0.2 | 0.6 | GO:0004074 | biliverdin reductase activity(GO:0004074) |
| 0.2 | 1.3 | GO:0005451 | monovalent cation:proton antiporter activity(GO:0005451) sodium:proton antiporter activity(GO:0015385) potassium:proton antiporter activity(GO:0015386) |
| 0.2 | 4.8 | GO:0050136 | NADH dehydrogenase (ubiquinone) activity(GO:0008137) NADH dehydrogenase (quinone) activity(GO:0050136) |
| 0.1 | 2.9 | GO:0042287 | MHC protein binding(GO:0042287) |
| 0.1 | 0.9 | GO:0008321 | Ral guanyl-nucleotide exchange factor activity(GO:0008321) |
| 0.1 | 2.9 | GO:0005044 | scavenger receptor activity(GO:0005044) |
| 0.1 | 0.8 | GO:0070699 | type II activin receptor binding(GO:0070699) |
| 0.1 | 0.6 | GO:0032422 | purine-rich negative regulatory element binding(GO:0032422) |
| 0.1 | 0.4 | GO:0004813 | alanine-tRNA ligase activity(GO:0004813) |
| 0.1 | 2.2 | GO:0004181 | metallocarboxypeptidase activity(GO:0004181) |
| 0.1 | 2.2 | GO:0004890 | GABA-A receptor activity(GO:0004890) |
| 0.1 | 1.9 | GO:0016290 | palmitoyl-CoA hydrolase activity(GO:0016290) |
| 0.1 | 0.8 | GO:0045134 | uridine-diphosphatase activity(GO:0045134) |
| 0.1 | 0.3 | GO:0035402 | histone kinase activity (H3-T11 specific)(GO:0035402) |
| 0.1 | 0.8 | GO:0001665 | alpha-N-acetylgalactosaminide alpha-2,6-sialyltransferase activity(GO:0001665) |
| 0.1 | 0.3 | GO:0019166 | trans-2-enoyl-CoA reductase (NADPH) activity(GO:0019166) |
| 0.1 | 0.4 | GO:0030151 | molybdenum ion binding(GO:0030151) |
| 0.1 | 0.9 | GO:0035615 | clathrin adaptor activity(GO:0035615) endocytic adaptor activity(GO:0098748) |
| 0.1 | 0.9 | GO:0008113 | peptide-methionine (S)-S-oxide reductase activity(GO:0008113) |
| 0.1 | 0.7 | GO:0004716 | receptor signaling protein tyrosine kinase activity(GO:0004716) |
| 0.1 | 0.3 | GO:0050833 | pyruvate transmembrane transporter activity(GO:0050833) |
| 0.1 | 0.4 | GO:0008454 | alpha-1,3-mannosylglycoprotein 4-beta-N-acetylglucosaminyltransferase activity(GO:0008454) |
| 0.1 | 0.4 | GO:0015093 | ferrous iron transmembrane transporter activity(GO:0015093) |
| 0.1 | 1.5 | GO:0008188 | neuropeptide receptor activity(GO:0008188) |
| 0.1 | 0.5 | GO:0015189 | L-ornithine transmembrane transporter activity(GO:0000064) arginine transmembrane transporter activity(GO:0015181) L-lysine transmembrane transporter activity(GO:0015189) |
| 0.1 | 0.2 | GO:0071568 | UFM1 transferase activity(GO:0071568) |
| 0.1 | 1.4 | GO:0004198 | calcium-dependent cysteine-type endopeptidase activity(GO:0004198) |
| 0.1 | 0.4 | GO:0042296 | ISG15 transferase activity(GO:0042296) |
| 0.1 | 2.0 | GO:0008528 | G-protein coupled peptide receptor activity(GO:0008528) |
| 0.1 | 0.5 | GO:0008121 | ubiquinol-cytochrome-c reductase activity(GO:0008121) oxidoreductase activity, acting on diphenols and related substances as donors(GO:0016679) oxidoreductase activity, acting on diphenols and related substances as donors, cytochrome as acceptor(GO:0016681) |
| 0.1 | 0.3 | GO:0035877 | death effector domain binding(GO:0035877) |
| 0.1 | 0.8 | GO:0043522 | leucine zipper domain binding(GO:0043522) |
| 0.1 | 0.7 | GO:0016500 | protein-hormone receptor activity(GO:0016500) |
| 0.1 | 1.7 | GO:0005251 | delayed rectifier potassium channel activity(GO:0005251) |
| 0.1 | 0.9 | GO:0008574 | ATP-dependent microtubule motor activity, plus-end-directed(GO:0008574) |
| 0.1 | 0.6 | GO:0004806 | triglyceride lipase activity(GO:0004806) |
| 0.1 | 0.4 | GO:0018741 | alkyl sulfatase activity(GO:0018741) endosulfan hemisulfate sulfatase activity(GO:0034889) endosulfan sulfate hydrolase activity(GO:0034902) |
| 0.1 | 1.2 | GO:0016676 | cytochrome-c oxidase activity(GO:0004129) heme-copper terminal oxidase activity(GO:0015002) oxidoreductase activity, acting on a heme group of donors, oxygen as acceptor(GO:0016676) |
| 0.1 | 0.3 | GO:0002135 | CTP binding(GO:0002135) |
| 0.0 | 0.2 | GO:0038049 | glucocorticoid receptor activity(GO:0004883) transcription factor activity, ligand-activated RNA polymerase II transcription factor binding(GO:0038049) glucocorticoid-activated RNA polymerase II transcription factor binding transcription factor activity(GO:0038051) |
| 0.0 | 0.3 | GO:0034452 | dynactin binding(GO:0034452) |
| 0.0 | 0.3 | GO:0035174 | histone serine kinase activity(GO:0035174) |
| 0.0 | 0.2 | GO:0022821 | potassium ion antiporter activity(GO:0022821) |
| 0.0 | 0.2 | GO:0004427 | inorganic diphosphatase activity(GO:0004427) |
| 0.0 | 0.3 | GO:0046974 | histone methyltransferase activity (H3-K9 specific)(GO:0046974) |
| 0.0 | 0.2 | GO:1990050 | phosphatidic acid transporter activity(GO:1990050) |
| 0.0 | 1.2 | GO:0017134 | fibroblast growth factor binding(GO:0017134) |
| 0.0 | 0.3 | GO:1990446 | U1 snRNP binding(GO:1990446) |
| 0.0 | 0.2 | GO:0034235 | GPI anchor binding(GO:0034235) |
| 0.0 | 1.5 | GO:0005547 | phosphatidylinositol-3,4,5-trisphosphate binding(GO:0005547) |
| 0.0 | 0.7 | GO:0043747 | protein-N-terminal asparagine amidohydrolase activity(GO:0008418) UDP-3-O-[3-hydroxymyristoyl] N-acetylglucosamine deacetylase activity(GO:0008759) iprodione amidohydrolase activity(GO:0018748) (3,5-dichlorophenylurea)acetate amidohydrolase activity(GO:0018749) 4'-(2-hydroxyisopropyl)phenylurea amidohydrolase activity(GO:0034571) didemethylisoproturon amidohydrolase activity(GO:0034573) N-isopropylacetanilide amidohydrolase activity(GO:0034576) N-cyclohexylformamide amidohydrolase activity(GO:0034781) isonicotinic acid hydrazide hydrolase activity(GO:0034876) cis-aconitamide amidase activity(GO:0034882) gamma-N-formylaminovinylacetate hydrolase activity(GO:0034885) N2-acetyl-L-lysine deacetylase activity(GO:0043747) O-succinylbenzoate synthase activity(GO:0043748) indoleacetamide hydrolase activity(GO:0043864) N-acetylcitrulline deacetylase activity(GO:0043909) N-acetylgalactosamine-6-phosphate deacetylase activity(GO:0047419) diacetylchitobiose deacetylase activity(GO:0052773) chitooligosaccharide deacetylase activity(GO:0052790) |
| 0.0 | 0.1 | GO:0046592 | polyamine oxidase activity(GO:0046592) spermine:oxygen oxidoreductase (spermidine-forming) activity(GO:0052901) |
| 0.0 | 0.5 | GO:0004298 | threonine-type endopeptidase activity(GO:0004298) threonine-type peptidase activity(GO:0070003) |
| 0.0 | 0.1 | GO:0017084 | glutamate 5-kinase activity(GO:0004349) glutamate-5-semialdehyde dehydrogenase activity(GO:0004350) delta1-pyrroline-5-carboxylate synthetase activity(GO:0017084) amino acid kinase activity(GO:0019202) |
| 0.0 | 0.2 | GO:0046933 | proton-transporting ATP synthase activity, rotational mechanism(GO:0046933) |
| 0.0 | 0.2 | GO:0045236 | CXCR chemokine receptor binding(GO:0045236) |
| 0.0 | 0.8 | GO:0001103 | RNA polymerase II repressing transcription factor binding(GO:0001103) |
| 0.0 | 0.7 | GO:0005154 | epidermal growth factor receptor binding(GO:0005154) |
| 0.0 | 0.4 | GO:0004551 | nucleotide diphosphatase activity(GO:0004551) |
| 0.0 | 0.1 | GO:0042609 | CD4 receptor binding(GO:0042609) |
| 0.0 | 0.7 | GO:0042169 | SH2 domain binding(GO:0042169) |
| 0.0 | 0.2 | GO:0070180 | large ribosomal subunit rRNA binding(GO:0070180) |
| 0.0 | 0.3 | GO:0036312 | phosphatidylinositol 3-kinase regulatory subunit binding(GO:0036312) |
| 0.0 | 0.7 | GO:0004867 | serine-type endopeptidase inhibitor activity(GO:0004867) |
| 0.0 | 0.0 | GO:0008970 | phosphatidylcholine 1-acylhydrolase activity(GO:0008970) phosphatidylserine 1-acylhydrolase activity(GO:0052739) 1-acyl-2-lysophosphatidylserine acylhydrolase activity(GO:0052740) |
| 0.0 | 0.3 | GO:0030506 | ankyrin binding(GO:0030506) |
| 0.0 | 0.1 | GO:0005523 | tropomyosin binding(GO:0005523) |
| 0.0 | 1.1 | GO:0051082 | unfolded protein binding(GO:0051082) |
| 0.0 | 0.4 | GO:0031435 | mitogen-activated protein kinase kinase kinase binding(GO:0031435) |
| 0.0 | 0.4 | GO:0070412 | R-SMAD binding(GO:0070412) |
| 0.0 | 0.6 | GO:0004601 | peroxidase activity(GO:0004601) |
| 0.0 | 0.0 | GO:0008802 | betaine-aldehyde dehydrogenase activity(GO:0008802) |
| 0.0 | 4.5 | GO:0005525 | GTP binding(GO:0005525) |
| 0.0 | 0.1 | GO:0004300 | enoyl-CoA hydratase activity(GO:0004300) |
| 0.0 | 0.2 | GO:0070016 | armadillo repeat domain binding(GO:0070016) |
| 0.0 | 0.1 | GO:1990247 | N6-methyladenosine-containing RNA binding(GO:1990247) |
| 0.0 | 0.5 | GO:0015078 | hydrogen ion transmembrane transporter activity(GO:0015078) |
| 0.0 | 0.7 | GO:0005518 | collagen binding(GO:0005518) |
| 0.0 | 0.4 | GO:0052771 | coenzyme F390-A hydrolase activity(GO:0052770) coenzyme F390-G hydrolase activity(GO:0052771) |
| 0.0 | 0.1 | GO:0034951 | pivalyl-CoA mutase activity(GO:0034784) o-hydroxylaminobenzoate mutase activity(GO:0034951) lupeol synthase activity(GO:0042299) beta-amyrin synthase activity(GO:0042300) baruol synthase activity(GO:0080011) |
| 0.0 | 0.3 | GO:0043027 | cysteine-type endopeptidase inhibitor activity involved in apoptotic process(GO:0043027) |