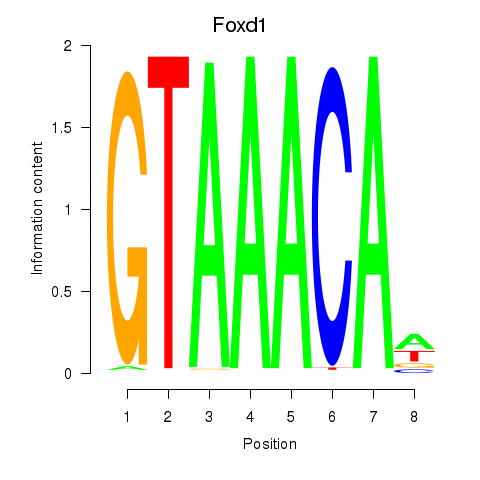
Motif ID: Foxd1
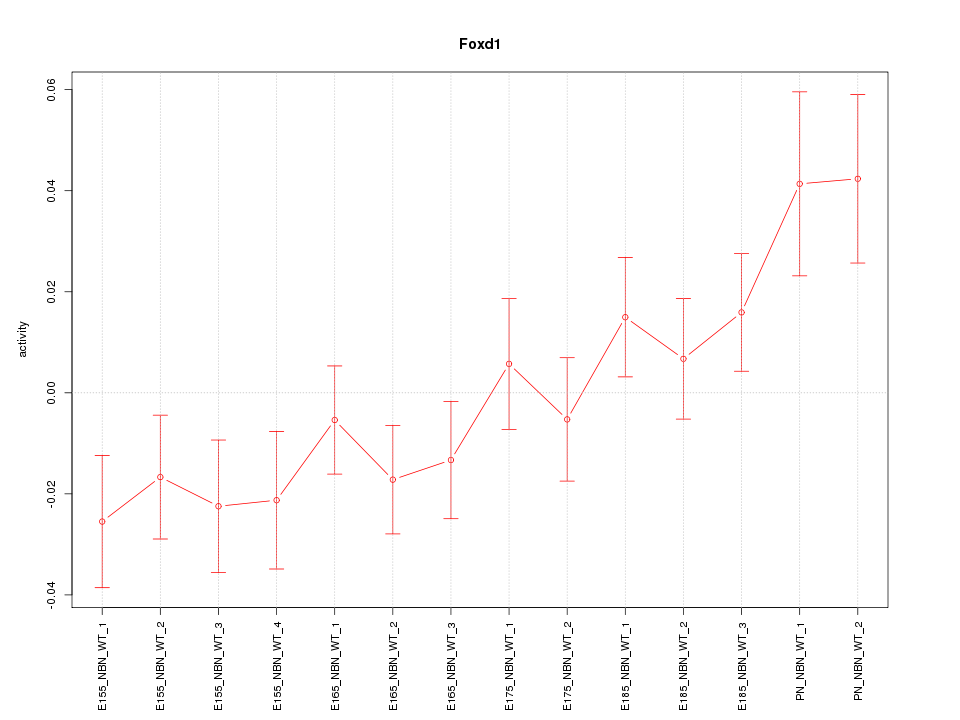
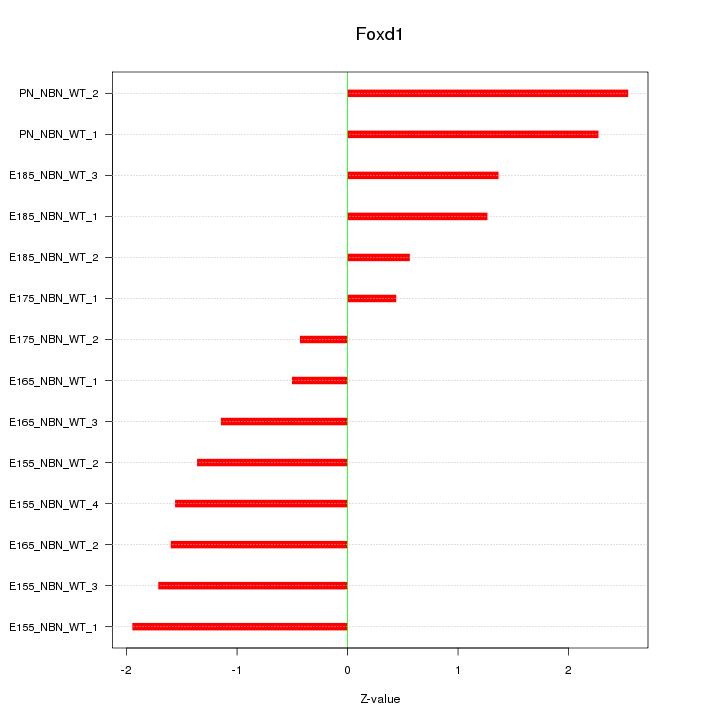
Z-value: 1.486
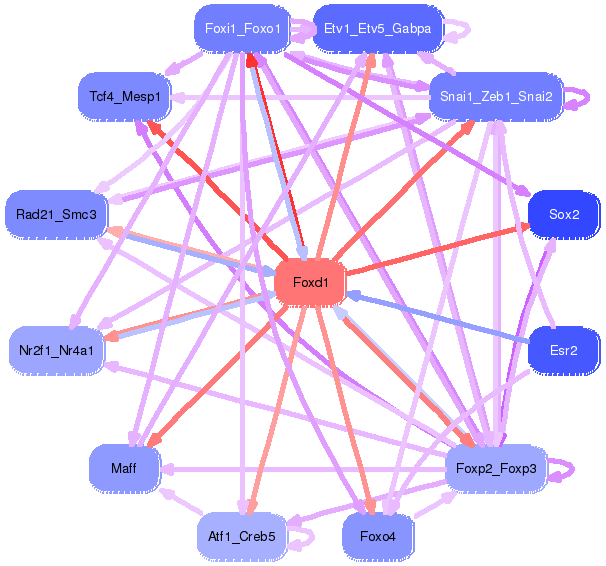
Transcription factors associated with Foxd1:
| Gene Symbol | Entrez ID | Gene Name |
|---|---|---|
| Foxd1 | ENSMUSG00000078302.3 | Foxd1 |
Activity-expression correlation:
| Gene Symbol | Promoter | Pearson corr. coef. | P-value | Plot |
|---|---|---|---|---|
| Foxd1 | mm10_v2_chr13_+_98354234_98354250 | 0.43 | 1.3e-01 | Click! |

Top targets:
Gene overrepresentation in biological_process category:
| Log-likelihood per target | Total log-likelihood | Term | Description |
|---|---|---|---|
| 1.9 | 20.9 | GO:0042572 | retinol metabolic process(GO:0042572) |
| 1.0 | 4.1 | GO:2000271 | positive regulation of fibroblast apoptotic process(GO:2000271) |
| 1.0 | 3.0 | GO:1901254 | positive regulation of intracellular transport of viral material(GO:1901254) |
| 1.0 | 3.0 | GO:1902310 | positive regulation of peptidyl-serine dephosphorylation(GO:1902310) |
| 0.9 | 6.1 | GO:0001887 | selenium compound metabolic process(GO:0001887) |
| 0.8 | 2.4 | GO:1902524 | negative regulation of interferon-alpha production(GO:0032687) interferon-alpha biosynthetic process(GO:0045349) regulation of interferon-alpha biosynthetic process(GO:0045354) negative regulation of interferon-beta biosynthetic process(GO:0045358) positive regulation of protein K48-linked ubiquitination(GO:1902524) |
| 0.7 | 2.9 | GO:0070425 | negative regulation of nucleotide-binding oligomerization domain containing signaling pathway(GO:0070425) negative regulation of nucleotide-binding oligomerization domain containing 2 signaling pathway(GO:0070433) |
| 0.6 | 11.6 | GO:0097154 | GABAergic neuron differentiation(GO:0097154) |
| 0.6 | 3.2 | GO:0048133 | germ-line stem cell division(GO:0042078) male germ-line stem cell asymmetric division(GO:0048133) germline stem cell asymmetric division(GO:0098728) |
| 0.6 | 4.9 | GO:0071732 | cellular response to nitric oxide(GO:0071732) |
| 0.5 | 2.2 | GO:0010510 | regulation of acetyl-CoA biosynthetic process from pyruvate(GO:0010510) |
| 0.5 | 1.6 | GO:0048014 | Tie signaling pathway(GO:0048014) |
| 0.5 | 2.0 | GO:0035461 | vitamin transmembrane transport(GO:0035461) |
| 0.5 | 2.4 | GO:0050847 | progesterone receptor signaling pathway(GO:0050847) |
| 0.5 | 7.0 | GO:0021527 | spinal cord association neuron differentiation(GO:0021527) |
| 0.5 | 3.3 | GO:0021984 | adenohypophysis development(GO:0021984) olfactory placode formation(GO:0030910) olfactory placode development(GO:0071698) olfactory placode morphogenesis(GO:0071699) |
| 0.5 | 2.3 | GO:2000668 | dendritic cell apoptotic process(GO:0097048) regulation of dendritic cell apoptotic process(GO:2000668) |
| 0.4 | 1.6 | GO:1900740 | regulation of protein insertion into mitochondrial membrane involved in apoptotic signaling pathway(GO:1900739) positive regulation of protein insertion into mitochondrial membrane involved in apoptotic signaling pathway(GO:1900740) |
| 0.4 | 3.8 | GO:0042118 | endothelial cell activation(GO:0042118) |
| 0.4 | 1.8 | GO:0051151 | negative regulation of smooth muscle cell differentiation(GO:0051151) |
| 0.3 | 1.0 | GO:0003032 | detection of oxygen(GO:0003032) regulation of epithelial to mesenchymal transition involved in endocardial cushion formation(GO:1905005) |
| 0.3 | 5.9 | GO:0002495 | antigen processing and presentation of peptide antigen via MHC class II(GO:0002495) antigen processing and presentation of peptide or polysaccharide antigen via MHC class II(GO:0002504) |
| 0.3 | 0.9 | GO:0014877 | response to inactivity(GO:0014854) response to muscle inactivity(GO:0014870) response to muscle inactivity involved in regulation of muscle adaptation(GO:0014877) response to denervation involved in regulation of muscle adaptation(GO:0014894) |
| 0.3 | 3.6 | GO:0043249 | erythrocyte maturation(GO:0043249) |
| 0.3 | 3.8 | GO:0034497 | protein localization to pre-autophagosomal structure(GO:0034497) |
| 0.3 | 2.0 | GO:0051461 | protein import into peroxisome matrix, docking(GO:0016560) regulation of corticotropin secretion(GO:0051459) positive regulation of corticotropin secretion(GO:0051461) |
| 0.3 | 1.4 | GO:2000774 | positive regulation of cellular senescence(GO:2000774) |
| 0.3 | 0.8 | GO:1903225 | negative regulation of endodermal cell differentiation(GO:1903225) |
| 0.3 | 2.2 | GO:0002347 | response to tumor cell(GO:0002347) |
| 0.2 | 2.4 | GO:0051967 | negative regulation of synaptic transmission, glutamatergic(GO:0051967) |
| 0.2 | 1.7 | GO:0007221 | positive regulation of transcription of Notch receptor target(GO:0007221) |
| 0.2 | 2.8 | GO:0003215 | cardiac right ventricle morphogenesis(GO:0003215) |
| 0.2 | 2.3 | GO:1901223 | negative regulation of NIK/NF-kappaB signaling(GO:1901223) |
| 0.2 | 0.7 | GO:0015886 | heme transport(GO:0015886) |
| 0.2 | 2.0 | GO:0009404 | toxin metabolic process(GO:0009404) |
| 0.2 | 1.1 | GO:0070236 | negative regulation of activation-induced cell death of T cells(GO:0070236) |
| 0.2 | 3.8 | GO:0051988 | regulation of attachment of spindle microtubules to kinetochore(GO:0051988) |
| 0.2 | 1.7 | GO:0060842 | arterial endothelial cell differentiation(GO:0060842) |
| 0.2 | 0.8 | GO:1901837 | negative regulation of transcription of nuclear large rRNA transcript from RNA polymerase I promoter(GO:1901837) |
| 0.2 | 2.9 | GO:0051150 | regulation of smooth muscle cell differentiation(GO:0051150) |
| 0.2 | 0.6 | GO:0044028 | DNA hypomethylation(GO:0044028) hypomethylation of CpG island(GO:0044029) |
| 0.2 | 0.4 | GO:1904879 | positive regulation of calcium ion transmembrane transport via high voltage-gated calcium channel(GO:1904879) |
| 0.2 | 1.7 | GO:0019800 | peptide cross-linking via chondroitin 4-sulfate glycosaminoglycan(GO:0019800) |
| 0.2 | 1.7 | GO:0032876 | negative regulation of DNA endoreduplication(GO:0032876) |
| 0.2 | 0.9 | GO:2000973 | regulation of pro-B cell differentiation(GO:2000973) |
| 0.2 | 0.8 | GO:0032346 | positive regulation of aldosterone metabolic process(GO:0032346) positive regulation of aldosterone biosynthetic process(GO:0032349) regulation of Rho-dependent protein serine/threonine kinase activity(GO:2000298) |
| 0.2 | 1.2 | GO:2000598 | regulation of cyclin catabolic process(GO:2000598) negative regulation of cyclin catabolic process(GO:2000599) |
| 0.2 | 6.3 | GO:0007026 | negative regulation of microtubule depolymerization(GO:0007026) |
| 0.2 | 5.2 | GO:0045604 | regulation of epidermal cell differentiation(GO:0045604) |
| 0.2 | 0.5 | GO:0035526 | retrograde transport, plasma membrane to Golgi(GO:0035526) |
| 0.1 | 0.4 | GO:0090327 | negative regulation of locomotion involved in locomotory behavior(GO:0090327) |
| 0.1 | 0.7 | GO:0032911 | nerve growth factor production(GO:0032902) negative regulation of transforming growth factor beta1 production(GO:0032911) |
| 0.1 | 1.1 | GO:0032264 | IMP salvage(GO:0032264) |
| 0.1 | 2.1 | GO:2000505 | regulation of energy homeostasis(GO:2000505) |
| 0.1 | 0.4 | GO:0007525 | somatic muscle development(GO:0007525) |
| 0.1 | 0.6 | GO:0002667 | lymphocyte anergy(GO:0002249) regulation of T cell anergy(GO:0002667) T cell anergy(GO:0002870) regulation of lymphocyte anergy(GO:0002911) negative regulation of protein kinase C signaling(GO:0090038) |
| 0.1 | 1.9 | GO:0021796 | cerebral cortex regionalization(GO:0021796) |
| 0.1 | 2.0 | GO:0045792 | negative regulation of cell size(GO:0045792) |
| 0.1 | 0.2 | GO:0045085 | negative regulation of interleukin-2 biosynthetic process(GO:0045085) |
| 0.1 | 1.5 | GO:0060612 | adipose tissue development(GO:0060612) |
| 0.1 | 0.6 | GO:0010359 | regulation of anion channel activity(GO:0010359) |
| 0.1 | 1.0 | GO:0098532 | liver regeneration(GO:0097421) histone H3-K27 trimethylation(GO:0098532) |
| 0.1 | 3.6 | GO:0006270 | DNA replication initiation(GO:0006270) |
| 0.1 | 0.3 | GO:0015014 | heparan sulfate proteoglycan biosynthetic process, polysaccharide chain biosynthetic process(GO:0015014) |
| 0.1 | 2.4 | GO:0001893 | maternal placenta development(GO:0001893) |
| 0.1 | 1.0 | GO:0071168 | protein localization to chromatin(GO:0071168) |
| 0.1 | 0.9 | GO:0060355 | positive regulation of cell adhesion molecule production(GO:0060355) |
| 0.1 | 1.2 | GO:0043970 | histone H3-K9 acetylation(GO:0043970) |
| 0.1 | 1.7 | GO:0031111 | negative regulation of microtubule polymerization or depolymerization(GO:0031111) negative regulation of microtubule polymerization(GO:0031115) |
| 0.1 | 1.4 | GO:0010592 | positive regulation of lamellipodium assembly(GO:0010592) |
| 0.1 | 0.6 | GO:0033353 | S-adenosylmethionine cycle(GO:0033353) |
| 0.1 | 0.8 | GO:0060539 | diaphragm development(GO:0060539) |
| 0.1 | 1.9 | GO:0070536 | protein K63-linked deubiquitination(GO:0070536) |
| 0.1 | 1.0 | GO:0021684 | cerebellar granular layer formation(GO:0021684) cerebellar granule cell differentiation(GO:0021707) |
| 0.1 | 1.3 | GO:0048268 | clathrin coat assembly(GO:0048268) |
| 0.1 | 1.3 | GO:0019835 | cytolysis(GO:0019835) |
| 0.1 | 0.4 | GO:2001269 | positive regulation of cysteine-type endopeptidase activity involved in apoptotic signaling pathway(GO:2001269) |
| 0.1 | 0.3 | GO:0032049 | cardiolipin biosynthetic process(GO:0032049) |
| 0.1 | 0.3 | GO:1904721 | regulation of mRNA cleavage(GO:0031437) negative regulation of mRNA cleavage(GO:0031438) negative regulation of immunoglobulin secretion(GO:0051025) negative regulation of ribonuclease activity(GO:0060701) negative regulation of endoribonuclease activity(GO:0060702) regulation of mRNA endonucleolytic cleavage involved in unfolded protein response(GO:1904720) negative regulation of mRNA endonucleolytic cleavage involved in unfolded protein response(GO:1904721) |
| 0.1 | 2.8 | GO:0006940 | regulation of smooth muscle contraction(GO:0006940) |
| 0.1 | 0.3 | GO:0010991 | negative regulation of SMAD protein complex assembly(GO:0010991) |
| 0.1 | 0.8 | GO:0016486 | peptide hormone processing(GO:0016486) |
| 0.0 | 0.1 | GO:0097274 | ductus arteriosus closure(GO:0097070) urea homeostasis(GO:0097274) |
| 0.0 | 1.7 | GO:0031572 | G2 DNA damage checkpoint(GO:0031572) |
| 0.0 | 0.6 | GO:0050901 | leukocyte tethering or rolling(GO:0050901) |
| 0.0 | 0.7 | GO:0009083 | branched-chain amino acid catabolic process(GO:0009083) |
| 0.0 | 0.3 | GO:0097368 | establishment of Sertoli cell barrier(GO:0097368) |
| 0.0 | 0.2 | GO:0021780 | oligodendrocyte cell fate specification(GO:0021778) oligodendrocyte cell fate commitment(GO:0021779) glial cell fate specification(GO:0021780) |
| 0.0 | 0.6 | GO:0035873 | lactate transport(GO:0015727) lactate transmembrane transport(GO:0035873) plasma membrane lactate transport(GO:0035879) |
| 0.0 | 0.4 | GO:0048387 | negative regulation of retinoic acid receptor signaling pathway(GO:0048387) |
| 0.0 | 0.4 | GO:1901621 | negative regulation of smoothened signaling pathway involved in dorsal/ventral neural tube patterning(GO:1901621) |
| 0.0 | 0.8 | GO:1904355 | positive regulation of telomere capping(GO:1904355) |
| 0.0 | 0.2 | GO:0007144 | female meiosis I(GO:0007144) |
| 0.0 | 0.1 | GO:0045059 | positive thymic T cell selection(GO:0045059) |
| 0.0 | 0.4 | GO:1990403 | embryonic brain development(GO:1990403) |
| 0.0 | 0.3 | GO:0032525 | somite rostral/caudal axis specification(GO:0032525) |
| 0.0 | 0.4 | GO:0032060 | bleb assembly(GO:0032060) |
| 0.0 | 0.4 | GO:0016226 | iron-sulfur cluster assembly(GO:0016226) metallo-sulfur cluster assembly(GO:0031163) |
| 0.0 | 1.4 | GO:0042147 | retrograde transport, endosome to Golgi(GO:0042147) |
| 0.0 | 0.8 | GO:0045600 | positive regulation of fat cell differentiation(GO:0045600) |
| 0.0 | 0.4 | GO:0002931 | response to ischemia(GO:0002931) |
| 0.0 | 0.1 | GO:2001032 | regulation of double-strand break repair via nonhomologous end joining(GO:2001032) |
| 0.0 | 0.3 | GO:0032933 | response to sterol depletion(GO:0006991) SREBP signaling pathway(GO:0032933) cellular response to sterol depletion(GO:0071501) |
| 0.0 | 0.3 | GO:0043171 | peptide catabolic process(GO:0043171) |
Gene overrepresentation in cellular_component category:
| Log-likelihood per target | Total log-likelihood | Term | Description |
|---|---|---|---|
| 1.0 | 3.0 | GO:0042025 | viral replication complex(GO:0019034) host cell nucleus(GO:0042025) host cell nuclear part(GO:0044094) |
| 0.8 | 3.8 | GO:0097149 | centralspindlin complex(GO:0097149) |
| 0.5 | 2.0 | GO:0017071 | intracellular cyclic nucleotide activated cation channel complex(GO:0017071) |
| 0.4 | 3.5 | GO:0097136 | Bcl-2 family protein complex(GO:0097136) |
| 0.4 | 2.4 | GO:0032983 | kainate selective glutamate receptor complex(GO:0032983) |
| 0.3 | 2.8 | GO:0030478 | actin cap(GO:0030478) |
| 0.3 | 3.3 | GO:0031931 | TORC1 complex(GO:0031931) |
| 0.3 | 0.8 | GO:0005588 | collagen type V trimer(GO:0005588) |
| 0.3 | 3.8 | GO:0034045 | pre-autophagosomal structure membrane(GO:0034045) |
| 0.2 | 0.8 | GO:0070022 | transforming growth factor beta receptor homodimeric complex(GO:0070022) |
| 0.2 | 0.6 | GO:0005943 | phosphatidylinositol 3-kinase complex, class IA(GO:0005943) |
| 0.2 | 1.0 | GO:0000798 | nuclear cohesin complex(GO:0000798) nuclear meiotic cohesin complex(GO:0034991) |
| 0.2 | 5.9 | GO:0032588 | trans-Golgi network membrane(GO:0032588) |
| 0.1 | 1.4 | GO:0031209 | SCAR complex(GO:0031209) |
| 0.1 | 28.4 | GO:0005667 | transcription factor complex(GO:0005667) |
| 0.1 | 1.0 | GO:0042555 | MCM complex(GO:0042555) |
| 0.1 | 2.8 | GO:0045171 | intercellular bridge(GO:0045171) |
| 0.1 | 0.2 | GO:0005712 | chiasma(GO:0005712) |
| 0.0 | 0.7 | GO:0012510 | trans-Golgi network transport vesicle membrane(GO:0012510) |
| 0.0 | 1.0 | GO:0035098 | ESC/E(Z) complex(GO:0035098) |
| 0.0 | 0.8 | GO:0043657 | host(GO:0018995) host cell part(GO:0033643) host cell(GO:0043657) |
| 0.0 | 0.4 | GO:1990454 | L-type voltage-gated calcium channel complex(GO:1990454) |
| 0.0 | 0.4 | GO:0000159 | protein phosphatase type 2A complex(GO:0000159) |
| 0.0 | 2.0 | GO:0030667 | secretory granule membrane(GO:0030667) |
| 0.0 | 2.5 | GO:0000118 | histone deacetylase complex(GO:0000118) |
| 0.0 | 1.0 | GO:0005891 | voltage-gated calcium channel complex(GO:0005891) |
| 0.0 | 0.4 | GO:0005952 | cAMP-dependent protein kinase complex(GO:0005952) |
| 0.0 | 2.2 | GO:0005758 | mitochondrial intermembrane space(GO:0005758) |
| 0.0 | 0.4 | GO:0031616 | spindle pole centrosome(GO:0031616) |
| 0.0 | 1.6 | GO:0009925 | basal plasma membrane(GO:0009925) |
| 0.0 | 2.0 | GO:0031526 | brush border membrane(GO:0031526) |
| 0.0 | 0.7 | GO:0080008 | Cul4-RING E3 ubiquitin ligase complex(GO:0080008) |
| 0.0 | 1.7 | GO:0005578 | proteinaceous extracellular matrix(GO:0005578) |
| 0.0 | 1.3 | GO:0005905 | clathrin-coated pit(GO:0005905) |
| 0.0 | 1.7 | GO:0043204 | perikaryon(GO:0043204) |
| 0.0 | 0.4 | GO:0005921 | gap junction(GO:0005921) |
| 0.0 | 0.9 | GO:0019005 | SCF ubiquitin ligase complex(GO:0019005) |
| 0.0 | 0.7 | GO:0017053 | transcriptional repressor complex(GO:0017053) |
| 0.0 | 0.6 | GO:0005801 | cis-Golgi network(GO:0005801) |
| 0.0 | 0.9 | GO:0005581 | collagen trimer(GO:0005581) |
| 0.0 | 0.1 | GO:0000812 | Swr1 complex(GO:0000812) |
| 0.0 | 2.3 | GO:0005874 | microtubule(GO:0005874) |
| 0.0 | 0.7 | GO:0005811 | lipid particle(GO:0005811) |
Gene overrepresentation in molecular_function category:
| Log-likelihood per target | Total log-likelihood | Term | Description |
|---|---|---|---|
| 3.0 | 20.9 | GO:0052650 | NADP-retinol dehydrogenase activity(GO:0052650) |
| 1.0 | 3.0 | GO:0004647 | phosphoserine phosphatase activity(GO:0004647) |
| 1.0 | 3.8 | GO:0001011 | transcription factor activity, sequence-specific DNA binding, RNA polymerase recruiting(GO:0001011) transcription factor activity, TFIIB-class binding(GO:0001087) |
| 0.7 | 2.9 | GO:0005176 | ErbB-2 class receptor binding(GO:0005176) |
| 0.7 | 2.0 | GO:0016715 | oxidoreductase activity, acting on paired donors, with incorporation or reduction of molecular oxygen, reduced ascorbate as one donor, and incorporation of one atom of oxygen(GO:0016715) |
| 0.6 | 3.0 | GO:1990825 | sequence-specific mRNA binding(GO:1990825) |
| 0.5 | 2.2 | GO:0004740 | pyruvate dehydrogenase (acetyl-transferring) kinase activity(GO:0004740) |
| 0.5 | 1.9 | GO:0032422 | purine-rich negative regulatory element binding(GO:0032422) |
| 0.4 | 6.1 | GO:0008430 | selenium binding(GO:0008430) |
| 0.4 | 2.0 | GO:0005052 | peroxisome matrix targeting signal-1 binding(GO:0005052) |
| 0.4 | 2.4 | GO:0015277 | kainate selective glutamate receptor activity(GO:0015277) |
| 0.3 | 6.2 | GO:0042287 | MHC protein binding(GO:0042287) |
| 0.3 | 4.9 | GO:0001223 | transcription coactivator binding(GO:0001223) |
| 0.3 | 5.2 | GO:0004181 | metallocarboxypeptidase activity(GO:0004181) |
| 0.3 | 2.2 | GO:0030375 | thyroid hormone receptor coactivator activity(GO:0030375) |
| 0.2 | 1.2 | GO:0008140 | cAMP response element binding protein binding(GO:0008140) |
| 0.2 | 2.0 | GO:0090482 | vitamin transmembrane transporter activity(GO:0090482) |
| 0.2 | 1.0 | GO:0034714 | type III transforming growth factor beta receptor binding(GO:0034714) |
| 0.2 | 2.3 | GO:0032036 | myosin heavy chain binding(GO:0032036) |
| 0.2 | 2.7 | GO:0070888 | E-box binding(GO:0070888) |
| 0.2 | 1.3 | GO:0004887 | thyroid hormone receptor activity(GO:0004887) |
| 0.2 | 3.3 | GO:0035198 | miRNA binding(GO:0035198) |
| 0.2 | 3.0 | GO:0044323 | retinoic acid-responsive element binding(GO:0044323) |
| 0.2 | 1.3 | GO:0004300 | enoyl-CoA hydratase activity(GO:0004300) |
| 0.2 | 1.1 | GO:0043426 | MRF binding(GO:0043426) |
| 0.2 | 0.7 | GO:0015232 | heme transporter activity(GO:0015232) |
| 0.2 | 1.0 | GO:0046976 | histone methyltransferase activity (H3-K27 specific)(GO:0046976) |
| 0.2 | 3.8 | GO:0080025 | phosphatidylinositol-3,5-bisphosphate binding(GO:0080025) |
| 0.2 | 1.1 | GO:0003876 | AMP deaminase activity(GO:0003876) adenosine-phosphate deaminase activity(GO:0047623) |
| 0.1 | 1.8 | GO:1990841 | promoter-specific chromatin binding(GO:1990841) |
| 0.1 | 0.6 | GO:0047696 | beta-adrenergic receptor kinase activity(GO:0047696) |
| 0.1 | 1.7 | GO:0017081 | chloride channel regulator activity(GO:0017081) |
| 0.1 | 0.9 | GO:0008329 | signaling pattern recognition receptor activity(GO:0008329) pattern recognition receptor activity(GO:0038187) |
| 0.1 | 2.3 | GO:0031078 | histone deacetylase activity (H3-K14 specific)(GO:0031078) NAD-dependent histone deacetylase activity (H3-K14 specific)(GO:0032041) |
| 0.1 | 0.5 | GO:0004719 | protein-L-isoaspartate (D-aspartate) O-methyltransferase activity(GO:0004719) |
| 0.1 | 0.8 | GO:0035615 | clathrin adaptor activity(GO:0035615) endocytic adaptor activity(GO:0098748) |
| 0.1 | 0.6 | GO:0004013 | adenosylhomocysteinase activity(GO:0004013) trialkylsulfonium hydrolase activity(GO:0016802) |
| 0.1 | 3.5 | GO:0045502 | dynein binding(GO:0045502) |
| 0.1 | 0.7 | GO:0048406 | nerve growth factor binding(GO:0048406) |
| 0.1 | 0.4 | GO:0086056 | voltage-gated calcium channel activity involved in AV node cell action potential(GO:0086056) |
| 0.1 | 0.6 | GO:0046934 | phosphatidylinositol-4,5-bisphosphate 3-kinase activity(GO:0046934) |
| 0.1 | 0.4 | GO:0004691 | cAMP-dependent protein kinase activity(GO:0004691) |
| 0.1 | 0.3 | GO:0008808 | cardiolipin synthase activity(GO:0008808) phosphatidyltransferase activity(GO:0030572) |
| 0.1 | 0.3 | GO:0060698 | endoribonuclease inhibitor activity(GO:0060698) |
| 0.1 | 0.2 | GO:0019237 | centromeric DNA binding(GO:0019237) |
| 0.1 | 2.6 | GO:0016538 | cyclin-dependent protein serine/threonine kinase regulator activity(GO:0016538) |
| 0.1 | 0.5 | GO:0001161 | intronic transcription regulatory region sequence-specific DNA binding(GO:0001161) intronic transcription regulatory region DNA binding(GO:0044213) |
| 0.0 | 1.3 | GO:0001786 | phosphatidylserine binding(GO:0001786) |
| 0.0 | 1.4 | GO:0051537 | 2 iron, 2 sulfur cluster binding(GO:0051537) |
| 0.0 | 0.3 | GO:0033192 | calcium-dependent protein serine/threonine phosphatase activity(GO:0004723) calmodulin-dependent protein phosphatase activity(GO:0033192) |
| 0.0 | 0.2 | GO:0008454 | alpha-1,3-mannosylglycoprotein 4-beta-N-acetylglucosaminyltransferase activity(GO:0008454) |
| 0.0 | 0.6 | GO:0015129 | lactate transmembrane transporter activity(GO:0015129) |
| 0.0 | 5.2 | GO:0001078 | transcriptional repressor activity, RNA polymerase II core promoter proximal region sequence-specific binding(GO:0001078) |
| 0.0 | 1.7 | GO:0050840 | extracellular matrix binding(GO:0050840) |
| 0.0 | 0.4 | GO:0005243 | gap junction channel activity(GO:0005243) |
| 0.0 | 2.3 | GO:0003823 | antigen binding(GO:0003823) |
| 0.0 | 12.1 | GO:0001228 | transcriptional activator activity, RNA polymerase II transcription regulatory region sequence-specific binding(GO:0001228) |
| 0.0 | 0.2 | GO:1990247 | N6-methyladenosine-containing RNA binding(GO:1990247) |
| 0.0 | 1.7 | GO:0019894 | kinesin binding(GO:0019894) |
| 0.0 | 0.7 | GO:0032266 | phosphatidylinositol-3-phosphate binding(GO:0032266) |
| 0.0 | 0.8 | GO:0005201 | extracellular matrix structural constituent(GO:0005201) |
| 0.0 | 2.8 | GO:0017048 | Rho GTPase binding(GO:0017048) |
| 0.0 | 0.8 | GO:0005245 | voltage-gated calcium channel activity(GO:0005245) |
| 0.0 | 0.7 | GO:0052771 | coenzyme F390-A hydrolase activity(GO:0052770) coenzyme F390-G hydrolase activity(GO:0052771) |
| 0.0 | 0.1 | GO:0005049 | nuclear export signal receptor activity(GO:0005049) |
| 0.0 | 2.2 | GO:0031625 | ubiquitin protein ligase binding(GO:0031625) |
| 0.0 | 1.4 | GO:0004197 | cysteine-type endopeptidase activity(GO:0004197) |
| 0.0 | 1.3 | GO:0004252 | serine-type endopeptidase activity(GO:0004252) |
| 0.0 | 1.0 | GO:0004003 | ATP-dependent DNA helicase activity(GO:0004003) |
| 0.0 | 0.5 | GO:0034930 | N-acetylglucosamine 6-O-sulfotransferase activity(GO:0001517) heparan sulfate 2-O-sulfotransferase activity(GO:0004394) HNK-1 sulfotransferase activity(GO:0016232) heparan sulfate 6-O-sulfotransferase activity(GO:0017095) trans-9R,10R-dihydrodiolphenanthrene sulfotransferase activity(GO:0018721) 1-phenanthrol sulfotransferase activity(GO:0018722) 3-phenanthrol sulfotransferase activity(GO:0018723) 4-phenanthrol sulfotransferase activity(GO:0018724) trans-3,4-dihydrodiolphenanthrene sulfotransferase activity(GO:0018725) 9-phenanthrol sulfotransferase activity(GO:0018726) 2-phenanthrol sulfotransferase activity(GO:0018727) phenanthrol sulfotransferase activity(GO:0019111) 1-hydroxypyrene sulfotransferase activity(GO:0034930) proteoglycan sulfotransferase activity(GO:0050698) cholesterol sulfotransferase activity(GO:0051922) hydroxyjasmonate sulfotransferase activity(GO:0080131) |
| 0.0 | 0.3 | GO:0000993 | RNA polymerase II core binding(GO:0000993) |
| 0.0 | 1.6 | GO:0051117 | ATPase binding(GO:0051117) |
| 0.0 | 0.4 | GO:0031690 | adrenergic receptor binding(GO:0031690) |
| 0.0 | 1.1 | GO:0004222 | metalloendopeptidase activity(GO:0004222) |
| 0.0 | 0.4 | GO:0051539 | 4 iron, 4 sulfur cluster binding(GO:0051539) |
| 0.0 | 0.9 | GO:0042826 | histone deacetylase binding(GO:0042826) |
| 0.0 | 0.5 | GO:0001158 | enhancer sequence-specific DNA binding(GO:0001158) |
| 0.0 | 0.4 | GO:0004867 | serine-type endopeptidase inhibitor activity(GO:0004867) |