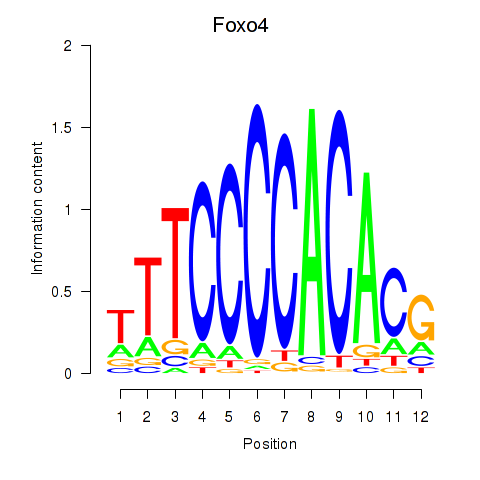
Motif ID: Foxo4

Z-value: 1.140


Transcription factors associated with Foxo4:

Gene SymbolEntrez IDGene Name
Foxo4 ENSMUSG00000042903.7 Foxo4

Activity-expression correlation:

Gene SymbolPromoterPearson corr. coef.P-valuePlot
Foxo4mm10_v2_chrX_+_101254528_1012545740.263.7e-01Click!


Activity profile for motif Foxo4.

activity profile for motif Foxo4


Sorted Z-values histogram for motif Foxo4

Sorted Z-values for motif Foxo4


Network of associatons between targets according to the STRING database.


First level regulatory network of Foxo4

PNG image of the network

In order to view interactive SVG image please either update your browser to latest version or install SVG plugin.


View svg image
View png image


Top targets:


Showing 1 to 20 of 85 entries
PromoterScoreRefseqGene SymbolGene Name
chr7_-_103813913 3.752 ENSMUST00000098192.3
Hbb-bt
hemoglobin, beta adult t chain
chr4_-_97778042 2.456 ENSMUST00000146447.1
E130114P18Rik
RIKEN cDNA E130114P18 gene
chr1_+_6487231 1.990 ENSMUST00000140079.1
ENSMUST00000131494.1
St18

suppression of tumorigenicity 18

chr4_+_97777606 1.762 ENSMUST00000075448.6
ENSMUST00000092532.6
Nfia

nuclear factor I/A

chr2_-_175338197 1.757 ENSMUST00000121393.2
Gm4631
predicted gene 4631
chr2_-_175931051 1.690 ENSMUST00000108949.2
ENSMUST00000109018.2
Gm8898

predicted gene 8898

chr2_-_177957239 1.512 ENSMUST00000108928.1
ENSMUST00000108932.1
ENSMUST00000108930.2
Gm14326


predicted gene 14326


chr2_+_176521056 1.449 ENSMUST00000108997.2
ENSMUST00000178443.1
Gm14431

predicted gene 14431

chr17_+_80944611 1.393 ENSMUST00000025092.4
Tmem178
transmembrane protein 178
chr2_-_175141999 1.273 ENSMUST00000109062.1
ENSMUST00000109059.1
ENSMUST00000109060.1
Gm14399


predicted gene 14399


chr2_+_175372436 1.241 ENSMUST00000131676.1
ENSMUST00000109048.2
ENSMUST00000109047.2
Gm4723


predicted gene 4723


chr14_-_25903100 1.233 ENSMUST00000052286.8
Plac9a
placenta specific 9a
chr14_-_26182480 1.199 ENSMUST00000184142.1
Plac9b
placenta specific 9b
chr2_+_175469985 1.136 ENSMUST00000109042.3
ENSMUST00000109002.2
ENSMUST00000109043.2
ENSMUST00000143490.1
Gm8923


predicted gene 8923


chr2_-_175703646 1.135 ENSMUST00000109027.2
ENSMUST00000179061.1
ENSMUST00000131041.1
Gm4245


predicted gene 4245


chr2_-_177840318 1.098 ENSMUST00000108939.2
ENSMUST00000150650.1
Gm14325

predicted gene 14325

chr2_+_178023284 1.076 ENSMUST00000108925.3
ENSMUST00000108926.2
Etohi1

ethanol induced 1

chr19_-_50030735 1.056 ENSMUST00000071866.1
Rpl13a-ps1
ribosomal protein 13A, pseudogene 1
chr2_+_175965331 1.007 ENSMUST00000109007.1
ENSMUST00000174416.1
Gm2026

predicted gene 2026

chr2_+_176670522 0.984 ENSMUST00000121956.1
ENSMUST00000108985.2
Gm14306

predicted gene 14306


Gene Ontology Analysis

Gene overrepresentation in biological_process category:

Showing 1 to 20 of 24 entries
Log-likelihood per target Total log-likelihoodTermDescription
0.0 1.8 GO:0060074 synapse maturation(GO:0060074)
0.1 1.6 GO:0060539 diaphragm development(GO:0060539)
0.1 1.4 GO:0045671 negative regulation of osteoclast differentiation(GO:0045671)
0.1 1.2 GO:0019227 neuronal action potential propagation(GO:0019227) action potential propagation(GO:0098870)
0.1 0.9 GO:0061299 retina vasculature morphogenesis in camera-type eye(GO:0061299)
0.2 0.7 GO:0060244 negative regulation of cell proliferation involved in contact inhibition(GO:0060244)
0.1 0.7 GO:0090557 establishment of endothelial intestinal barrier(GO:0090557)
0.0 0.6 GO:0045742 positive regulation of epidermal growth factor receptor signaling pathway(GO:0045742)
0.2 0.5 GO:0003104 positive regulation of glomerular filtration(GO:0003104) negative regulation of phosphatidylinositol biosynthetic process(GO:0010512) phenotypic switching(GO:0036166) dedifferentiation(GO:0043696) cell dedifferentiation(GO:0043697) glomerular mesangial cell differentiation(GO:0072008) glomerular mesangial cell development(GO:0072144) metanephric glomerular mesangium development(GO:0072223) metanephric glomerular mesangial cell proliferation involved in metanephros development(GO:0072262)
0.0 0.5 GO:0015701 bicarbonate transport(GO:0015701)
0.1 0.4 GO:0046477 glycosylceramide catabolic process(GO:0046477)
0.1 0.3 GO:0045349 regulation of dendritic cell cytokine production(GO:0002730) interferon-alpha biosynthetic process(GO:0045349) regulation of interferon-alpha biosynthetic process(GO:0045354) positive regulation of interferon-beta biosynthetic process(GO:0045359)
0.1 0.3 GO:1901509 regulation of endothelial tube morphogenesis(GO:1901509)
0.1 0.3 GO:0003221 right ventricular cardiac muscle tissue morphogenesis(GO:0003221)
0.1 0.3 GO:0035063 nuclear speck organization(GO:0035063)
0.0 0.3 GO:2001214 positive regulation of vasculogenesis(GO:2001214)
0.0 0.3 GO:0006983 ER overload response(GO:0006983)
0.1 0.2 GO:0032829 positive regulation of T cell anergy(GO:0002669) positive regulation of lymphocyte anergy(GO:0002913) regulation of CD4-positive, CD25-positive, alpha-beta regulatory T cell differentiation(GO:0032829) negative regulation of interleukin-2 biosynthetic process(GO:0045085) negative regulation of isotype switching to IgE isotypes(GO:0048294)
0.1 0.2 GO:0002314 germinal center B cell differentiation(GO:0002314)
0.0 0.2 GO:1904451 regulation of hydrogen:potassium-exchanging ATPase activity(GO:1904451) positive regulation of hydrogen:potassium-exchanging ATPase activity(GO:1904453)

Gene overrepresentation in cellular_component category:

Showing 1 to 7 of 7 entries
Log-likelihood per target Total log-likelihoodTermDescription
0.9 3.8 GO:0031838 haptoglobin-hemoglobin complex(GO:0031838)
0.0 1.0 GO:0072562 blood microparticle(GO:0072562)
0.1 0.7 GO:0036056 filtration diaphragm(GO:0036056) slit diaphragm(GO:0036057)
0.0 0.2 GO:0032777 Piccolo NuA4 histone acetyltransferase complex(GO:0032777)
0.0 0.2 GO:1990795 lateral part of cell(GO:0097574) basolateral part of cell(GO:1990794) rod bipolar cell terminal bouton(GO:1990795)
0.0 0.2 GO:0000137 Golgi cis cisterna(GO:0000137)
0.0 0.1 GO:0000836 ER ubiquitin ligase complex(GO:0000835) Hrd1p ubiquitin ligase complex(GO:0000836)

Gene overrepresentation in molecular_function category:

Showing 1 to 16 of 16 entries
Log-likelihood per target Total log-likelihoodTermDescription
0.9 3.8 GO:0031721 haptoglobin binding(GO:0031720) hemoglobin alpha binding(GO:0031721)
0.0 1.6 GO:0001158 enhancer sequence-specific DNA binding(GO:0001158)
0.1 1.2 GO:0005247 voltage-gated chloride channel activity(GO:0005247)
0.0 0.9 GO:0004653 polypeptide N-acetylgalactosaminyltransferase activity(GO:0004653)
0.0 0.8 GO:0016676 cytochrome-c oxidase activity(GO:0004129) heme-copper terminal oxidase activity(GO:0015002) oxidoreductase activity, acting on a heme group of donors, oxygen as acceptor(GO:0016676)
0.2 0.7 GO:0001075 transcription factor activity, RNA polymerase II core promoter sequence-specific binding involved in preinitiation complex assembly(GO:0001075)
0.1 0.5 GO:0016176 superoxide-generating NADPH oxidase activator activity(GO:0016176)
0.0 0.5 GO:0015106 bicarbonate transmembrane transporter activity(GO:0015106)
0.1 0.4 GO:0016936 galactoside binding(GO:0016936)
0.0 0.3 GO:0044548 S100 protein binding(GO:0044548)
0.0 0.3 GO:0015026 coreceptor activity(GO:0015026)
0.0 0.3 GO:1990841 promoter-specific chromatin binding(GO:1990841)
0.0 0.3 GO:0003950 NAD+ ADP-ribosyltransferase activity(GO:0003950)
0.0 0.2 GO:0051525 NFAT protein binding(GO:0051525)
0.0 0.2 GO:0017034 Rap guanyl-nucleotide exchange factor activity(GO:0017034)
0.0 0.1 GO:1904288 BAT3 complex binding(GO:1904288)