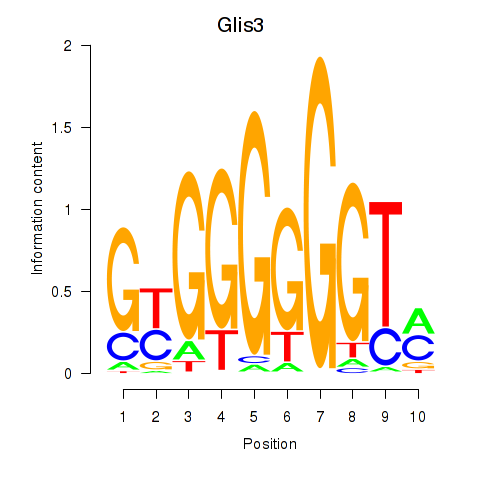
Motif ID: Glis3
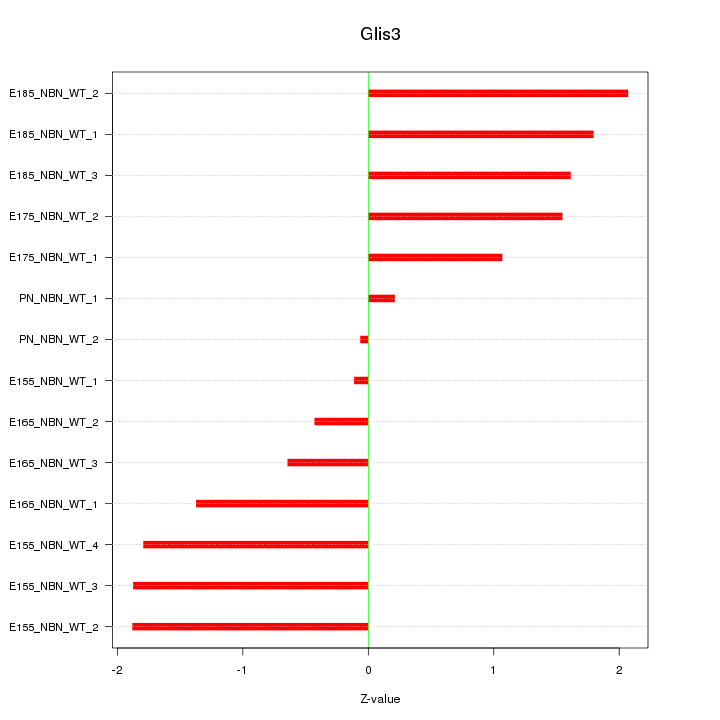
Z-value: 1.375
Transcription factors associated with Glis3:
| Gene Symbol | Entrez ID | Gene Name |
|---|---|---|
| Glis3 | ENSMUSG00000052942.7 | Glis3 |
| Glis3 | ENSMUSG00000091294.1 | Glis3 |
Activity-expression correlation:
| Gene Symbol | Promoter | Pearson corr. coef. | P-value | Plot |
|---|---|---|---|---|
| Glis3 | mm10_v2_chr19_-_28680077_28680122 | 0.78 | 1.1e-03 | Click! |

Top targets:
Gene overrepresentation in biological_process category:
| Log-likelihood per target | Total log-likelihood | Term | Description |
|---|---|---|---|
| 1.3 | 12.1 | GO:0060665 | regulation of branching involved in salivary gland morphogenesis by mesenchymal-epithelial signaling(GO:0060665) |
| 1.2 | 13.3 | GO:0042572 | retinol metabolic process(GO:0042572) |
| 1.0 | 5.9 | GO:2000672 | negative regulation of motor neuron apoptotic process(GO:2000672) |
| 0.6 | 1.7 | GO:0003032 | detection of oxygen(GO:0003032) |
| 0.5 | 13.6 | GO:0043153 | entrainment of circadian clock by photoperiod(GO:0043153) |
| 0.3 | 2.1 | GO:0032346 | positive regulation of aldosterone metabolic process(GO:0032346) positive regulation of aldosterone biosynthetic process(GO:0032349) |
| 0.3 | 2.2 | GO:0038028 | insulin receptor signaling pathway via phosphatidylinositol 3-kinase(GO:0038028) |
| 0.3 | 2.1 | GO:0071732 | cellular response to nitric oxide(GO:0071732) |
| 0.3 | 0.8 | GO:0003100 | angiotensin mediated vasoconstriction involved in regulation of systemic arterial blood pressure(GO:0001998) regulation of blood vessel size by renin-angiotensin(GO:0002034) renal control of peripheral vascular resistance involved in regulation of systemic arterial blood pressure(GO:0003072) regulation of systemic arterial blood pressure by endothelin(GO:0003100) beta selection(GO:0043366) |
| 0.2 | 0.6 | GO:0010725 | regulation of primitive erythrocyte differentiation(GO:0010725) |
| 0.2 | 0.6 | GO:0010845 | positive regulation of reciprocal meiotic recombination(GO:0010845) |
| 0.2 | 0.5 | GO:0061043 | regulation of vascular wound healing(GO:0061043) |
| 0.1 | 1.3 | GO:0060613 | fat pad development(GO:0060613) |
| 0.1 | 0.5 | GO:0097374 | sensory neuron axon guidance(GO:0097374) |
| 0.1 | 0.9 | GO:0043353 | enucleate erythrocyte differentiation(GO:0043353) hydrogen sulfide biosynthetic process(GO:0070814) |
| 0.1 | 0.9 | GO:0015840 | urea transport(GO:0015840) urea transmembrane transport(GO:0071918) |
| 0.1 | 0.6 | GO:0051151 | negative regulation of smooth muscle cell differentiation(GO:0051151) |
| 0.1 | 0.7 | GO:2000465 | regulation of glycogen (starch) synthase activity(GO:2000465) |
| 0.1 | 0.5 | GO:0051599 | response to hydrostatic pressure(GO:0051599) |
| 0.1 | 0.3 | GO:0042414 | epinephrine metabolic process(GO:0042414) |
| 0.1 | 0.6 | GO:0033601 | positive regulation of mammary gland epithelial cell proliferation(GO:0033601) |
| 0.1 | 0.6 | GO:0006362 | transcription elongation from RNA polymerase I promoter(GO:0006362) |
| 0.1 | 0.9 | GO:1990126 | retrograde transport, endosome to plasma membrane(GO:1990126) |
| 0.1 | 0.2 | GO:0051305 | chromosome movement towards spindle pole(GO:0051305) |
| 0.0 | 1.3 | GO:0008299 | isoprenoid biosynthetic process(GO:0008299) |
| 0.0 | 0.3 | GO:0044829 | negative regulation by host of viral genome replication(GO:0044828) positive regulation by host of viral genome replication(GO:0044829) |
| 0.0 | 0.1 | GO:0035519 | protein K29-linked ubiquitination(GO:0035519) |
| 0.0 | 0.3 | GO:0070389 | chaperone cofactor-dependent protein refolding(GO:0070389) |
| 0.0 | 0.7 | GO:2000001 | regulation of DNA damage checkpoint(GO:2000001) |
| 0.0 | 0.1 | GO:0070172 | oculomotor nerve development(GO:0021557) positive regulation of tooth mineralization(GO:0070172) |
| 0.0 | 1.1 | GO:0016578 | histone deubiquitination(GO:0016578) |
| 0.0 | 0.4 | GO:0019368 | fatty acid elongation, saturated fatty acid(GO:0019367) fatty acid elongation, unsaturated fatty acid(GO:0019368) fatty acid elongation, monounsaturated fatty acid(GO:0034625) fatty acid elongation, polyunsaturated fatty acid(GO:0034626) |
| 0.0 | 1.6 | GO:0060325 | face morphogenesis(GO:0060325) |
| 0.0 | 0.5 | GO:0060746 | parental behavior(GO:0060746) |
| 0.0 | 0.9 | GO:0071385 | cellular response to glucocorticoid stimulus(GO:0071385) |
| 0.0 | 0.2 | GO:0010587 | miRNA catabolic process(GO:0010587) |
| 0.0 | 0.1 | GO:0021914 | negative regulation of smoothened signaling pathway involved in ventral spinal cord patterning(GO:0021914) |
| 0.0 | 0.3 | GO:0070914 | UV-damage excision repair(GO:0070914) |
| 0.0 | 0.4 | GO:0002467 | germinal center formation(GO:0002467) |
| 0.0 | 0.3 | GO:0035721 | intraciliary retrograde transport(GO:0035721) |
| 0.0 | 0.4 | GO:0035115 | embryonic forelimb morphogenesis(GO:0035115) |
| 0.0 | 0.1 | GO:0021993 | initiation of neural tube closure(GO:0021993) |
| 0.0 | 0.3 | GO:0046500 | S-adenosylmethionine metabolic process(GO:0046500) |
| 0.0 | 1.0 | GO:0042147 | retrograde transport, endosome to Golgi(GO:0042147) |
| 0.0 | 0.8 | GO:0051865 | protein autoubiquitination(GO:0051865) |
| 0.0 | 0.3 | GO:0033235 | positive regulation of protein sumoylation(GO:0033235) |
| 0.0 | 0.2 | GO:0071577 | zinc II ion transmembrane transport(GO:0071577) |
| 0.0 | 0.1 | GO:2000786 | positive regulation of autophagosome assembly(GO:2000786) |
| 0.0 | 0.7 | GO:0048286 | lung alveolus development(GO:0048286) |
Gene overrepresentation in cellular_component category:
| Log-likelihood per target | Total log-likelihood | Term | Description |
|---|---|---|---|
| 2.0 | 5.9 | GO:0097058 | CRLF-CLCF1 complex(GO:0097058) |
| 0.2 | 12.8 | GO:0009925 | basal plasma membrane(GO:0009925) |
| 0.1 | 0.7 | GO:0032299 | ribonuclease H2 complex(GO:0032299) |
| 0.1 | 1.1 | GO:0000124 | SAGA complex(GO:0000124) |
| 0.1 | 0.6 | GO:0033503 | HULC complex(GO:0033503) |
| 0.1 | 0.9 | GO:0071203 | WASH complex(GO:0071203) |
| 0.1 | 0.2 | GO:0031084 | BLOC-2 complex(GO:0031084) |
| 0.1 | 0.4 | GO:0033256 | I-kappaB/NF-kappaB complex(GO:0033256) |
| 0.0 | 0.6 | GO:0016589 | NURF complex(GO:0016589) |
| 0.0 | 0.3 | GO:0031465 | Cul4B-RING E3 ubiquitin ligase complex(GO:0031465) |
| 0.0 | 0.6 | GO:0001650 | fibrillar center(GO:0001650) |
| 0.0 | 0.1 | GO:0044194 | cytolytic granule(GO:0044194) |
| 0.0 | 0.4 | GO:0016010 | dystrophin-associated glycoprotein complex(GO:0016010) glycoprotein complex(GO:0090665) |
| 0.0 | 0.6 | GO:0046658 | anchored component of plasma membrane(GO:0046658) |
| 0.0 | 1.0 | GO:0045335 | phagocytic vesicle(GO:0045335) |
| 0.0 | 0.7 | GO:0097610 | cleavage furrow(GO:0032154) cell surface furrow(GO:0097610) |
| 0.0 | 0.2 | GO:0071782 | endoplasmic reticulum tubular network(GO:0071782) |
| 0.0 | 0.3 | GO:0042470 | melanosome(GO:0042470) pigment granule(GO:0048770) |
| 0.0 | 0.1 | GO:0016281 | eukaryotic translation initiation factor 4F complex(GO:0016281) |
| 0.0 | 12.6 | GO:0005730 | nucleolus(GO:0005730) |
| 0.0 | 0.7 | GO:0005844 | polysome(GO:0005844) |
| 0.0 | 0.7 | GO:0031463 | Cul3-RING ubiquitin ligase complex(GO:0031463) |
| 0.0 | 0.9 | GO:0070469 | respiratory chain(GO:0070469) |
Gene overrepresentation in molecular_function category:
| Log-likelihood per target | Total log-likelihood | Term | Description |
|---|---|---|---|
| 3.1 | 12.3 | GO:0005008 | hepatocyte growth factor-activated receptor activity(GO:0005008) |
| 2.3 | 13.6 | GO:0043426 | MRF binding(GO:0043426) |
| 1.9 | 13.3 | GO:0052650 | NADP-retinol dehydrogenase activity(GO:0052650) |
| 0.8 | 5.9 | GO:0005127 | ciliary neurotrophic factor receptor binding(GO:0005127) |
| 0.6 | 1.7 | GO:0005534 | galactose binding(GO:0005534) |
| 0.2 | 1.3 | GO:0046912 | transferase activity, transferring acyl groups, acyl groups converted into alkyl on transfer(GO:0046912) |
| 0.2 | 2.1 | GO:0070700 | BMP receptor binding(GO:0070700) |
| 0.2 | 0.7 | GO:2001069 | glycogen binding(GO:2001069) |
| 0.2 | 0.5 | GO:0043183 | vascular endothelial growth factor receptor 1 binding(GO:0043183) |
| 0.2 | 0.5 | GO:0048763 | calcium-induced calcium release activity(GO:0048763) |
| 0.1 | 0.9 | GO:0015265 | urea channel activity(GO:0015265) |
| 0.1 | 2.1 | GO:0001223 | transcription coactivator binding(GO:0001223) |
| 0.1 | 0.6 | GO:0001165 | RNA polymerase I upstream control element sequence-specific DNA binding(GO:0001165) |
| 0.1 | 1.2 | GO:0004185 | serine-type carboxypeptidase activity(GO:0004185) |
| 0.1 | 2.2 | GO:0043539 | protein serine/threonine kinase activator activity(GO:0043539) |
| 0.1 | 0.8 | GO:0051022 | Rho GDP-dissociation inhibitor binding(GO:0051022) |
| 0.1 | 0.7 | GO:0004523 | RNA-DNA hybrid ribonuclease activity(GO:0004523) |
| 0.1 | 0.3 | GO:0004719 | protein-L-isoaspartate (D-aspartate) O-methyltransferase activity(GO:0004719) |
| 0.1 | 0.3 | GO:0035240 | dopamine binding(GO:0035240) |
| 0.1 | 0.3 | GO:0008494 | translation activator activity(GO:0008494) |
| 0.1 | 0.3 | GO:0045505 | dynein intermediate chain binding(GO:0045505) |
| 0.0 | 0.6 | GO:0070742 | C2H2 zinc finger domain binding(GO:0070742) |
| 0.0 | 2.6 | GO:0019003 | GDP binding(GO:0019003) |
| 0.0 | 0.6 | GO:1990841 | promoter-specific chromatin binding(GO:1990841) |
| 0.0 | 0.4 | GO:0102338 | fatty acid elongase activity(GO:0009922) 3-oxo-arachidoyl-CoA synthase activity(GO:0102336) 3-oxo-cerotoyl-CoA synthase activity(GO:0102337) 3-oxo-lignoceronyl-CoA synthase activity(GO:0102338) |
| 0.0 | 0.9 | GO:0050136 | NADH dehydrogenase (ubiquinone) activity(GO:0008137) NADH dehydrogenase (quinone) activity(GO:0050136) |
| 0.0 | 0.9 | GO:0071837 | HMG box domain binding(GO:0071837) |
| 0.0 | 0.1 | GO:0031821 | G-protein coupled serotonin receptor binding(GO:0031821) |
| 0.0 | 0.1 | GO:0016309 | 1-phosphatidylinositol-5-phosphate 4-kinase activity(GO:0016309) |
| 0.0 | 0.5 | GO:0016676 | cytochrome-c oxidase activity(GO:0004129) heme-copper terminal oxidase activity(GO:0015002) oxidoreductase activity, acting on a heme group of donors, oxygen as acceptor(GO:0016676) |
| 0.0 | 0.3 | GO:0031386 | protein tag(GO:0031386) |
| 0.0 | 1.0 | GO:0061631 | ubiquitin conjugating enzyme activity(GO:0061631) |
| 0.0 | 0.9 | GO:0032266 | phosphatidylinositol-3-phosphate binding(GO:0032266) |
| 0.0 | 0.1 | GO:0045545 | syndecan binding(GO:0045545) |
| 0.0 | 1.1 | GO:0030374 | ligand-dependent nuclear receptor transcription coactivator activity(GO:0030374) |
| 0.0 | 0.2 | GO:0070577 | lysine-acetylated histone binding(GO:0070577) |
| 0.0 | 0.2 | GO:0035198 | miRNA binding(GO:0035198) |
| 0.0 | 0.1 | GO:0008190 | eukaryotic initiation factor 4E binding(GO:0008190) |