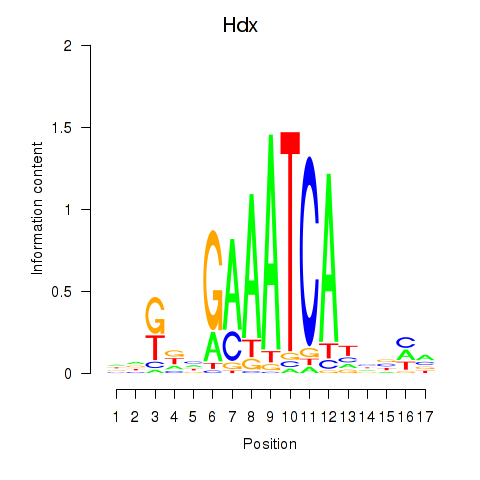
Motif ID: Hdx
Z-value: 9.112

Transcription factors associated with Hdx:
| Gene Symbol | Entrez ID | Gene Name |
|---|---|---|
| Hdx | ENSMUSG00000034551.6 | Hdx |
Activity-expression correlation:
| Gene Symbol | Promoter | Pearson corr. coef. | P-value | Plot |
|---|---|---|---|---|
| Hdx | mm10_v2_chrX_-_111697069_111697127 | -0.15 | 6.2e-01 | Click! |
Top targets:
Gene overrepresentation in biological_process category:
| Log-likelihood per target | Total log-likelihood | Term | Description |
|---|---|---|---|
| 1.2 | 7.5 | GO:0006957 | complement activation, alternative pathway(GO:0006957) |
| 0.6 | 4.3 | GO:0002002 | regulation of angiotensin levels in blood(GO:0002002) |
| 0.4 | 4.1 | GO:0030432 | peristalsis(GO:0030432) |
| 0.4 | 1.1 | GO:1901420 | negative regulation of response to alcohol(GO:1901420) |
| 0.3 | 3.5 | GO:0051901 | positive regulation of mitochondrial depolarization(GO:0051901) |
| 0.2 | 3.7 | GO:0003215 | cardiac right ventricle morphogenesis(GO:0003215) |
| 0.1 | 1.7 | GO:0015812 | gamma-aminobutyric acid transport(GO:0015812) |
| 0.1 | 4.9 | GO:0038083 | peptidyl-tyrosine autophosphorylation(GO:0038083) |
| 0.1 | 1298.7 | GO:0008150 | biological_process(GO:0008150) |
Gene overrepresentation in cellular_component category:
| Log-likelihood per target | Total log-likelihood | Term | Description |
|---|---|---|---|
| 0.2 | 3.5 | GO:0043203 | axon hillock(GO:0043203) |
| 0.1 | 1329.2 | GO:0005575 | cellular_component(GO:0005575) |
Gene overrepresentation in molecular_function category:
| Log-likelihood per target | Total log-likelihood | Term | Description |
|---|---|---|---|
| 2.5 | 7.5 | GO:0001851 | complement component C3b binding(GO:0001851) |
| 0.7 | 4.1 | GO:0004983 | neuropeptide Y receptor activity(GO:0004983) |
| 0.6 | 1.7 | GO:0005332 | gamma-aminobutyric acid:sodium symporter activity(GO:0005332) |
| 0.3 | 5.9 | GO:0005184 | neuropeptide hormone activity(GO:0005184) |
| 0.2 | 1.1 | GO:0070330 | aromatase activity(GO:0070330) |
| 0.2 | 3.4 | GO:0004181 | metallocarboxypeptidase activity(GO:0004181) |
| 0.1 | 4.9 | GO:0004715 | non-membrane spanning protein tyrosine kinase activity(GO:0004715) |
| 0.1 | 1312.7 | GO:0003674 | molecular_function(GO:0003674) |


