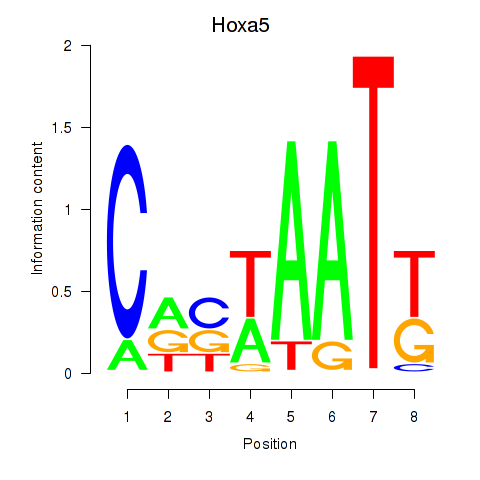
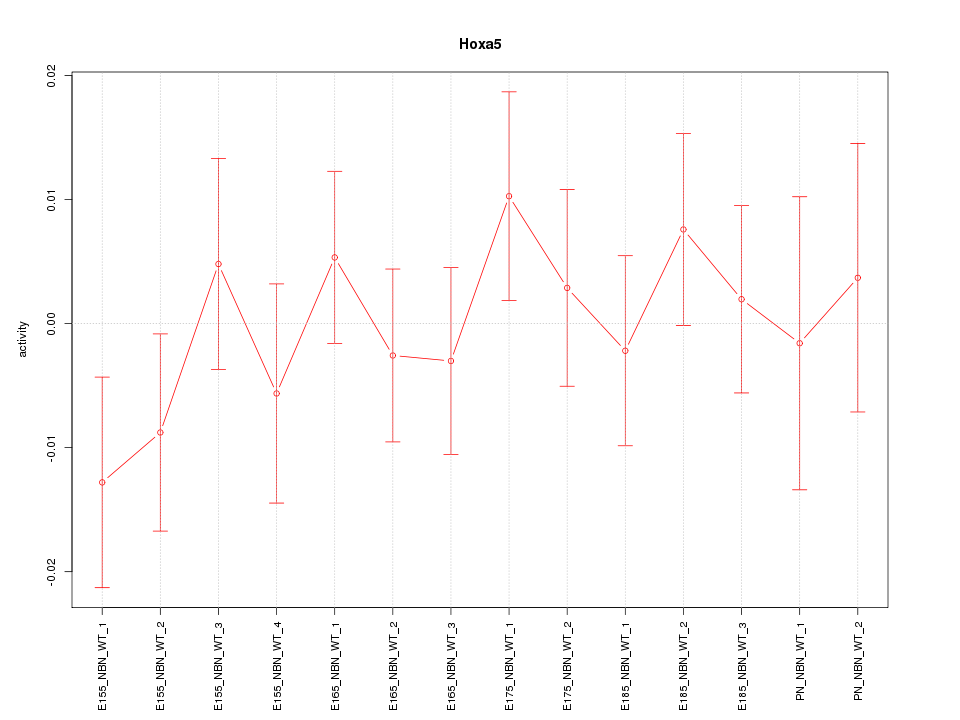
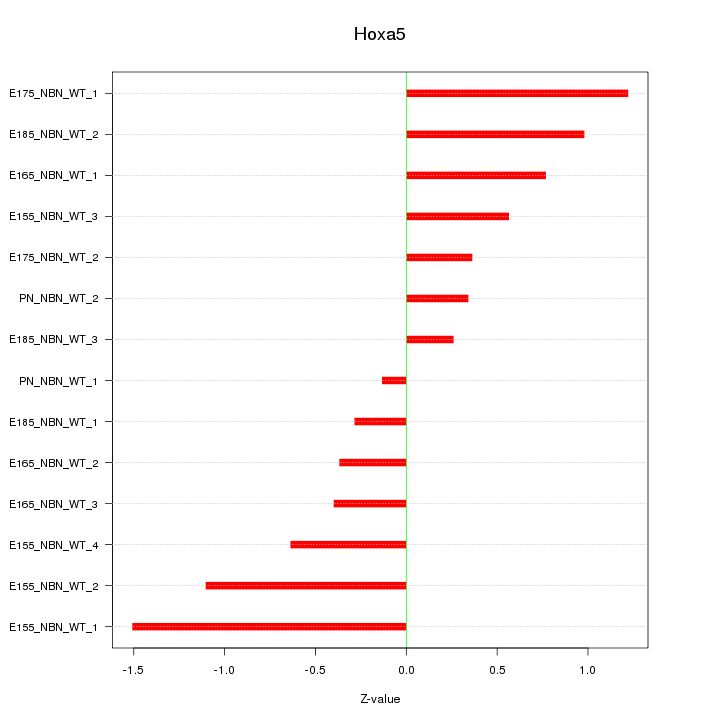
Motif ID: Hoxa5
Z-value: 0.755
Transcription factors associated with Hoxa5:
| Gene Symbol | Entrez ID | Gene Name |
|---|---|---|
| Hoxa5 | ENSMUSG00000038253.6 | Hoxa5 |

Top targets:
Gene overrepresentation in biological_process category:
| Log-likelihood per target | Total log-likelihood | Term | Description |
|---|---|---|---|
| 0.5 | 3.5 | GO:0060666 | dichotomous subdivision of terminal units involved in salivary gland branching(GO:0060666) |
| 0.3 | 0.9 | GO:0046368 | GDP-L-fucose metabolic process(GO:0046368) |
| 0.3 | 1.1 | GO:0010040 | response to iron(II) ion(GO:0010040) positive regulation of hydrogen peroxide metabolic process(GO:0010726) negative regulation of synaptic transmission, dopaminergic(GO:0032227) negative regulation of catecholamine metabolic process(GO:0045914) negative regulation of dopamine metabolic process(GO:0045963) cellular response to copper ion(GO:0071280) regulation of peroxidase activity(GO:2000468) |
| 0.2 | 1.6 | GO:1990118 | sodium ion import across plasma membrane(GO:0098719) sodium ion import into cell(GO:1990118) |
| 0.2 | 0.6 | GO:0019343 | cysteine biosynthetic process via cystathionine(GO:0019343) cysteine biosynthetic process(GO:0019344) |
| 0.2 | 0.8 | GO:0038145 | macrophage colony-stimulating factor signaling pathway(GO:0038145) |
| 0.2 | 0.6 | GO:0043181 | vacuolar sequestering(GO:0043181) |
| 0.2 | 0.8 | GO:1903800 | positive regulation of production of miRNAs involved in gene silencing by miRNA(GO:1903800) |
| 0.1 | 0.4 | GO:1990481 | mRNA pseudouridine synthesis(GO:1990481) |
| 0.1 | 0.3 | GO:0042196 | dichloromethane metabolic process(GO:0018900) chlorinated hydrocarbon metabolic process(GO:0042196) halogenated hydrocarbon metabolic process(GO:0042197) |
| 0.1 | 0.4 | GO:0001920 | negative regulation of receptor recycling(GO:0001920) |
| 0.1 | 0.3 | GO:0015920 | regulation of phosphatidylcholine catabolic process(GO:0010899) lipopolysaccharide transport(GO:0015920) |
| 0.1 | 0.3 | GO:0002184 | cytoplasmic translational termination(GO:0002184) |
| 0.1 | 0.2 | GO:1902498 | regulation of protein autoubiquitination(GO:1902498) |
| 0.1 | 0.7 | GO:1902969 | mitotic DNA replication(GO:1902969) |
| 0.1 | 0.2 | GO:0002430 | complement receptor mediated signaling pathway(GO:0002430) |
| 0.1 | 0.7 | GO:0019532 | oxalate transport(GO:0019532) |
| 0.1 | 0.8 | GO:0060665 | regulation of branching involved in salivary gland morphogenesis by mesenchymal-epithelial signaling(GO:0060665) |
| 0.1 | 0.8 | GO:0043615 | astrocyte cell migration(GO:0043615) |
| 0.1 | 2.1 | GO:2000310 | regulation of N-methyl-D-aspartate selective glutamate receptor activity(GO:2000310) |
| 0.1 | 0.4 | GO:0070327 | thyroid hormone transport(GO:0070327) |
| 0.1 | 0.4 | GO:2000325 | regulation of ligand-dependent nuclear receptor transcription coactivator activity(GO:2000325) positive regulation of ligand-dependent nuclear receptor transcription coactivator activity(GO:2000327) |
| 0.1 | 0.2 | GO:2000642 | negative regulation of early endosome to late endosome transport(GO:2000642) |
| 0.1 | 0.2 | GO:2000314 | negative regulation of fibroblast growth factor receptor signaling pathway involved in neural plate anterior/posterior pattern formation(GO:2000314) |
| 0.1 | 1.0 | GO:0001731 | formation of translation preinitiation complex(GO:0001731) |
| 0.1 | 0.1 | GO:0000821 | regulation of arginine metabolic process(GO:0000821) |
| 0.1 | 0.4 | GO:2000807 | regulation of synaptic vesicle clustering(GO:2000807) |
| 0.1 | 0.2 | GO:0090069 | regulation of ribosome biogenesis(GO:0090069) |
| 0.1 | 2.0 | GO:0032728 | positive regulation of interferon-beta production(GO:0032728) |
| 0.1 | 0.4 | GO:0016584 | nucleosome positioning(GO:0016584) |
| 0.1 | 0.2 | GO:0071921 | establishment of sister chromatid cohesion(GO:0034085) cohesin loading(GO:0071921) regulation of cohesin loading(GO:0071922) |
| 0.1 | 0.2 | GO:0021529 | spinal cord oligodendrocyte cell differentiation(GO:0021529) spinal cord oligodendrocyte cell fate specification(GO:0021530) |
| 0.1 | 0.2 | GO:0006348 | chromatin silencing at telomere(GO:0006348) |
| 0.1 | 0.2 | GO:1903215 | regulation of mRNA modification(GO:0090365) negative regulation of protein targeting to mitochondrion(GO:1903215) |
| 0.1 | 0.2 | GO:1902396 | protein localization to bicellular tight junction(GO:1902396) |
| 0.1 | 0.5 | GO:0035095 | behavioral response to nicotine(GO:0035095) |
| 0.0 | 0.2 | GO:2000587 | regulation of platelet-derived growth factor receptor-beta signaling pathway(GO:2000586) negative regulation of platelet-derived growth factor receptor-beta signaling pathway(GO:2000587) |
| 0.0 | 0.3 | GO:0009449 | gamma-aminobutyric acid biosynthetic process(GO:0009449) |
| 0.0 | 0.3 | GO:0061092 | regulation of phospholipid translocation(GO:0061091) positive regulation of phospholipid translocation(GO:0061092) |
| 0.0 | 0.1 | GO:0002922 | positive regulation of humoral immune response(GO:0002922) |
| 0.0 | 0.1 | GO:0010636 | positive regulation of mitochondrial fusion(GO:0010636) |
| 0.0 | 0.1 | GO:0090310 | negative regulation of methylation-dependent chromatin silencing(GO:0090310) |
| 0.0 | 0.1 | GO:0050904 | diapedesis(GO:0050904) |
| 0.0 | 0.1 | GO:0036092 | phosphatidylinositol-3-phosphate biosynthetic process(GO:0036092) |
| 0.0 | 0.7 | GO:0001886 | endothelial cell morphogenesis(GO:0001886) |
| 0.0 | 0.2 | GO:0010890 | positive regulation of sequestering of triglyceride(GO:0010890) |
| 0.0 | 0.2 | GO:0045078 | positive regulation of interferon-gamma biosynthetic process(GO:0045078) |
| 0.0 | 0.1 | GO:2001180 | negative regulation of interleukin-18 production(GO:0032701) negative regulation of interleukin-10 secretion(GO:2001180) |
| 0.0 | 0.7 | GO:0002495 | antigen processing and presentation of peptide antigen via MHC class II(GO:0002495) |
| 0.0 | 0.1 | GO:0006097 | glyoxylate cycle(GO:0006097) |
| 0.0 | 0.2 | GO:0046602 | regulation of mitotic centrosome separation(GO:0046602) |
| 0.0 | 0.4 | GO:0097067 | cellular response to thyroid hormone stimulus(GO:0097067) |
| 0.0 | 0.2 | GO:0070427 | nucleotide-binding oligomerization domain containing 1 signaling pathway(GO:0070427) |
| 0.0 | 0.2 | GO:0090074 | negative regulation of protein homodimerization activity(GO:0090074) |
| 0.0 | 0.1 | GO:0042360 | vitamin E metabolic process(GO:0042360) |
| 0.0 | 0.1 | GO:0006742 | NADP catabolic process(GO:0006742) pyridine nucleotide catabolic process(GO:0019364) |
| 0.0 | 0.3 | GO:0051574 | positive regulation of histone H3-K9 methylation(GO:0051574) |
| 0.0 | 0.1 | GO:0006547 | histidine metabolic process(GO:0006547) |
| 0.0 | 0.1 | GO:0046601 | positive regulation of centriole replication(GO:0046601) |
| 0.0 | 0.1 | GO:0090168 | Golgi reassembly(GO:0090168) |
| 0.0 | 0.1 | GO:0051599 | response to hydrostatic pressure(GO:0051599) |
| 0.0 | 0.2 | GO:0008272 | sulfate transport(GO:0008272) |
| 0.0 | 0.7 | GO:0045879 | negative regulation of smoothened signaling pathway(GO:0045879) |
| 0.0 | 0.6 | GO:0009409 | response to cold(GO:0009409) |
| 0.0 | 0.1 | GO:0090327 | negative regulation of locomotion involved in locomotory behavior(GO:0090327) |
| 0.0 | 0.3 | GO:0035269 | protein O-linked mannosylation(GO:0035269) |
| 0.0 | 0.3 | GO:0048240 | sperm capacitation(GO:0048240) |
| 0.0 | 0.1 | GO:0042511 | positive regulation of tyrosine phosphorylation of Stat1 protein(GO:0042511) |
| 0.0 | 0.1 | GO:1900736 | regulation of phospholipase C-activating G-protein coupled receptor signaling pathway(GO:1900736) |
| 0.0 | 0.1 | GO:0006046 | N-acetylglucosamine catabolic process(GO:0006046) |
| 0.0 | 0.2 | GO:0019065 | receptor-mediated endocytosis of virus by host cell(GO:0019065) endocytosis involved in viral entry into host cell(GO:0075509) |
| 0.0 | 0.1 | GO:1901164 | negative regulation of trophoblast cell migration(GO:1901164) |
| 0.0 | 0.1 | GO:0021508 | floor plate formation(GO:0021508) floor plate morphogenesis(GO:0033505) |
| 0.0 | 0.2 | GO:0036158 | outer dynein arm assembly(GO:0036158) |
| 0.0 | 0.1 | GO:0006452 | translational frameshifting(GO:0006452) positive regulation of translational termination(GO:0045905) |
| 0.0 | 0.1 | GO:0071033 | nuclear retention of pre-mRNA at the site of transcription(GO:0071033) CUT catabolic process(GO:0071034) CUT metabolic process(GO:0071043) |
| 0.0 | 0.1 | GO:0019673 | GDP-mannose metabolic process(GO:0019673) |
| 0.0 | 0.1 | GO:0016560 | protein import into peroxisome matrix, docking(GO:0016560) |
| 0.0 | 0.1 | GO:1900095 | regulation of dosage compensation by inactivation of X chromosome(GO:1900095) |
| 0.0 | 0.1 | GO:0032511 | late endosome to vacuole transport via multivesicular body sorting pathway(GO:0032511) protein targeting to vacuole involved in ubiquitin-dependent protein catabolic process via the multivesicular body sorting pathway(GO:0043328) |
| 0.0 | 0.3 | GO:0070050 | neuron cellular homeostasis(GO:0070050) |
| 0.0 | 0.2 | GO:0032096 | negative regulation of response to food(GO:0032096) negative regulation of appetite(GO:0032099) |
| 0.0 | 0.5 | GO:0097120 | receptor localization to synapse(GO:0097120) |
| 0.0 | 0.3 | GO:0006953 | acute-phase response(GO:0006953) |
| 0.0 | 0.0 | GO:0044028 | DNA hypomethylation(GO:0044028) hypomethylation of CpG island(GO:0044029) |
| 0.0 | 0.1 | GO:0045054 | constitutive secretory pathway(GO:0045054) |
| 0.0 | 0.2 | GO:0035721 | intraciliary retrograde transport(GO:0035721) |
| 0.0 | 0.3 | GO:0043968 | histone H2A acetylation(GO:0043968) |
| 0.0 | 0.2 | GO:0060134 | prepulse inhibition(GO:0060134) |
| 0.0 | 0.2 | GO:0071624 | positive regulation of granulocyte chemotaxis(GO:0071624) positive regulation of neutrophil chemotaxis(GO:0090023) |
| 0.0 | 0.1 | GO:0007512 | adult heart development(GO:0007512) |
| 0.0 | 0.1 | GO:0051661 | maintenance of centrosome location(GO:0051661) |
| 0.0 | 1.1 | GO:0007156 | homophilic cell adhesion via plasma membrane adhesion molecules(GO:0007156) |
| 0.0 | 0.1 | GO:0051013 | microtubule severing(GO:0051013) |
| 0.0 | 0.2 | GO:0045653 | negative regulation of megakaryocyte differentiation(GO:0045653) |
| 0.0 | 0.2 | GO:0010457 | centriole-centriole cohesion(GO:0010457) |
| 0.0 | 0.2 | GO:0007194 | negative regulation of adenylate cyclase activity(GO:0007194) |
| 0.0 | 0.1 | GO:0000707 | meiotic DNA recombinase assembly(GO:0000707) |
| 0.0 | 0.0 | GO:0031038 | myosin II filament organization(GO:0031038) regulation of myosin II filament organization(GO:0043519) |
| 0.0 | 0.1 | GO:0007221 | positive regulation of transcription of Notch receptor target(GO:0007221) |
| 0.0 | 0.2 | GO:0032757 | positive regulation of interleukin-8 production(GO:0032757) |
| 0.0 | 0.6 | GO:0010501 | RNA secondary structure unwinding(GO:0010501) |
| 0.0 | 0.1 | GO:0042435 | indole-containing compound biosynthetic process(GO:0042435) |
| 0.0 | 0.2 | GO:0003215 | cardiac right ventricle morphogenesis(GO:0003215) |
| 0.0 | 0.1 | GO:0006390 | transcription from mitochondrial promoter(GO:0006390) |
| 0.0 | 0.3 | GO:0031571 | mitotic G1 DNA damage checkpoint(GO:0031571) |
| 0.0 | 0.1 | GO:0090022 | regulation of neutrophil chemotaxis(GO:0090022) |
| 0.0 | 0.0 | GO:0046654 | 10-formyltetrahydrofolate metabolic process(GO:0009256) tetrahydrofolate biosynthetic process(GO:0046654) |
| 0.0 | 0.1 | GO:0061368 | behavioral response to chemical pain(GO:0061366) behavioral response to formalin induced pain(GO:0061368) |
Gene overrepresentation in cellular_component category:
| Log-likelihood per target | Total log-likelihood | Term | Description |
|---|---|---|---|
| 0.3 | 1.1 | GO:0031092 | platelet alpha granule membrane(GO:0031092) |
| 0.3 | 0.8 | GO:1990682 | CSF1-CSF1R complex(GO:1990682) |
| 0.3 | 0.8 | GO:0031983 | vesicle lumen(GO:0031983) |
| 0.2 | 0.5 | GO:0000811 | GINS complex(GO:0000811) |
| 0.1 | 0.6 | GO:0048237 | rough endoplasmic reticulum lumen(GO:0048237) |
| 0.1 | 0.3 | GO:0018444 | translation release factor complex(GO:0018444) |
| 0.1 | 0.4 | GO:0002177 | manchette(GO:0002177) |
| 0.1 | 0.9 | GO:0032580 | Golgi cisterna membrane(GO:0032580) |
| 0.1 | 0.2 | GO:0036387 | nuclear pre-replicative complex(GO:0005656) pre-replicative complex(GO:0036387) |
| 0.1 | 0.6 | GO:0043083 | synaptic cleft(GO:0043083) |
| 0.1 | 0.3 | GO:0035032 | phosphatidylinositol 3-kinase complex, class III(GO:0035032) |
| 0.0 | 0.5 | GO:0005892 | acetylcholine-gated channel complex(GO:0005892) |
| 0.0 | 0.2 | GO:0097450 | astrocyte end-foot(GO:0097450) |
| 0.0 | 0.5 | GO:0030057 | desmosome(GO:0030057) |
| 0.0 | 0.2 | GO:0032777 | Piccolo NuA4 histone acetyltransferase complex(GO:0032777) |
| 0.0 | 0.4 | GO:0000124 | SAGA complex(GO:0000124) |
| 0.0 | 0.1 | GO:0090661 | box H/ACA telomerase RNP complex(GO:0090661) |
| 0.0 | 0.2 | GO:0001651 | dense fibrillar component(GO:0001651) |
| 0.0 | 0.8 | GO:0016581 | NuRD complex(GO:0016581) CHD-type complex(GO:0090545) |
| 0.0 | 0.3 | GO:0061574 | ASAP complex(GO:0061574) |
| 0.0 | 0.2 | GO:0032009 | early phagosome(GO:0032009) |
| 0.0 | 0.2 | GO:0033269 | internode region of axon(GO:0033269) |
| 0.0 | 0.0 | GO:0070419 | nonhomologous end joining complex(GO:0070419) |
| 0.0 | 0.1 | GO:0031314 | extrinsic component of mitochondrial inner membrane(GO:0031314) |
| 0.0 | 0.2 | GO:0008278 | cohesin complex(GO:0008278) |
| 0.0 | 0.1 | GO:0017071 | intracellular cyclic nucleotide activated cation channel complex(GO:0017071) |
| 0.0 | 0.1 | GO:0000814 | ESCRT II complex(GO:0000814) |
| 0.0 | 0.7 | GO:0032588 | trans-Golgi network membrane(GO:0032588) |
| 0.0 | 0.2 | GO:0030991 | intraciliary transport particle A(GO:0030991) |
| 0.0 | 0.3 | GO:0031528 | microvillus membrane(GO:0031528) |
| 0.0 | 0.1 | GO:0042583 | chromaffin granule(GO:0042583) |
| 0.0 | 0.2 | GO:0030122 | AP-2 adaptor complex(GO:0030122) |
| 0.0 | 0.1 | GO:0098536 | deuterosome(GO:0098536) |
| 0.0 | 0.1 | GO:0031315 | extrinsic component of mitochondrial outer membrane(GO:0031315) |
| 0.0 | 0.3 | GO:0002080 | acrosomal membrane(GO:0002080) |
| 0.0 | 0.2 | GO:0034361 | very-low-density lipoprotein particle(GO:0034361) triglyceride-rich lipoprotein particle(GO:0034385) |
| 0.0 | 0.0 | GO:0005943 | phosphatidylinositol 3-kinase complex, class IA(GO:0005943) |
| 0.0 | 0.2 | GO:0008290 | F-actin capping protein complex(GO:0008290) |
| 0.0 | 0.9 | GO:0009925 | basal plasma membrane(GO:0009925) |
| 0.0 | 0.2 | GO:0005952 | cAMP-dependent protein kinase complex(GO:0005952) |
| 0.0 | 0.1 | GO:0045298 | tubulin complex(GO:0045298) |
| 0.0 | 0.1 | GO:0036449 | microtubule minus-end(GO:0036449) |
| 0.0 | 0.2 | GO:0005662 | DNA replication factor A complex(GO:0005662) |
| 0.0 | 0.1 | GO:0031080 | nuclear pore outer ring(GO:0031080) |
| 0.0 | 0.2 | GO:0048188 | MLL3/4 complex(GO:0044666) Set1C/COMPASS complex(GO:0048188) |
| 0.0 | 0.2 | GO:0005665 | DNA-directed RNA polymerase II, core complex(GO:0005665) |
| 0.0 | 0.3 | GO:0005666 | DNA-directed RNA polymerase III complex(GO:0005666) |
| 0.0 | 0.2 | GO:0031143 | pseudopodium(GO:0031143) |
| 0.0 | 0.3 | GO:0060077 | inhibitory synapse(GO:0060077) |
| 0.0 | 0.0 | GO:0031088 | platelet dense granule membrane(GO:0031088) |
| 0.0 | 1.5 | GO:0055037 | recycling endosome(GO:0055037) |
| 0.0 | 0.0 | GO:0000408 | EKC/KEOPS complex(GO:0000408) |
| 0.0 | 0.2 | GO:0005852 | eukaryotic translation initiation factor 3 complex(GO:0005852) |
| 0.0 | 0.1 | GO:0033063 | Rad51B-Rad51C-Rad51D-XRCC2 complex(GO:0033063) |
Gene overrepresentation in molecular_function category:
| Log-likelihood per target | Total log-likelihood | Term | Description |
|---|---|---|---|
| 0.3 | 3.5 | GO:0038191 | neuropilin binding(GO:0038191) |
| 0.3 | 0.8 | GO:0005006 | epidermal growth factor-activated receptor activity(GO:0005006) |
| 0.2 | 0.8 | GO:0005008 | hepatocyte growth factor-activated receptor activity(GO:0005008) |
| 0.2 | 1.6 | GO:0005451 | monovalent cation:proton antiporter activity(GO:0005451) sodium:proton antiporter activity(GO:0015385) potassium:proton antiporter activity(GO:0015386) |
| 0.2 | 0.6 | GO:0032450 | oligo-1,6-glucosidase activity(GO:0004574) maltose alpha-glucosidase activity(GO:0032450) |
| 0.2 | 0.6 | GO:0098809 | nitrite reductase activity(GO:0098809) |
| 0.2 | 1.1 | GO:0050544 | arachidonic acid binding(GO:0050544) |
| 0.1 | 0.3 | GO:0019120 | hydrolase activity, acting on acid halide bonds(GO:0016824) hydrolase activity, acting on acid halide bonds, in C-halide compounds(GO:0019120) alkylhalidase activity(GO:0047651) |
| 0.1 | 0.3 | GO:0001875 | lipopolysaccharide receptor activity(GO:0001875) |
| 0.1 | 0.4 | GO:0015349 | thyroid hormone transmembrane transporter activity(GO:0015349) |
| 0.1 | 0.3 | GO:0071987 | WD40-repeat domain binding(GO:0071987) |
| 0.1 | 0.8 | GO:0019531 | oxalate transmembrane transporter activity(GO:0019531) |
| 0.1 | 0.2 | GO:0004566 | beta-glucuronidase activity(GO:0004566) |
| 0.1 | 0.2 | GO:0015038 | glutathione disulfide oxidoreductase activity(GO:0015038) protein-disulfide reductase (glutathione) activity(GO:0019153) |
| 0.1 | 0.2 | GO:0035402 | histone kinase activity (H3-T11 specific)(GO:0035402) |
| 0.1 | 0.2 | GO:0004942 | anaphylatoxin receptor activity(GO:0004942) |
| 0.0 | 0.3 | GO:0004351 | glutamate decarboxylase activity(GO:0004351) |
| 0.0 | 0.3 | GO:0052630 | CTP:2,3-di-O-geranylgeranyl-sn-glycero-1-phosphate cytidyltransferase activity(GO:0043338) phospholactate guanylyltransferase activity(GO:0043814) ATP:coenzyme F420 adenylyltransferase activity(GO:0043910) UDP-N-acetylgalactosamine diphosphorylase activity(GO:0052630) |
| 0.0 | 0.1 | GO:0001851 | complement component C3b binding(GO:0001851) proteinase activated receptor binding(GO:0031871) |
| 0.0 | 0.2 | GO:0032422 | purine-rich negative regulatory element binding(GO:0032422) |
| 0.0 | 0.2 | GO:0004954 | icosanoid receptor activity(GO:0004953) prostanoid receptor activity(GO:0004954) prostaglandin receptor activity(GO:0004955) |
| 0.0 | 0.7 | GO:0043138 | 3'-5' DNA helicase activity(GO:0043138) |
| 0.0 | 0.5 | GO:0004889 | acetylcholine-activated cation-selective channel activity(GO:0004889) |
| 0.0 | 0.1 | GO:0043120 | tumor necrosis factor binding(GO:0043120) |
| 0.0 | 0.3 | GO:0045028 | G-protein coupled nucleotide receptor activity(GO:0001608) G-protein coupled purinergic nucleotide receptor activity(GO:0045028) |
| 0.0 | 0.3 | GO:0001025 | RNA polymerase III transcription factor binding(GO:0001025) |
| 0.0 | 0.1 | GO:0048763 | calcium-induced calcium release activity(GO:0048763) |
| 0.0 | 0.7 | GO:0042287 | MHC protein binding(GO:0042287) |
| 0.0 | 0.3 | GO:0003747 | translation release factor activity(GO:0003747) translation termination factor activity(GO:0008079) |
| 0.0 | 0.1 | GO:0034513 | box H/ACA snoRNA binding(GO:0034513) |
| 0.0 | 0.1 | GO:0016509 | long-chain-3-hydroxyacyl-CoA dehydrogenase activity(GO:0016509) |
| 0.0 | 0.1 | GO:0004450 | isocitrate dehydrogenase (NADP+) activity(GO:0004450) |
| 0.0 | 0.1 | GO:0004531 | deoxyribonuclease II activity(GO:0004531) |
| 0.0 | 0.2 | GO:0016841 | ammonia-lyase activity(GO:0016841) |
| 0.0 | 1.0 | GO:0008009 | chemokine activity(GO:0008009) |
| 0.0 | 0.2 | GO:0004691 | cAMP-dependent protein kinase activity(GO:0004691) |
| 0.0 | 0.1 | GO:0016175 | superoxide-generating NADPH oxidase activity(GO:0016175) |
| 0.0 | 0.2 | GO:0042134 | rRNA primary transcript binding(GO:0042134) |
| 0.0 | 0.6 | GO:0004385 | guanylate kinase activity(GO:0004385) |
| 0.0 | 0.1 | GO:0004342 | glucosamine-6-phosphate deaminase activity(GO:0004342) |
| 0.0 | 0.1 | GO:0004300 | enoyl-CoA hydratase activity(GO:0004300) |
| 0.0 | 0.1 | GO:0070579 | methylcytosine dioxygenase activity(GO:0070579) |
| 0.0 | 0.1 | GO:0004427 | inorganic diphosphatase activity(GO:0004427) |
| 0.0 | 0.2 | GO:0034951 | pivalyl-CoA mutase activity(GO:0034784) o-hydroxylaminobenzoate mutase activity(GO:0034951) lupeol synthase activity(GO:0042299) beta-amyrin synthase activity(GO:0042300) baruol synthase activity(GO:0080011) |
| 0.0 | 0.1 | GO:0043325 | phosphatidylinositol-3,4-bisphosphate binding(GO:0043325) |
| 0.0 | 0.5 | GO:0005528 | macrolide binding(GO:0005527) FK506 binding(GO:0005528) |
| 0.0 | 0.1 | GO:0016861 | intramolecular oxidoreductase activity, interconverting aldoses and ketoses(GO:0016861) |
| 0.0 | 2.3 | GO:0005089 | Rho guanyl-nucleotide exchange factor activity(GO:0005089) |
| 0.0 | 0.1 | GO:0005052 | peroxisome matrix targeting signal-1 binding(GO:0005052) |
| 0.0 | 0.1 | GO:0010484 | H3 histone acetyltransferase activity(GO:0010484) |
| 0.0 | 1.2 | GO:0003743 | translation initiation factor activity(GO:0003743) |
| 0.0 | 0.1 | GO:0019960 | C-X3-C chemokine binding(GO:0019960) |
| 0.0 | 0.4 | GO:0032183 | SUMO binding(GO:0032183) |
| 0.0 | 0.2 | GO:0010314 | phosphatidylinositol-5-phosphate binding(GO:0010314) |
| 0.0 | 0.1 | GO:0008475 | procollagen-lysine 5-dioxygenase activity(GO:0008475) |
| 0.0 | 0.3 | GO:0042556 | cobinamide kinase activity(GO:0008819) phytol kinase activity(GO:0010276) oxidoreductase activity, acting on other nitrogenous compounds as donors, cytochrome as acceptor(GO:0016662) phenol kinase activity(GO:0018720) cyclin-dependent protein kinase activating kinase regulator activity(GO:0019914) inositol tetrakisphosphate 2-kinase activity(GO:0032942) heptose 7-phosphate kinase activity(GO:0033785) aminoglycoside phosphotransferase activity(GO:0034071) eukaryotic elongation factor-2 kinase regulator activity(GO:0042556) eukaryotic elongation factor-2 kinase activator activity(GO:0042557) LPPG:FO 2-phospho-L-lactate transferase activity(GO:0043743) cytidine kinase activity(GO:0043771) glycerate 2-kinase activity(GO:0043798) (S)-lactate 2-kinase activity(GO:0043841) phosphoserine:homoserine phosphotransferase activity(GO:0043899) L-seryl-tRNA(Sec) kinase activity(GO:0043915) phosphocholine transferase activity(GO:0044605) GTP-dependent polynucleotide kinase activity(GO:0051735) farnesol kinase activity(GO:0052668) CTP:2-trans,-6-trans-farnesol kinase activity(GO:0052669) geraniol kinase activity(GO:0052670) geranylgeraniol kinase activity(GO:0052671) CTP:geranylgeraniol kinase activity(GO:0052672) prenol kinase activity(GO:0052673) 1-phosphatidylinositol-5-kinase activity(GO:0052810) 1-phosphatidylinositol-3-phosphate 4-kinase activity(GO:0052811) phosphatidylinositol-3,4-bisphosphate 5-kinase activity(GO:0052812) inositol-3,4,6-trisphosphate 1-kinase activity(GO:0052835) inositol 5-diphosphate pentakisphosphate 5-kinase activity(GO:0052836) inositol diphosphate tetrakisphosphate kinase activity(GO:0052839) |
| 0.0 | 0.3 | GO:0004012 | phospholipid-translocating ATPase activity(GO:0004012) |
| 0.0 | 0.1 | GO:0004565 | beta-galactosidase activity(GO:0004565) |
| 0.0 | 0.2 | GO:0048273 | mitogen-activated protein kinase p38 binding(GO:0048273) |
| 0.0 | 0.1 | GO:0004614 | phosphoglucomutase activity(GO:0004614) |
| 0.0 | 0.4 | GO:0045295 | gamma-catenin binding(GO:0045295) |
| 0.0 | 0.1 | GO:0103116 | alpha-D-galactofuranose transporter activity(GO:0103116) |
| 0.0 | 0.2 | GO:0005035 | tumor necrosis factor-activated receptor activity(GO:0005031) death receptor activity(GO:0005035) |
| 0.0 | 0.1 | GO:0005094 | Rho GDP-dissociation inhibitor activity(GO:0005094) |
| 0.0 | 0.0 | GO:0016835 | carbon-oxygen lyase activity(GO:0016835) |
| 0.0 | 0.1 | GO:1990254 | keratin filament binding(GO:1990254) |
| 0.0 | 0.3 | GO:0005044 | scavenger receptor activity(GO:0005044) |
| 0.0 | 0.2 | GO:0031418 | L-ascorbic acid binding(GO:0031418) |
| 0.0 | 0.3 | GO:0001056 | RNA polymerase III activity(GO:0001056) |
| 0.0 | 1.8 | GO:0001078 | transcriptional repressor activity, RNA polymerase II core promoter proximal region sequence-specific binding(GO:0001078) |
| 0.0 | 0.0 | GO:0061711 | N(6)-L-threonylcarbamoyladenine synthase(GO:0061711) |
| 0.0 | 0.5 | GO:0005547 | phosphatidylinositol-3,4,5-trisphosphate binding(GO:0005547) |
| 0.0 | 0.2 | GO:0035004 | 1-phosphatidylinositol-3-kinase activity(GO:0016303) phosphatidylinositol 3-kinase activity(GO:0035004) |
| 0.0 | 0.1 | GO:0032050 | clathrin heavy chain binding(GO:0032050) |
| 0.0 | 0.0 | GO:0004488 | methylenetetrahydrofolate dehydrogenase (NADP+) activity(GO:0004488) |
| 0.0 | 0.1 | GO:0031419 | cobalamin binding(GO:0031419) |