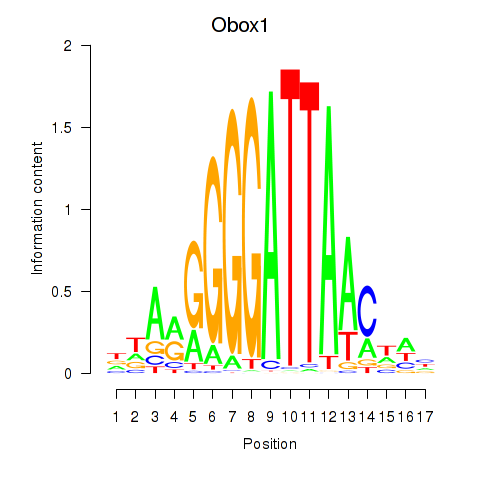
Motif ID: Obox1
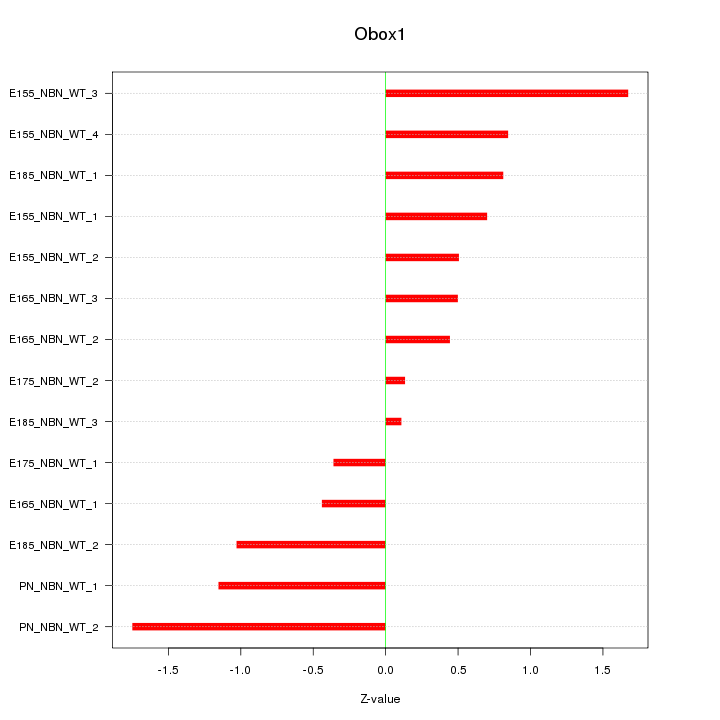
Z-value: 0.893
Transcription factors associated with Obox1:
| Gene Symbol | Entrez ID | Gene Name |
|---|---|---|
| Obox1 | ENSMUSG00000054310.10 | Obox1 |

Top targets:
Gene overrepresentation in biological_process category:
| Log-likelihood per target | Total log-likelihood | Term | Description |
|---|---|---|---|
| 0.4 | 1.6 | GO:1990743 | protein sialylation(GO:1990743) |
| 0.3 | 4.3 | GO:0097688 | AMPA glutamate receptor clustering(GO:0097113) glutamate receptor clustering(GO:0097688) |
| 0.2 | 0.6 | GO:1903232 | melanosome assembly(GO:1903232) |
| 0.2 | 1.3 | GO:0071361 | cellular response to zinc ion(GO:0071294) cellular response to ethanol(GO:0071361) |
| 0.2 | 0.5 | GO:0048698 | negative regulation of collateral sprouting in absence of injury(GO:0048698) |
| 0.2 | 0.5 | GO:1904049 | regulation of spontaneous neurotransmitter secretion(GO:1904048) negative regulation of spontaneous neurotransmitter secretion(GO:1904049) |
| 0.1 | 1.0 | GO:0032596 | protein transport into membrane raft(GO:0032596) |
| 0.1 | 0.4 | GO:0008594 | photoreceptor cell morphogenesis(GO:0008594) |
| 0.1 | 0.9 | GO:0045629 | negative regulation of T-helper 2 cell differentiation(GO:0045629) |
| 0.1 | 0.4 | GO:1900365 | positive regulation of mRNA polyadenylation(GO:1900365) |
| 0.1 | 1.0 | GO:0034720 | positive regulation of mammary gland epithelial cell proliferation(GO:0033601) histone H3-K4 demethylation(GO:0034720) mammary duct terminal end bud growth(GO:0060763) |
| 0.1 | 0.6 | GO:1902031 | regulation of NADP metabolic process(GO:1902031) |
| 0.1 | 0.3 | GO:0070103 | regulation of interleukin-6-mediated signaling pathway(GO:0070103) negative regulation of interleukin-6-mediated signaling pathway(GO:0070104) |
| 0.1 | 0.4 | GO:0071475 | cellular hyperosmotic salinity response(GO:0071475) |
| 0.1 | 0.9 | GO:0048742 | regulation of skeletal muscle fiber development(GO:0048742) |
| 0.1 | 1.6 | GO:0046069 | cGMP catabolic process(GO:0046069) |
| 0.1 | 0.5 | GO:0070166 | enamel mineralization(GO:0070166) |
| 0.1 | 0.5 | GO:0030223 | neutrophil differentiation(GO:0030223) |
| 0.1 | 0.3 | GO:0048352 | neural plate mediolateral regionalization(GO:0021998) mesoderm structural organization(GO:0048338) paraxial mesoderm structural organization(GO:0048352) |
| 0.1 | 0.3 | GO:0002014 | vasoconstriction of artery involved in ischemic response to lowering of systemic arterial blood pressure(GO:0002014) |
| 0.1 | 0.3 | GO:1901475 | pyruvate transmembrane transport(GO:1901475) |
| 0.1 | 0.3 | GO:2000852 | regulation of corticosterone secretion(GO:2000852) |
| 0.1 | 0.4 | GO:0001561 | fatty acid alpha-oxidation(GO:0001561) |
| 0.1 | 1.1 | GO:2000010 | positive regulation of protein localization to cell surface(GO:2000010) |
| 0.1 | 0.2 | GO:0035864 | response to potassium ion(GO:0035864) cellular response to potassium ion(GO:0035865) |
| 0.1 | 0.4 | GO:0006543 | glutamine catabolic process(GO:0006543) |
| 0.1 | 0.7 | GO:0006370 | 7-methylguanosine mRNA capping(GO:0006370) |
| 0.1 | 0.2 | GO:0015938 | coenzyme A catabolic process(GO:0015938) nucleoside bisphosphate catabolic process(GO:0033869) ribonucleoside bisphosphate catabolic process(GO:0034031) purine nucleoside bisphosphate catabolic process(GO:0034034) |
| 0.1 | 0.2 | GO:0046104 | thymidine metabolic process(GO:0046104) |
| 0.1 | 0.6 | GO:0000963 | mitochondrial RNA processing(GO:0000963) |
| 0.1 | 0.3 | GO:0060398 | regulation of growth hormone receptor signaling pathway(GO:0060398) |
| 0.1 | 0.3 | GO:0061732 | mitochondrial acetyl-CoA biosynthetic process from pyruvate(GO:0061732) |
| 0.1 | 0.2 | GO:0036228 | protein targeting to nuclear inner membrane(GO:0036228) |
| 0.1 | 0.8 | GO:0051764 | actin crosslink formation(GO:0051764) |
| 0.1 | 0.6 | GO:0048386 | positive regulation of retinoic acid receptor signaling pathway(GO:0048386) |
| 0.1 | 0.2 | GO:0072344 | rescue of stalled ribosome(GO:0072344) |
| 0.1 | 0.5 | GO:0031424 | keratinization(GO:0031424) |
| 0.1 | 0.5 | GO:0070940 | dephosphorylation of RNA polymerase II C-terminal domain(GO:0070940) |
| 0.1 | 0.2 | GO:0072531 | pyrimidine-containing compound transmembrane transport(GO:0072531) |
| 0.1 | 0.2 | GO:0042822 | vitamin B6 metabolic process(GO:0042816) pyridoxal phosphate metabolic process(GO:0042822) pyridoxal phosphate biosynthetic process(GO:0042823) |
| 0.0 | 0.9 | GO:0006353 | DNA-templated transcription, termination(GO:0006353) |
| 0.0 | 0.5 | GO:1904153 | negative regulation of protein exit from endoplasmic reticulum(GO:0070862) negative regulation of retrograde protein transport, ER to cytosol(GO:1904153) |
| 0.0 | 0.1 | GO:0071550 | death-inducing signaling complex assembly(GO:0071550) |
| 0.0 | 0.2 | GO:0015671 | oxygen transport(GO:0015671) |
| 0.0 | 0.5 | GO:0046036 | CTP biosynthetic process(GO:0006241) CTP metabolic process(GO:0046036) |
| 0.0 | 0.4 | GO:0033169 | histone H3-K9 demethylation(GO:0033169) |
| 0.0 | 0.3 | GO:1903690 | negative regulation of wound healing, spreading of epidermal cells(GO:1903690) |
| 0.0 | 0.3 | GO:0046007 | negative regulation of activated T cell proliferation(GO:0046007) |
| 0.0 | 0.1 | GO:0052428 | modulation of molecular function in other organism(GO:0044359) negative regulation of molecular function in other organism(GO:0044362) negative regulation of molecular function in other organism involved in symbiotic interaction(GO:0052204) modulation of molecular function in other organism involved in symbiotic interaction(GO:0052205) negative regulation by host of symbiont molecular function(GO:0052405) modification by host of symbiont molecular function(GO:0052428) |
| 0.0 | 0.6 | GO:0001731 | formation of translation preinitiation complex(GO:0001731) |
| 0.0 | 1.7 | GO:0001782 | B cell homeostasis(GO:0001782) |
| 0.0 | 0.4 | GO:0018230 | peptidyl-L-cysteine S-palmitoylation(GO:0018230) peptidyl-S-diacylglycerol-L-cysteine biosynthetic process from peptidyl-cysteine(GO:0018231) |
| 0.0 | 0.3 | GO:0019532 | oxalate transport(GO:0019532) |
| 0.0 | 0.3 | GO:0002862 | negative regulation of inflammatory response to antigenic stimulus(GO:0002862) |
| 0.0 | 0.6 | GO:0003334 | keratinocyte development(GO:0003334) |
| 0.0 | 0.3 | GO:0006685 | sphingomyelin catabolic process(GO:0006685) |
| 0.0 | 0.2 | GO:0040032 | post-embryonic body morphogenesis(GO:0040032) |
| 0.0 | 0.2 | GO:0050912 | detection of chemical stimulus involved in sensory perception(GO:0050907) detection of chemical stimulus involved in sensory perception of taste(GO:0050912) |
| 0.0 | 0.1 | GO:0006689 | ganglioside catabolic process(GO:0006689) |
| 0.0 | 0.2 | GO:0045650 | negative regulation of macrophage differentiation(GO:0045650) |
| 0.0 | 2.1 | GO:0050852 | T cell receptor signaling pathway(GO:0050852) |
| 0.0 | 0.1 | GO:0042373 | vitamin K metabolic process(GO:0042373) |
| 0.0 | 0.4 | GO:0030150 | protein import into mitochondrial matrix(GO:0030150) |
| 0.0 | 0.3 | GO:0090503 | RNA phosphodiester bond hydrolysis, exonucleolytic(GO:0090503) |
| 0.0 | 0.2 | GO:0006570 | tyrosine metabolic process(GO:0006570) ventricular zone neuroblast division(GO:0021847) |
| 0.0 | 0.2 | GO:0019800 | peptide cross-linking via chondroitin 4-sulfate glycosaminoglycan(GO:0019800) |
| 0.0 | 0.1 | GO:1902396 | protein localization to bicellular tight junction(GO:1902396) |
| 0.0 | 0.2 | GO:0030388 | fructose 6-phosphate metabolic process(GO:0006002) fructose 1,6-bisphosphate metabolic process(GO:0030388) |
| 0.0 | 0.9 | GO:0008333 | endosome to lysosome transport(GO:0008333) |
| 0.0 | 0.3 | GO:0034389 | lipid particle organization(GO:0034389) |
| 0.0 | 0.1 | GO:0048170 | positive regulation of long-term neuronal synaptic plasticity(GO:0048170) |
| 0.0 | 0.4 | GO:0007095 | mitotic G2 DNA damage checkpoint(GO:0007095) |
| 0.0 | 0.2 | GO:0006104 | succinyl-CoA metabolic process(GO:0006104) |
| 0.0 | 0.2 | GO:0051534 | negative regulation of NFAT protein import into nucleus(GO:0051534) |
| 0.0 | 0.3 | GO:0031340 | positive regulation of vesicle fusion(GO:0031340) |
| 0.0 | 0.1 | GO:0042275 | error-free postreplication DNA repair(GO:0042275) |
| 0.0 | 1.0 | GO:0042771 | intrinsic apoptotic signaling pathway in response to DNA damage by p53 class mediator(GO:0042771) |
| 0.0 | 3.3 | GO:0042787 | protein ubiquitination involved in ubiquitin-dependent protein catabolic process(GO:0042787) |
| 0.0 | 0.5 | GO:0001829 | trophectodermal cell differentiation(GO:0001829) |
| 0.0 | 0.1 | GO:0007197 | adenylate cyclase-inhibiting G-protein coupled acetylcholine receptor signaling pathway(GO:0007197) phospholipase C-activating G-protein coupled acetylcholine receptor signaling pathway(GO:0007207) |
| 0.0 | 0.1 | GO:0038108 | negative regulation of appetite by leptin-mediated signaling pathway(GO:0038108) |
| 0.0 | 0.1 | GO:2000781 | DNA dealkylation involved in DNA repair(GO:0006307) positive regulation of double-strand break repair(GO:2000781) |
| 0.0 | 0.2 | GO:0010818 | T cell chemotaxis(GO:0010818) |
| 0.0 | 1.0 | GO:0060395 | SMAD protein signal transduction(GO:0060395) |
| 0.0 | 0.1 | GO:0016255 | attachment of GPI anchor to protein(GO:0016255) |
| 0.0 | 0.2 | GO:0034453 | microtubule anchoring(GO:0034453) |
| 0.0 | 0.2 | GO:0071578 | zinc II ion transmembrane import(GO:0071578) |
| 0.0 | 0.2 | GO:0061000 | negative regulation of dendritic spine development(GO:0061000) |
| 0.0 | 0.2 | GO:0002021 | response to dietary excess(GO:0002021) |
| 0.0 | 0.2 | GO:0002377 | immunoglobulin production(GO:0002377) |
| 0.0 | 0.4 | GO:0006783 | heme biosynthetic process(GO:0006783) |
| 0.0 | 0.3 | GO:0008608 | attachment of spindle microtubules to kinetochore(GO:0008608) |
Gene overrepresentation in cellular_component category:
| Log-likelihood per target | Total log-likelihood | Term | Description |
|---|---|---|---|
| 0.2 | 1.6 | GO:0000138 | Golgi trans cisterna(GO:0000138) |
| 0.1 | 2.3 | GO:0042101 | T cell receptor complex(GO:0042101) |
| 0.1 | 0.9 | GO:0090571 | RNA polymerase II transcription repressor complex(GO:0090571) |
| 0.1 | 0.3 | GO:1990047 | spindle matrix(GO:1990047) |
| 0.1 | 2.0 | GO:0044224 | juxtaparanode region of axon(GO:0044224) |
| 0.1 | 0.5 | GO:1990761 | growth cone lamellipodium(GO:1990761) |
| 0.1 | 0.3 | GO:0030981 | cortical microtubule cytoskeleton(GO:0030981) |
| 0.1 | 0.2 | GO:0005896 | interleukin-6 receptor complex(GO:0005896) |
| 0.1 | 1.2 | GO:0032580 | Golgi cisterna membrane(GO:0032580) |
| 0.1 | 0.4 | GO:0005744 | mitochondrial inner membrane presequence translocase complex(GO:0005744) |
| 0.1 | 2.3 | GO:0032281 | AMPA glutamate receptor complex(GO:0032281) |
| 0.1 | 0.4 | GO:0043564 | Ku70:Ku80 complex(GO:0043564) |
| 0.1 | 0.3 | GO:0070876 | SOSS complex(GO:0070876) |
| 0.1 | 0.2 | GO:0005945 | 6-phosphofructokinase complex(GO:0005945) |
| 0.1 | 2.7 | GO:0005834 | heterotrimeric G-protein complex(GO:0005834) |
| 0.1 | 0.7 | GO:0034518 | mRNA cap binding complex(GO:0005845) RNA cap binding complex(GO:0034518) |
| 0.0 | 0.4 | GO:0044352 | pinosome(GO:0044352) macropinosome(GO:0044354) |
| 0.0 | 0.5 | GO:0032039 | integrator complex(GO:0032039) |
| 0.0 | 0.3 | GO:0019773 | proteasome core complex, alpha-subunit complex(GO:0019773) |
| 0.0 | 0.6 | GO:0097470 | ribbon synapse(GO:0097470) |
| 0.0 | 0.7 | GO:0042470 | melanosome(GO:0042470) pigment granule(GO:0048770) |
| 0.0 | 0.2 | GO:0005833 | hemoglobin complex(GO:0005833) |
| 0.0 | 0.4 | GO:0033655 | host cell cytoplasm(GO:0030430) host intracellular part(GO:0033646) host cell cytoplasm part(GO:0033655) intracellular region of host(GO:0043656) |
| 0.0 | 0.2 | GO:0044613 | nuclear pore central transport channel(GO:0044613) |
| 0.0 | 0.9 | GO:0031902 | late endosome membrane(GO:0031902) |
| 0.0 | 0.3 | GO:0071782 | endoplasmic reticulum tubular network(GO:0071782) |
| 0.0 | 0.4 | GO:1990124 | messenger ribonucleoprotein complex(GO:1990124) |
| 0.0 | 0.2 | GO:0000347 | THO complex(GO:0000347) THO complex part of transcription export complex(GO:0000445) |
| 0.0 | 0.4 | GO:0005666 | DNA-directed RNA polymerase III complex(GO:0005666) |
| 0.0 | 0.1 | GO:0034709 | methylosome(GO:0034709) |
| 0.0 | 0.3 | GO:0005952 | cAMP-dependent protein kinase complex(GO:0005952) |
| 0.0 | 0.1 | GO:0031372 | UBC13-MMS2 complex(GO:0031372) |
| 0.0 | 0.1 | GO:0042582 | primary lysosome(GO:0005766) azurophil granule(GO:0042582) |
| 0.0 | 0.8 | GO:0031941 | filamentous actin(GO:0031941) |
| 0.0 | 1.1 | GO:0005791 | rough endoplasmic reticulum(GO:0005791) |
| 0.0 | 0.2 | GO:0045252 | oxoglutarate dehydrogenase complex(GO:0045252) |
| 0.0 | 0.4 | GO:0005779 | integral component of peroxisomal membrane(GO:0005779) |
| 0.0 | 1.5 | GO:0005905 | clathrin-coated pit(GO:0005905) |
| 0.0 | 0.2 | GO:0031143 | pseudopodium(GO:0031143) |
| 0.0 | 0.1 | GO:0042765 | GPI-anchor transamidase complex(GO:0042765) |
| 0.0 | 1.8 | GO:0043204 | perikaryon(GO:0043204) |
| 0.0 | 0.5 | GO:0000788 | nuclear nucleosome(GO:0000788) |
| 0.0 | 1.0 | GO:0019005 | SCF ubiquitin ligase complex(GO:0019005) |
| 0.0 | 0.4 | GO:0030992 | intraciliary transport particle B(GO:0030992) |
| 0.0 | 0.1 | GO:0002177 | manchette(GO:0002177) |
| 0.0 | 0.6 | GO:0042645 | nucleoid(GO:0009295) mitochondrial nucleoid(GO:0042645) |
| 0.0 | 0.4 | GO:0005721 | pericentric heterochromatin(GO:0005721) |
| 0.0 | 0.5 | GO:0031901 | early endosome membrane(GO:0031901) |
| 0.0 | 0.3 | GO:0005782 | peroxisomal matrix(GO:0005782) microbody lumen(GO:0031907) |
| 0.0 | 0.2 | GO:0030131 | clathrin adaptor complex(GO:0030131) |
Gene overrepresentation in molecular_function category:
| Log-likelihood per target | Total log-likelihood | Term | Description |
|---|---|---|---|
| 0.4 | 1.3 | GO:0016934 | extracellular-glycine-gated ion channel activity(GO:0016933) extracellular-glycine-gated chloride channel activity(GO:0016934) |
| 0.4 | 1.2 | GO:0008521 | acetyl-CoA transporter activity(GO:0008521) |
| 0.4 | 1.2 | GO:0050510 | N-acetylgalactosaminyl-proteoglycan 3-beta-glucuronosyltransferase activity(GO:0050510) |
| 0.3 | 1.6 | GO:0003835 | beta-galactoside alpha-2,6-sialyltransferase activity(GO:0003835) |
| 0.3 | 1.0 | GO:0034647 | histone demethylase activity (H3-trimethyl-K4 specific)(GO:0034647) |
| 0.3 | 1.2 | GO:0035374 | chondroitin sulfate binding(GO:0035374) |
| 0.3 | 0.8 | GO:0003858 | 3-hydroxybutyrate dehydrogenase activity(GO:0003858) |
| 0.2 | 2.0 | GO:0031811 | G-protein coupled nucleotide receptor binding(GO:0031811) P2Y1 nucleotide receptor binding(GO:0031812) |
| 0.2 | 0.6 | GO:0033883 | pyridoxal phosphatase activity(GO:0033883) |
| 0.2 | 0.6 | GO:0035651 | AP-1 adaptor complex binding(GO:0035650) AP-3 adaptor complex binding(GO:0035651) |
| 0.2 | 0.6 | GO:0004471 | malic enzyme activity(GO:0004470) malate dehydrogenase (decarboxylating) (NAD+) activity(GO:0004471) |
| 0.1 | 0.9 | GO:0001226 | RNA polymerase II transcription corepressor binding(GO:0001226) |
| 0.1 | 2.1 | GO:0031681 | G-protein beta-subunit binding(GO:0031681) |
| 0.1 | 0.9 | GO:0019869 | chloride channel inhibitor activity(GO:0019869) |
| 0.1 | 0.5 | GO:0003883 | CTP synthase activity(GO:0003883) |
| 0.1 | 0.8 | GO:0016215 | acyl-CoA desaturase activity(GO:0016215) |
| 0.1 | 2.3 | GO:0043395 | heparan sulfate proteoglycan binding(GO:0043395) |
| 0.1 | 1.6 | GO:0030553 | cGMP binding(GO:0030553) |
| 0.1 | 2.0 | GO:0050750 | low-density lipoprotein particle receptor binding(GO:0050750) |
| 0.1 | 0.3 | GO:0050833 | pyruvate transmembrane transporter activity(GO:0050833) |
| 0.1 | 0.3 | GO:0031779 | melanocortin receptor binding(GO:0031779) type 3 melanocortin receptor binding(GO:0031781) type 4 melanocortin receptor binding(GO:0031782) |
| 0.1 | 2.3 | GO:0005070 | SH3/SH2 adaptor activity(GO:0005070) |
| 0.1 | 0.2 | GO:0004923 | leukemia inhibitory factor receptor activity(GO:0004923) oncostatin-M receptor activity(GO:0004924) |
| 0.1 | 0.4 | GO:0015450 | P-P-bond-hydrolysis-driven protein transmembrane transporter activity(GO:0015450) |
| 0.1 | 0.4 | GO:0004359 | glutaminase activity(GO:0004359) |
| 0.1 | 0.2 | GO:0003986 | acetyl-CoA hydrolase activity(GO:0003986) |
| 0.1 | 0.3 | GO:0043515 | kinetochore binding(GO:0043515) |
| 0.1 | 1.5 | GO:0070064 | proline-rich region binding(GO:0070064) |
| 0.1 | 0.5 | GO:0008420 | CTD phosphatase activity(GO:0008420) |
| 0.1 | 0.2 | GO:0030492 | hemoglobin binding(GO:0030492) hemoglobin alpha binding(GO:0031721) |
| 0.1 | 0.2 | GO:0003872 | 6-phosphofructokinase activity(GO:0003872) |
| 0.1 | 0.2 | GO:0008527 | taste receptor activity(GO:0008527) |
| 0.1 | 0.3 | GO:0034604 | pyruvate dehydrogenase activity(GO:0004738) pyruvate dehydrogenase [NAD(P)+] activity(GO:0034603) pyruvate dehydrogenase (NAD+) activity(GO:0034604) |
| 0.1 | 0.2 | GO:0019136 | deoxynucleoside kinase activity(GO:0019136) |
| 0.1 | 0.5 | GO:0005338 | nucleotide-sugar transmembrane transporter activity(GO:0005338) |
| 0.0 | 0.4 | GO:0032454 | histone demethylase activity (H3-K9 specific)(GO:0032454) |
| 0.0 | 0.2 | GO:0003998 | acylphosphatase activity(GO:0003998) |
| 0.0 | 0.3 | GO:0004984 | olfactory receptor activity(GO:0004984) |
| 0.0 | 0.1 | GO:0035243 | protein-arginine omega-N symmetric methyltransferase activity(GO:0035243) |
| 0.0 | 0.4 | GO:0000268 | peroxisome targeting sequence binding(GO:0000268) |
| 0.0 | 0.6 | GO:0034450 | ubiquitin-ubiquitin ligase activity(GO:0034450) |
| 0.0 | 0.2 | GO:0004045 | aminoacyl-tRNA hydrolase activity(GO:0004045) |
| 0.0 | 0.3 | GO:0098821 | BMP receptor activity(GO:0098821) |
| 0.0 | 0.3 | GO:0008251 | tRNA-specific adenosine deaminase activity(GO:0008251) |
| 0.0 | 0.4 | GO:0051575 | 5'-deoxyribose-5-phosphate lyase activity(GO:0051575) |
| 0.0 | 0.5 | GO:0070008 | serine-type exopeptidase activity(GO:0070008) |
| 0.0 | 0.2 | GO:0034602 | oxoglutarate dehydrogenase (NAD+) activity(GO:0034602) |
| 0.0 | 0.3 | GO:0004534 | 5'-3' exoribonuclease activity(GO:0004534) |
| 0.0 | 0.3 | GO:0004767 | sphingomyelin phosphodiesterase activity(GO:0004767) |
| 0.0 | 0.4 | GO:0035925 | mRNA 3'-UTR AU-rich region binding(GO:0035925) |
| 0.0 | 0.1 | GO:0004563 | beta-N-acetylhexosaminidase activity(GO:0004563) |
| 0.0 | 0.1 | GO:0004090 | carbonyl reductase (NADPH) activity(GO:0004090) |
| 0.0 | 0.4 | GO:0051010 | microtubule plus-end binding(GO:0051010) |
| 0.0 | 1.1 | GO:0008536 | Ran GTPase binding(GO:0008536) |
| 0.0 | 0.1 | GO:0017150 | tRNA dihydrouridine synthase activity(GO:0017150) |
| 0.0 | 0.3 | GO:0019531 | oxalate transmembrane transporter activity(GO:0019531) |
| 0.0 | 0.9 | GO:0050699 | WW domain binding(GO:0050699) |
| 0.0 | 0.5 | GO:0043539 | protein serine/threonine kinase activator activity(GO:0043539) |
| 0.0 | 0.3 | GO:0008603 | cAMP-dependent protein kinase regulator activity(GO:0008603) |
| 0.0 | 0.3 | GO:0001530 | lipopolysaccharide binding(GO:0001530) |
| 0.0 | 0.2 | GO:0005041 | low-density lipoprotein receptor activity(GO:0005041) |
| 0.0 | 0.1 | GO:0016907 | G-protein coupled acetylcholine receptor activity(GO:0016907) |
| 0.0 | 0.5 | GO:0019706 | protein-cysteine S-palmitoyltransferase activity(GO:0019706) |
| 0.0 | 0.4 | GO:0001056 | RNA polymerase III activity(GO:0001056) |
| 0.0 | 0.2 | GO:0008191 | metalloendopeptidase inhibitor activity(GO:0008191) |
| 0.0 | 0.5 | GO:0008157 | protein phosphatase 1 binding(GO:0008157) |
| 0.0 | 0.3 | GO:0001786 | phosphatidylserine binding(GO:0001786) |
| 0.0 | 0.6 | GO:0042974 | retinoic acid receptor binding(GO:0042974) |
| 0.0 | 0.2 | GO:0016863 | intramolecular oxidoreductase activity, transposing C=C bonds(GO:0016863) |
| 0.0 | 0.5 | GO:0061631 | ubiquitin conjugating enzyme activity(GO:0061631) |
| 0.0 | 0.1 | GO:0050265 | RNA uridylyltransferase activity(GO:0050265) |
| 0.0 | 0.2 | GO:0016641 | oxidoreductase activity, acting on the CH-NH2 group of donors, oxygen as acceptor(GO:0016641) |
| 0.0 | 0.5 | GO:0005246 | calcium channel regulator activity(GO:0005246) |
| 0.0 | 0.2 | GO:0030346 | protein phosphatase 2B binding(GO:0030346) |