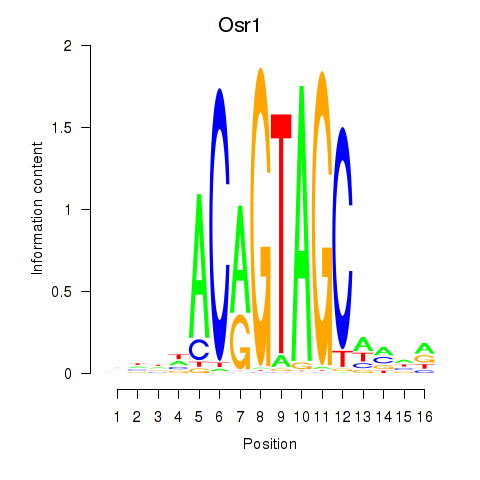
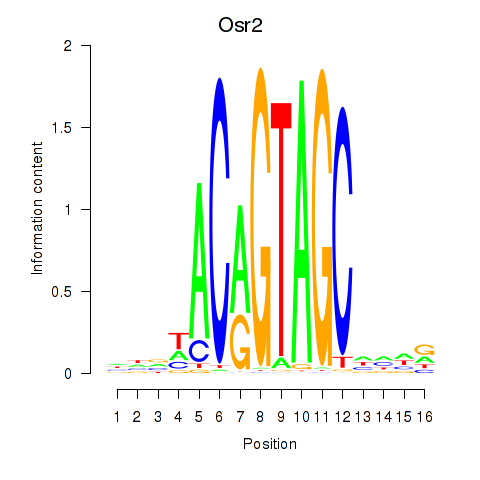
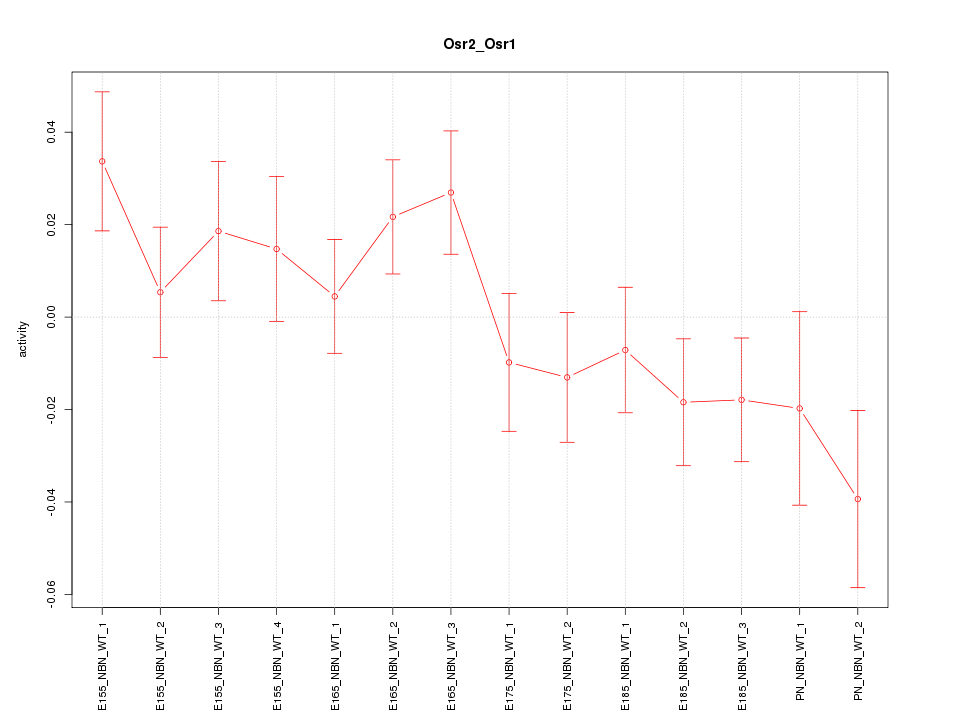
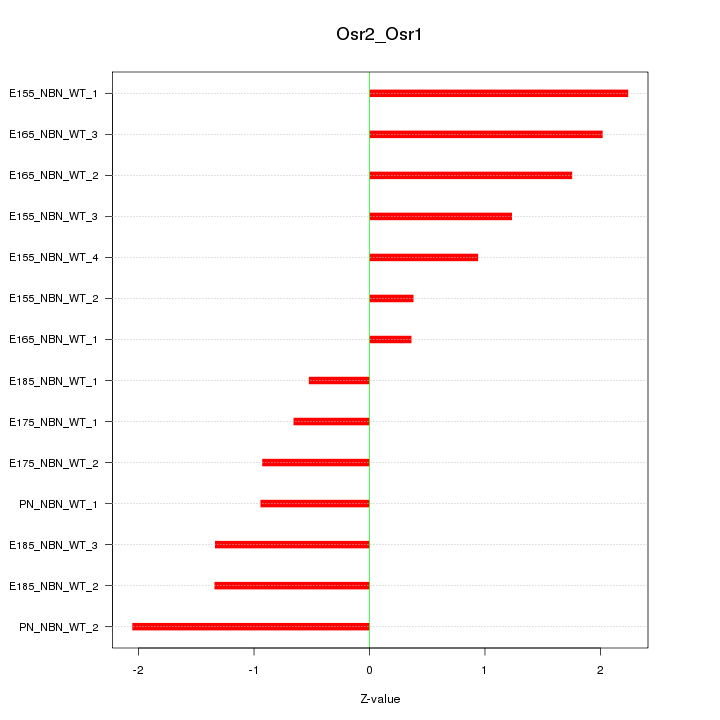
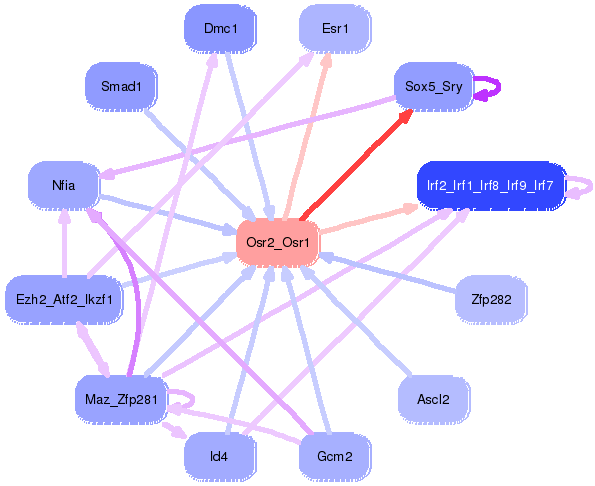
Motif ID: Osr2_Osr1
Z-value: 1.340
Transcription factors associated with Osr2_Osr1:
| Gene Symbol | Entrez ID | Gene Name |
|---|---|---|
| Osr1 | ENSMUSG00000048387.7 | Osr1 |
| Osr2 | ENSMUSG00000022330.4 | Osr2 |
Activity-expression correlation:
| Gene Symbol | Promoter | Pearson corr. coef. | P-value | Plot |
|---|---|---|---|---|
| Osr1 | mm10_v2_chr12_+_9574437_9574448 | -0.16 | 5.9e-01 | Click! |

Top targets:
Gene overrepresentation in biological_process category:
| Log-likelihood per target | Total log-likelihood | Term | Description |
|---|---|---|---|
| 2.4 | 18.9 | GO:0060164 | regulation of timing of neuron differentiation(GO:0060164) |
| 0.5 | 2.7 | GO:0048631 | regulation of skeletal muscle tissue growth(GO:0048631) |
| 0.4 | 2.1 | GO:0036324 | vascular endothelial growth factor receptor-2 signaling pathway(GO:0036324) |
| 0.4 | 1.2 | GO:0006421 | asparaginyl-tRNA aminoacylation(GO:0006421) |
| 0.3 | 1.3 | GO:0046391 | 5-phosphoribose 1-diphosphate biosynthetic process(GO:0006015) 5-phosphoribose 1-diphosphate metabolic process(GO:0046391) |
| 0.3 | 0.9 | GO:0042998 | positive regulation of Golgi to plasma membrane protein transport(GO:0042998) |
| 0.3 | 0.9 | GO:0060244 | negative regulation of cell proliferation involved in contact inhibition(GO:0060244) glutamate secretion, neurotransmission(GO:0061535) |
| 0.2 | 3.2 | GO:1901898 | negative regulation of relaxation of muscle(GO:1901078) negative regulation of relaxation of cardiac muscle(GO:1901898) |
| 0.2 | 1.3 | GO:0000160 | phosphorelay signal transduction system(GO:0000160) |
| 0.2 | 0.6 | GO:0006667 | sphinganine metabolic process(GO:0006667) |
| 0.2 | 0.9 | GO:0007228 | positive regulation of hh target transcription factor activity(GO:0007228) |
| 0.2 | 1.8 | GO:0036371 | protein localization to M-band(GO:0036309) protein localization to T-tubule(GO:0036371) |
| 0.2 | 0.7 | GO:0030576 | Cajal body organization(GO:0030576) |
| 0.2 | 2.8 | GO:0046069 | cGMP catabolic process(GO:0046069) |
| 0.2 | 0.9 | GO:0051013 | microtubule severing(GO:0051013) |
| 0.2 | 0.5 | GO:0033860 | regulation of NAD(P)H oxidase activity(GO:0033860) flavin-containing compound metabolic process(GO:0042726) |
| 0.1 | 0.4 | GO:0042420 | dopamine catabolic process(GO:0042420) |
| 0.1 | 0.5 | GO:0033499 | galactose catabolic process via UDP-galactose(GO:0033499) glycolytic process from galactose(GO:0061623) |
| 0.1 | 4.5 | GO:1902230 | negative regulation of intrinsic apoptotic signaling pathway in response to DNA damage(GO:1902230) |
| 0.1 | 0.2 | GO:0060523 | prostate epithelial cord elongation(GO:0060523) |
| 0.1 | 0.4 | GO:1904565 | response to 1-oleoyl-sn-glycerol 3-phosphate(GO:1904565) cellular response to 1-oleoyl-sn-glycerol 3-phosphate(GO:1904566) |
| 0.1 | 0.9 | GO:0009992 | cellular water homeostasis(GO:0009992) |
| 0.1 | 0.9 | GO:0035871 | protein K11-linked deubiquitination(GO:0035871) |
| 0.1 | 0.4 | GO:0070562 | regulation of vitamin D receptor signaling pathway(GO:0070562) |
| 0.1 | 0.4 | GO:0034436 | glycoprotein transport(GO:0034436) |
| 0.1 | 1.0 | GO:0021869 | forebrain ventricular zone progenitor cell division(GO:0021869) |
| 0.1 | 0.3 | GO:1903031 | regulation of microtubule plus-end binding(GO:1903031) positive regulation of microtubule plus-end binding(GO:1903033) |
| 0.1 | 2.2 | GO:0010842 | retina layer formation(GO:0010842) |
| 0.1 | 0.4 | GO:0045541 | negative regulation of cholesterol biosynthetic process(GO:0045541) negative regulation of cholesterol metabolic process(GO:0090206) |
| 0.1 | 0.3 | GO:0071985 | multivesicular body sorting pathway(GO:0071985) |
| 0.1 | 0.7 | GO:0006995 | cellular response to nitrogen starvation(GO:0006995) cellular response to nitrogen levels(GO:0043562) |
| 0.1 | 0.2 | GO:0070844 | misfolded protein transport(GO:0070843) polyubiquitinated protein transport(GO:0070844) polyubiquitinated misfolded protein transport(GO:0070845) Hsp90 deacetylation(GO:0070846) |
| 0.1 | 0.4 | GO:0006537 | glutamate biosynthetic process(GO:0006537) proline biosynthetic process(GO:0006561) |
| 0.1 | 0.4 | GO:1904217 | regulation of CDP-diacylglycerol-serine O-phosphatidyltransferase activity(GO:1904217) positive regulation of CDP-diacylglycerol-serine O-phosphatidyltransferase activity(GO:1904219) regulation of serine C-palmitoyltransferase activity(GO:1904220) positive regulation of serine C-palmitoyltransferase activity(GO:1904222) |
| 0.0 | 1.0 | GO:0032981 | NADH dehydrogenase complex assembly(GO:0010257) mitochondrial respiratory chain complex I assembly(GO:0032981) mitochondrial respiratory chain complex I biogenesis(GO:0097031) |
| 0.0 | 0.7 | GO:0030828 | positive regulation of cGMP biosynthetic process(GO:0030828) |
| 0.0 | 2.0 | GO:0043039 | tRNA aminoacylation(GO:0043039) |
| 0.0 | 0.8 | GO:0007274 | neuromuscular synaptic transmission(GO:0007274) |
| 0.0 | 1.1 | GO:0095500 | acetylcholine receptor signaling pathway(GO:0095500) postsynaptic signal transduction(GO:0098926) negative regulation of protein localization to plasma membrane(GO:1903077) signal transduction involved in cellular response to ammonium ion(GO:1903831) negative regulation of protein localization to cell periphery(GO:1904376) response to acetylcholine(GO:1905144) cellular response to acetylcholine(GO:1905145) |
| 0.0 | 0.1 | GO:0035790 | platelet-derived growth factor receptor-alpha signaling pathway(GO:0035790) |
| 0.0 | 0.3 | GO:0045351 | type I interferon biosynthetic process(GO:0045351) |
| 0.0 | 1.1 | GO:0042168 | heme metabolic process(GO:0042168) |
| 0.0 | 2.3 | GO:0051897 | positive regulation of protein kinase B signaling(GO:0051897) |
| 0.0 | 0.1 | GO:0045414 | regulation of interleukin-8 biosynthetic process(GO:0045414) ERK5 cascade(GO:0070375) |
| 0.0 | 1.0 | GO:0045599 | negative regulation of fat cell differentiation(GO:0045599) |
| 0.0 | 0.3 | GO:0070129 | regulation of mitochondrial translation(GO:0070129) |
| 0.0 | 0.9 | GO:0048013 | ephrin receptor signaling pathway(GO:0048013) |
| 0.0 | 0.1 | GO:2000809 | neuroligin clustering involved in postsynaptic membrane assembly(GO:0097118) positive regulation of synaptic vesicle clustering(GO:2000809) |
| 0.0 | 0.3 | GO:0019363 | pyridine nucleotide biosynthetic process(GO:0019363) |
| 0.0 | 0.6 | GO:0006805 | xenobiotic metabolic process(GO:0006805) |
| 0.0 | 0.6 | GO:0006506 | GPI anchor biosynthetic process(GO:0006506) |
| 0.0 | 0.1 | GO:0051683 | establishment of Golgi localization(GO:0051683) |
| 0.0 | 0.3 | GO:0033146 | regulation of intracellular estrogen receptor signaling pathway(GO:0033146) |
| 0.0 | 0.1 | GO:0061502 | early endosome to recycling endosome transport(GO:0061502) |
| 0.0 | 0.7 | GO:0048477 | oogenesis(GO:0048477) |
| 0.0 | 0.7 | GO:0043966 | histone H3 acetylation(GO:0043966) |
| 0.0 | 4.7 | GO:0016055 | Wnt signaling pathway(GO:0016055) cell-cell signaling by wnt(GO:0198738) |
Gene overrepresentation in cellular_component category:
| Log-likelihood per target | Total log-likelihood | Term | Description |
|---|---|---|---|
| 0.5 | 2.1 | GO:1990032 | parallel fiber(GO:1990032) |
| 0.3 | 0.9 | GO:0042584 | chromaffin granule membrane(GO:0042584) |
| 0.2 | 1.0 | GO:0008623 | CHRAC(GO:0008623) |
| 0.2 | 1.6 | GO:0017101 | aminoacyl-tRNA synthetase multienzyme complex(GO:0017101) |
| 0.1 | 3.2 | GO:0000930 | gamma-tubulin complex(GO:0000930) |
| 0.1 | 0.9 | GO:0071437 | invadopodium(GO:0071437) |
| 0.1 | 18.9 | GO:0044798 | nuclear transcription factor complex(GO:0044798) |
| 0.1 | 0.3 | GO:0030981 | cortical microtubule cytoskeleton(GO:0030981) |
| 0.1 | 0.3 | GO:0070449 | elongin complex(GO:0070449) |
| 0.1 | 7.4 | GO:0005905 | clathrin-coated pit(GO:0005905) |
| 0.1 | 0.7 | GO:0008074 | guanylate cyclase complex, soluble(GO:0008074) |
| 0.1 | 0.4 | GO:0005726 | perichromatin fibrils(GO:0005726) |
| 0.1 | 0.3 | GO:0032585 | multivesicular body membrane(GO:0032585) |
| 0.1 | 0.7 | GO:0005671 | Ada2/Gcn5/Ada3 transcription activator complex(GO:0005671) |
| 0.0 | 1.8 | GO:0043034 | costamere(GO:0043034) |
| 0.0 | 0.7 | GO:0097225 | sperm midpiece(GO:0097225) |
| 0.0 | 0.4 | GO:0019773 | proteasome core complex, alpha-subunit complex(GO:0019773) |
| 0.0 | 0.2 | GO:0036157 | outer dynein arm(GO:0036157) |
| 0.0 | 0.1 | GO:0036056 | filtration diaphragm(GO:0036056) slit diaphragm(GO:0036057) |
| 0.0 | 0.7 | GO:0032420 | stereocilium(GO:0032420) |
| 0.0 | 0.2 | GO:0032039 | integrator complex(GO:0032039) |
| 0.0 | 0.3 | GO:0008305 | integrin complex(GO:0008305) protein complex involved in cell adhesion(GO:0098636) |
| 0.0 | 1.7 | GO:0031225 | anchored component of membrane(GO:0031225) |
| 0.0 | 1.2 | GO:0016363 | nuclear matrix(GO:0016363) |
| 0.0 | 0.2 | GO:0035327 | transcriptionally active chromatin(GO:0035327) |
| 0.0 | 0.6 | GO:0072562 | blood microparticle(GO:0072562) |
| 0.0 | 0.1 | GO:0030126 | COPI vesicle coat(GO:0030126) |
Gene overrepresentation in molecular_function category:
| Log-likelihood per target | Total log-likelihood | Term | Description |
|---|---|---|---|
| 1.5 | 4.5 | GO:0016494 | C-X-C chemokine receptor activity(GO:0016494) C-X-C chemokine binding(GO:0019958) |
| 0.4 | 1.3 | GO:0032052 | bile acid binding(GO:0032052) |
| 0.4 | 1.2 | GO:0004816 | asparagine-tRNA ligase activity(GO:0004816) |
| 0.4 | 2.8 | GO:0048101 | calcium- and calmodulin-regulated 3',5'-cyclic-GMP phosphodiesterase activity(GO:0048101) |
| 0.3 | 2.1 | GO:0035662 | Toll-like receptor 4 binding(GO:0035662) |
| 0.2 | 1.3 | GO:0000155 | phosphorelay sensor kinase activity(GO:0000155) |
| 0.2 | 0.6 | GO:0042284 | sphingolipid delta-4 desaturase activity(GO:0042284) |
| 0.2 | 0.9 | GO:0071253 | connexin binding(GO:0071253) |
| 0.1 | 0.4 | GO:0034189 | very-low-density lipoprotein particle binding(GO:0034189) glycoprotein transporter activity(GO:0034437) |
| 0.1 | 0.4 | GO:0016206 | catechol O-methyltransferase activity(GO:0016206) |
| 0.1 | 0.6 | GO:0051377 | mannose-ethanolamine phosphotransferase activity(GO:0051377) |
| 0.1 | 1.1 | GO:0003958 | NADPH-hemoprotein reductase activity(GO:0003958) |
| 0.1 | 1.1 | GO:0030550 | acetylcholine receptor inhibitor activity(GO:0030550) |
| 0.1 | 2.5 | GO:0070064 | proline-rich region binding(GO:0070064) |
| 0.1 | 4.2 | GO:0043015 | gamma-tubulin binding(GO:0043015) |
| 0.1 | 0.7 | GO:0034056 | estrogen response element binding(GO:0034056) |
| 0.1 | 0.5 | GO:0003945 | N-acetyllactosamine synthase activity(GO:0003945) |
| 0.1 | 0.9 | GO:0008568 | microtubule-severing ATPase activity(GO:0008568) |
| 0.1 | 1.6 | GO:0005044 | scavenger receptor activity(GO:0005044) |
| 0.1 | 0.5 | GO:0016453 | acetyl-CoA C-acetyltransferase activity(GO:0003985) C-acetyltransferase activity(GO:0016453) |
| 0.1 | 0.4 | GO:0035727 | lysophosphatidic acid binding(GO:0035727) lysophosphatidic acid receptor activity(GO:0070915) |
| 0.1 | 0.7 | GO:0004383 | guanylate cyclase activity(GO:0004383) |
| 0.1 | 0.3 | GO:0098634 | protein binding involved in cell-matrix adhesion(GO:0098634) collagen binding involved in cell-matrix adhesion(GO:0098639) |
| 0.1 | 1.8 | GO:0008093 | cytoskeletal adaptor activity(GO:0008093) |
| 0.0 | 0.2 | GO:0042903 | tubulin deacetylase activity(GO:0042903) |
| 0.0 | 3.7 | GO:0070491 | repressing transcription factor binding(GO:0070491) |
| 0.0 | 0.1 | GO:0070699 | type II activin receptor binding(GO:0070699) |
| 0.0 | 0.4 | GO:0016884 | carbon-nitrogen ligase activity, with glutamine as amido-N-donor(GO:0016884) |
| 0.0 | 1.6 | GO:0004812 | aminoacyl-tRNA ligase activity(GO:0004812) |
| 0.0 | 0.5 | GO:0016857 | racemase and epimerase activity, acting on carbohydrates and derivatives(GO:0016857) |
| 0.0 | 2.7 | GO:0004222 | metalloendopeptidase activity(GO:0004222) |
| 0.0 | 0.9 | GO:0005544 | calcium-dependent phospholipid binding(GO:0005544) |
| 0.0 | 16.7 | GO:0046982 | protein heterodimerization activity(GO:0046982) |
| 0.0 | 0.6 | GO:0035380 | C-3 sterol dehydrogenase (C-4 sterol decarboxylase) activity(GO:0000252) mevaldate reductase activity(GO:0004495) gluconate dehydrogenase activity(GO:0008875) epoxide dehydrogenase activity(GO:0018451) 5-exo-hydroxycamphor dehydrogenase activity(GO:0018452) 2-hydroxytetrahydrofuran dehydrogenase activity(GO:0018453) acetoin dehydrogenase activity(GO:0019152) phenylcoumaran benzylic ether reductase activity(GO:0032442) D-xylose:NADP reductase activity(GO:0032866) L-arabinose:NADP reductase activity(GO:0032867) D-arabinitol dehydrogenase, D-ribulose forming (NADP+) activity(GO:0033709) (R)-(-)-1,2,3,4-tetrahydronaphthol dehydrogenase activity(GO:0034831) 3-hydroxymenthone dehydrogenase activity(GO:0034840) very long-chain-3-hydroxyacyl-CoA dehydrogenase activity(GO:0035380) dihydrotestosterone 17-beta-dehydrogenase activity(GO:0035410) (R)-2-hydroxyisocaproate dehydrogenase activity(GO:0043713) L-arabinose 1-dehydrogenase (NADP+) activity(GO:0044103) L-xylulose reductase (NAD+) activity(GO:0044105) 3-ketoglucose-reductase activity(GO:0048258) D-arabinitol dehydrogenase, D-xylulose forming (NADP+) activity(GO:0052677) |
| 0.0 | 0.4 | GO:0022889 | L-serine transmembrane transporter activity(GO:0015194) serine transmembrane transporter activity(GO:0022889) |
| 0.0 | 0.3 | GO:0070742 | C2H2 zinc finger domain binding(GO:0070742) |
| 0.0 | 0.6 | GO:0008327 | methyl-CpG binding(GO:0008327) |
| 0.0 | 1.0 | GO:0051539 | 4 iron, 4 sulfur cluster binding(GO:0051539) |
| 0.0 | 0.5 | GO:0017025 | TBP-class protein binding(GO:0017025) |
| 0.0 | 0.1 | GO:0008526 | phosphatidylinositol transporter activity(GO:0008526) |
| 0.0 | 0.3 | GO:0051010 | microtubule plus-end binding(GO:0051010) |
| 0.0 | 0.4 | GO:0016646 | oxidoreductase activity, acting on the CH-NH group of donors, NAD or NADP as acceptor(GO:0016646) |
| 0.0 | 0.4 | GO:0004298 | threonine-type endopeptidase activity(GO:0004298) threonine-type peptidase activity(GO:0070003) |
| 0.0 | 0.9 | GO:0046875 | ephrin receptor binding(GO:0046875) |
| 0.0 | 0.7 | GO:0048487 | beta-tubulin binding(GO:0048487) |
| 0.0 | 0.3 | GO:0031489 | myosin V binding(GO:0031489) |
| 0.0 | 0.9 | GO:0005518 | collagen binding(GO:0005518) |
| 0.0 | 1.0 | GO:0004402 | histone acetyltransferase activity(GO:0004402) |
| 0.0 | 1.1 | GO:0005496 | steroid binding(GO:0005496) |
| 0.0 | 1.7 | GO:0003714 | transcription corepressor activity(GO:0003714) |
| 0.0 | 0.0 | GO:0052740 | phosphatidylserine 1-acylhydrolase activity(GO:0052739) 1-acyl-2-lysophosphatidylserine acylhydrolase activity(GO:0052740) |
|
|
|
|