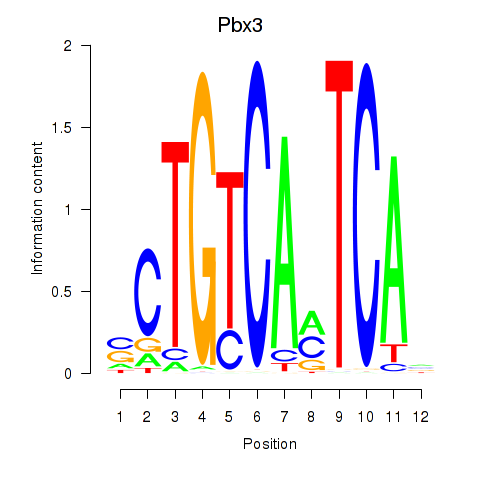
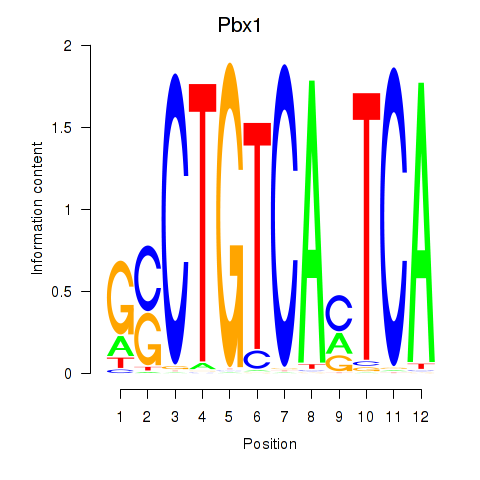
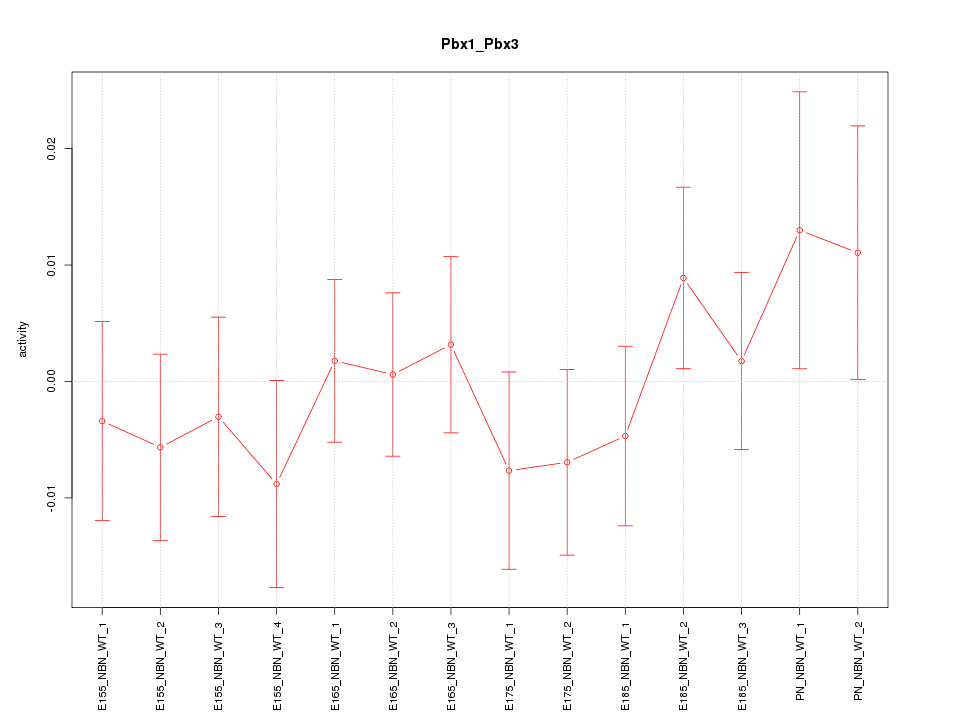
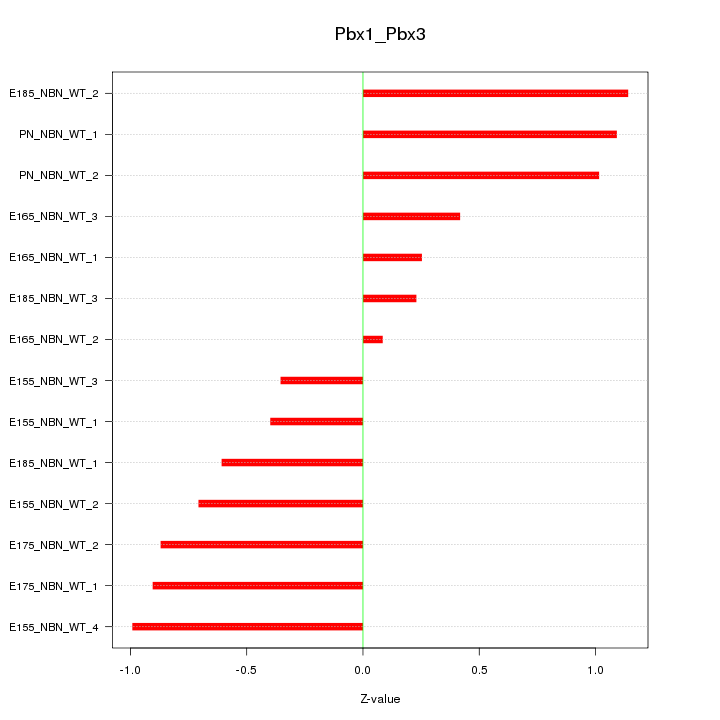
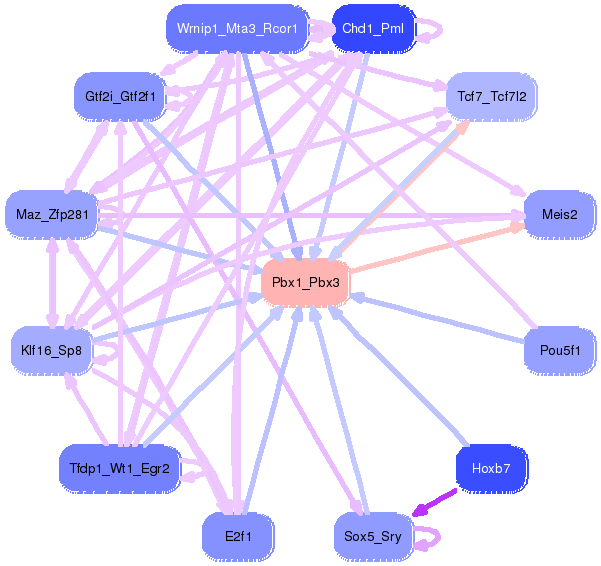
Motif ID: Pbx1_Pbx3
Z-value: 0.734
Transcription factors associated with Pbx1_Pbx3:
| Gene Symbol | Entrez ID | Gene Name |
|---|---|---|
| Pbx1 | ENSMUSG00000052534.9 | Pbx1 |
| Pbx3 | ENSMUSG00000038718.9 | Pbx3 |
Activity-expression correlation:
| Gene Symbol | Promoter | Pearson corr. coef. | P-value | Plot |
|---|---|---|---|---|
| Pbx1 | mm10_v2_chr1_-_168431502_168431513 | -0.84 | 1.6e-04 | Click! |
| Pbx3 | mm10_v2_chr2_-_34372004_34372044 | 0.72 | 3.8e-03 | Click! |

Top targets:
Gene overrepresentation in biological_process category:
| Log-likelihood per target | Total log-likelihood | Term | Description |
|---|---|---|---|
| 0.5 | 1.6 | GO:1903795 | regulation of inorganic anion transmembrane transport(GO:1903795) |
| 0.5 | 1.4 | GO:0060023 | soft palate development(GO:0060023) |
| 0.4 | 1.1 | GO:0097402 | neuroblast migration(GO:0097402) |
| 0.3 | 2.3 | GO:0048625 | myoblast fate commitment(GO:0048625) |
| 0.3 | 0.6 | GO:0061074 | regulation of neural retina development(GO:0061074) |
| 0.2 | 0.7 | GO:0046552 | eye photoreceptor cell fate commitment(GO:0042706) photoreceptor cell fate commitment(GO:0046552) |
| 0.2 | 1.1 | GO:0042997 | negative regulation of Golgi to plasma membrane protein transport(GO:0042997) |
| 0.2 | 0.6 | GO:0044339 | canonical Wnt signaling pathway involved in osteoblast differentiation(GO:0044339) |
| 0.2 | 0.8 | GO:0003430 | tolerance induction to self antigen(GO:0002513) growth plate cartilage chondrocyte growth(GO:0003430) lens fiber cell apoptotic process(GO:1990086) |
| 0.2 | 0.2 | GO:0072204 | cell-cell signaling involved in kidney development(GO:0060995) Wnt signaling pathway involved in kidney development(GO:0061289) canonical Wnt signaling pathway involved in metanephric kidney development(GO:0061290) cell-cell signaling involved in metanephros development(GO:0072204) |
| 0.2 | 0.6 | GO:0060364 | frontal suture morphogenesis(GO:0060364) |
| 0.2 | 0.6 | GO:0043456 | regulation of pentose-phosphate shunt(GO:0043456) |
| 0.2 | 0.6 | GO:0051342 | regulation of cyclic-nucleotide phosphodiesterase activity(GO:0051342) negative regulation of cyclic-nucleotide phosphodiesterase activity(GO:0051344) |
| 0.2 | 0.9 | GO:0031022 | nuclear migration along microfilament(GO:0031022) |
| 0.2 | 0.7 | GO:0097168 | condensed mesenchymal cell proliferation(GO:0072137) mesenchymal stem cell proliferation(GO:0097168) |
| 0.2 | 0.5 | GO:0031038 | myosin II filament organization(GO:0031038) regulation of myosin II filament organization(GO:0043519) |
| 0.2 | 1.7 | GO:0042572 | retinol metabolic process(GO:0042572) |
| 0.2 | 0.5 | GO:0016256 | N-glycan processing to lysosome(GO:0016256) |
| 0.1 | 0.9 | GO:0035743 | CD4-positive, alpha-beta T cell cytokine production(GO:0035743) T-helper 2 cell cytokine production(GO:0035745) |
| 0.1 | 1.0 | GO:0043383 | negative T cell selection(GO:0043383) negative thymic T cell selection(GO:0045060) |
| 0.1 | 0.4 | GO:1904706 | negative regulation of vascular smooth muscle cell proliferation(GO:1904706) |
| 0.1 | 0.8 | GO:0035469 | determination of pancreatic left/right asymmetry(GO:0035469) |
| 0.1 | 0.6 | GO:0051387 | negative regulation of neurotrophin TRK receptor signaling pathway(GO:0051387) |
| 0.1 | 0.6 | GO:1904936 | cerebral cortex GABAergic interneuron migration(GO:0021853) interneuron migration(GO:1904936) |
| 0.1 | 1.4 | GO:0042759 | long-chain fatty acid biosynthetic process(GO:0042759) |
| 0.1 | 0.4 | GO:0006547 | histidine metabolic process(GO:0006547) |
| 0.1 | 0.8 | GO:0060346 | bone trabecula formation(GO:0060346) |
| 0.1 | 0.3 | GO:1903225 | negative regulation of endodermal cell differentiation(GO:1903225) |
| 0.1 | 0.2 | GO:0021557 | oculomotor nerve development(GO:0021557) ascending aorta development(GO:0035905) ascending aorta morphogenesis(GO:0035910) |
| 0.1 | 1.2 | GO:0006699 | bile acid biosynthetic process(GO:0006699) |
| 0.1 | 0.4 | GO:0060648 | mammary gland bud morphogenesis(GO:0060648) |
| 0.1 | 0.2 | GO:1902310 | positive regulation of peptidyl-serine dephosphorylation(GO:1902310) |
| 0.1 | 0.4 | GO:0036444 | calcium ion transmembrane import into mitochondrion(GO:0036444) |
| 0.1 | 1.6 | GO:0035855 | megakaryocyte development(GO:0035855) |
| 0.1 | 0.1 | GO:0098869 | cellular oxidant detoxification(GO:0098869) |
| 0.1 | 0.2 | GO:1904879 | positive regulation of calcium ion transmembrane transport via high voltage-gated calcium channel(GO:1904879) |
| 0.1 | 0.1 | GO:0018197 | peptidyl-aspartic acid modification(GO:0018197) |
| 0.1 | 0.6 | GO:1901339 | regulation of store-operated calcium channel activity(GO:1901339) |
| 0.1 | 0.4 | GO:0015862 | uridine transport(GO:0015862) |
| 0.1 | 0.5 | GO:0035947 | regulation of gluconeogenesis by regulation of transcription from RNA polymerase II promoter(GO:0035947) |
| 0.1 | 0.2 | GO:0090327 | negative regulation of locomotion involved in locomotory behavior(GO:0090327) |
| 0.1 | 0.3 | GO:1905049 | negative regulation of metalloendopeptidase activity(GO:1904684) negative regulation of metallopeptidase activity(GO:1905049) |
| 0.1 | 0.2 | GO:0002447 | eosinophil activation involved in immune response(GO:0002278) eosinophil mediated immunity(GO:0002447) eosinophil degranulation(GO:0043308) |
| 0.0 | 0.5 | GO:0070886 | positive regulation of calcineurin-NFAT signaling cascade(GO:0070886) |
| 0.0 | 0.2 | GO:0006438 | valyl-tRNA aminoacylation(GO:0006438) |
| 0.0 | 0.4 | GO:0008343 | adult feeding behavior(GO:0008343) |
| 0.0 | 0.2 | GO:0050861 | positive regulation of B cell receptor signaling pathway(GO:0050861) |
| 0.0 | 0.1 | GO:0045448 | regulation of mitotic cell cycle, embryonic(GO:0009794) mitotic cell cycle, embryonic(GO:0045448) |
| 0.0 | 0.3 | GO:0006108 | malate metabolic process(GO:0006108) |
| 0.0 | 0.3 | GO:0061668 | mitochondrial ribosome assembly(GO:0061668) |
| 0.0 | 0.1 | GO:0070543 | response to linoleic acid(GO:0070543) |
| 0.0 | 0.2 | GO:0046880 | regulation of follicle-stimulating hormone secretion(GO:0046880) follicle-stimulating hormone secretion(GO:0046884) |
| 0.0 | 0.3 | GO:0060576 | intestinal epithelial cell development(GO:0060576) |
| 0.0 | 0.3 | GO:2001054 | negative regulation of mesenchymal cell apoptotic process(GO:2001054) |
| 0.0 | 0.4 | GO:0019262 | N-acetylneuraminate catabolic process(GO:0019262) |
| 0.0 | 0.4 | GO:0043084 | penile erection(GO:0043084) |
| 0.0 | 0.4 | GO:0034773 | histone H4-K20 trimethylation(GO:0034773) |
| 0.0 | 0.5 | GO:0060394 | negative regulation of pathway-restricted SMAD protein phosphorylation(GO:0060394) |
| 0.0 | 0.1 | GO:0097428 | protein maturation by iron-sulfur cluster transfer(GO:0097428) |
| 0.0 | 0.2 | GO:0003223 | ventricular compact myocardium morphogenesis(GO:0003223) proprioception(GO:0019230) |
| 0.0 | 0.1 | GO:0001561 | fatty acid alpha-oxidation(GO:0001561) |
| 0.0 | 0.1 | GO:0032289 | central nervous system myelin formation(GO:0032289) |
| 0.0 | 0.3 | GO:0060736 | prostate gland growth(GO:0060736) |
| 0.0 | 0.5 | GO:1900745 | positive regulation of p38MAPK cascade(GO:1900745) |
| 0.0 | 0.2 | GO:0021764 | amygdala development(GO:0021764) |
| 0.0 | 0.3 | GO:0001675 | acrosome assembly(GO:0001675) |
| 0.0 | 0.3 | GO:0036123 | histone H3-K9 dimethylation(GO:0036123) |
| 0.0 | 0.5 | GO:0016973 | poly(A)+ mRNA export from nucleus(GO:0016973) |
| 0.0 | 0.2 | GO:0075522 | IRES-dependent viral translational initiation(GO:0075522) |
| 0.0 | 0.2 | GO:0018344 | protein geranylgeranylation(GO:0018344) |
| 0.0 | 0.1 | GO:0090202 | transcriptional activation by promoter-enhancer looping(GO:0071733) gene looping(GO:0090202) dsDNA loop formation(GO:0090579) |
| 0.0 | 0.1 | GO:1902445 | regulation of mitochondrial membrane permeability involved in programmed necrotic cell death(GO:1902445) |
| 0.0 | 0.1 | GO:0070836 | caveola assembly(GO:0070836) |
| 0.0 | 0.2 | GO:0071712 | ER-associated misfolded protein catabolic process(GO:0071712) |
| 0.0 | 0.2 | GO:0006020 | inositol metabolic process(GO:0006020) |
| 0.0 | 0.3 | GO:0050901 | leukocyte tethering or rolling(GO:0050901) |
| 0.0 | 0.3 | GO:0035493 | SNARE complex assembly(GO:0035493) |
| 0.0 | 0.1 | GO:0048227 | plasma membrane to endosome transport(GO:0048227) |
| 0.0 | 0.4 | GO:0007413 | axonal fasciculation(GO:0007413) |
| 0.0 | 0.6 | GO:2000811 | negative regulation of anoikis(GO:2000811) |
| 0.0 | 0.5 | GO:0031958 | corticosteroid receptor signaling pathway(GO:0031958) |
| 0.0 | 0.0 | GO:0050847 | progesterone receptor signaling pathway(GO:0050847) |
| 0.0 | 0.5 | GO:0035335 | peptidyl-tyrosine dephosphorylation(GO:0035335) |
| 0.0 | 0.1 | GO:0005513 | detection of calcium ion(GO:0005513) |
| 0.0 | 0.2 | GO:0046697 | decidualization(GO:0046697) |
| 0.0 | 0.1 | GO:0006419 | alanyl-tRNA aminoacylation(GO:0006419) |
| 0.0 | 0.4 | GO:0051044 | positive regulation of membrane protein ectodomain proteolysis(GO:0051044) |
| 0.0 | 0.1 | GO:0071218 | cellular response to misfolded protein(GO:0071218) |
| 0.0 | 0.0 | GO:0071374 | cellular response to parathyroid hormone stimulus(GO:0071374) |
| 0.0 | 0.2 | GO:0006105 | succinate metabolic process(GO:0006105) |
| 0.0 | 0.6 | GO:0033014 | porphyrin-containing compound biosynthetic process(GO:0006779) tetrapyrrole biosynthetic process(GO:0033014) |
| 0.0 | 0.0 | GO:1903232 | melanosome assembly(GO:1903232) |
| 0.0 | 0.1 | GO:0002457 | T cell antigen processing and presentation(GO:0002457) |
| 0.0 | 1.1 | GO:0045638 | negative regulation of myeloid cell differentiation(GO:0045638) |
| 0.0 | 0.1 | GO:0000379 | tRNA-type intron splice site recognition and cleavage(GO:0000379) |
| 0.0 | 0.1 | GO:0045200 | establishment or maintenance of neuroblast polarity(GO:0045196) establishment of neuroblast polarity(GO:0045200) |
| 0.0 | 0.4 | GO:0007638 | mechanosensory behavior(GO:0007638) |
| 0.0 | 0.4 | GO:0032728 | positive regulation of interferon-beta production(GO:0032728) |
| 0.0 | 0.1 | GO:1902416 | positive regulation of mRNA binding(GO:1902416) positive regulation of RNA binding(GO:1905216) |
| 0.0 | 0.6 | GO:0030490 | maturation of SSU-rRNA(GO:0030490) |
| 0.0 | 0.1 | GO:0019886 | antigen processing and presentation of exogenous peptide antigen via MHC class II(GO:0019886) |
| 0.0 | 0.2 | GO:0044406 | adhesion of symbiont to host(GO:0044406) |
| 0.0 | 0.1 | GO:0048096 | chromatin-mediated maintenance of transcription(GO:0048096) |
| 0.0 | 0.5 | GO:2000134 | negative regulation of G1/S transition of mitotic cell cycle(GO:2000134) |
| 0.0 | 0.1 | GO:0006268 | DNA unwinding involved in DNA replication(GO:0006268) |
| 0.0 | 0.1 | GO:0043518 | negative regulation of DNA damage response, signal transduction by p53 class mediator(GO:0043518) |
Gene overrepresentation in cellular_component category:
| Log-likelihood per target | Total log-likelihood | Term | Description |
|---|---|---|---|
| 0.3 | 2.5 | GO:0005862 | muscle thin filament tropomyosin(GO:0005862) |
| 0.3 | 2.3 | GO:0070369 | beta-catenin-TCF7L2 complex(GO:0070369) |
| 0.2 | 0.6 | GO:0034751 | aryl hydrocarbon receptor complex(GO:0034751) |
| 0.2 | 1.2 | GO:0016593 | Cdc73/Paf1 complex(GO:0016593) |
| 0.1 | 0.3 | GO:0000801 | central element(GO:0000801) |
| 0.1 | 0.5 | GO:0071556 | integral component of cytoplasmic side of endoplasmic reticulum membrane(GO:0071458) integral component of lumenal side of endoplasmic reticulum membrane(GO:0071556) lumenal side of endoplasmic reticulum membrane(GO:0098553) |
| 0.1 | 0.6 | GO:0008091 | spectrin(GO:0008091) |
| 0.1 | 0.3 | GO:0005588 | collagen type V trimer(GO:0005588) |
| 0.1 | 0.2 | GO:0043512 | inhibin-betaglycan-ActRII complex(GO:0034673) inhibin A complex(GO:0043512) |
| 0.1 | 0.7 | GO:0034993 | microtubule organizing center attachment site(GO:0034992) LINC complex(GO:0034993) |
| 0.1 | 0.4 | GO:0031262 | Ndc80 complex(GO:0031262) |
| 0.1 | 0.3 | GO:0033553 | rDNA heterochromatin(GO:0033553) |
| 0.1 | 0.4 | GO:1990246 | uniplex complex(GO:1990246) |
| 0.0 | 0.1 | GO:0014802 | terminal cisterna(GO:0014802) |
| 0.0 | 0.2 | GO:0005968 | Rab-protein geranylgeranyltransferase complex(GO:0005968) |
| 0.0 | 0.2 | GO:0070032 | synaptobrevin 2-SNAP-25-syntaxin-1a-complexin I complex(GO:0070032) synaptobrevin 2-SNAP-25-syntaxin-1a-complexin II complex(GO:0070033) |
| 0.0 | 1.6 | GO:0034707 | chloride channel complex(GO:0034707) |
| 0.0 | 0.5 | GO:0042405 | nuclear inclusion body(GO:0042405) |
| 0.0 | 0.1 | GO:0031230 | intrinsic component of cell outer membrane(GO:0031230) integral component of cell outer membrane(GO:0045203) |
| 0.0 | 0.4 | GO:0042555 | MCM complex(GO:0042555) |
| 0.0 | 1.0 | GO:0080008 | Cul4-RING E3 ubiquitin ligase complex(GO:0080008) |
| 0.0 | 0.2 | GO:1990454 | L-type voltage-gated calcium channel complex(GO:1990454) |
| 0.0 | 0.1 | GO:0071817 | MMXD complex(GO:0071817) |
| 0.0 | 0.1 | GO:0001674 | female germ cell nucleus(GO:0001674) |
| 0.0 | 0.4 | GO:0000780 | condensed nuclear chromosome, centromeric region(GO:0000780) |
| 0.0 | 0.1 | GO:0042613 | MHC class II protein complex(GO:0042613) |
| 0.0 | 0.1 | GO:0030015 | CCR4-NOT core complex(GO:0030015) |
| 0.0 | 0.3 | GO:0036038 | MKS complex(GO:0036038) |
| 0.0 | 0.2 | GO:0000164 | protein phosphatase type 1 complex(GO:0000164) |
| 0.0 | 0.1 | GO:0072687 | meiotic spindle(GO:0072687) |
| 0.0 | 0.2 | GO:0020005 | symbiont-containing vacuole membrane(GO:0020005) |
| 0.0 | 0.6 | GO:0016592 | mediator complex(GO:0016592) |
| 0.0 | 0.1 | GO:0016342 | catenin complex(GO:0016342) |
| 0.0 | 0.1 | GO:0045261 | mitochondrial proton-transporting ATP synthase complex, catalytic core F(1)(GO:0000275) proton-transporting ATP synthase complex, catalytic core F(1)(GO:0045261) |
| 0.0 | 0.2 | GO:0030057 | desmosome(GO:0030057) |
| 0.0 | 0.2 | GO:0097225 | sperm midpiece(GO:0097225) |
| 0.0 | 0.5 | GO:0032391 | photoreceptor connecting cilium(GO:0032391) |
Gene overrepresentation in molecular_function category:
| Log-likelihood per target | Total log-likelihood | Term | Description |
|---|---|---|---|
| 0.3 | 1.2 | GO:0019911 | structural constituent of myelin sheath(GO:0019911) |
| 0.2 | 1.7 | GO:0052650 | NADP-retinol dehydrogenase activity(GO:0052650) |
| 0.2 | 0.8 | GO:0034714 | type III transforming growth factor beta receptor binding(GO:0034714) |
| 0.2 | 0.6 | GO:0046538 | bisphosphoglycerate mutase activity(GO:0004082) bisphosphoglycerate 2-phosphatase activity(GO:0004083) phosphoglycerate mutase activity(GO:0004619) 2,3-bisphosphoglycerate-dependent phosphoglycerate mutase activity(GO:0046538) |
| 0.2 | 0.6 | GO:0036004 | GAF domain binding(GO:0036004) |
| 0.1 | 0.5 | GO:0003976 | UDP-N-acetylglucosamine-lysosomal-enzyme N-acetylglucosaminephosphotransferase activity(GO:0003976) |
| 0.1 | 2.4 | GO:0045295 | gamma-catenin binding(GO:0045295) |
| 0.1 | 0.4 | GO:0004784 | superoxide dismutase activity(GO:0004784) oxidoreductase activity, acting on superoxide radicals as acceptor(GO:0016721) |
| 0.1 | 0.3 | GO:0004471 | malic enzyme activity(GO:0004470) malate dehydrogenase (decarboxylating) (NAD+) activity(GO:0004471) |
| 0.1 | 0.4 | GO:0005005 | transmembrane-ephrin receptor activity(GO:0005005) |
| 0.1 | 0.4 | GO:0042799 | histone methyltransferase activity (H4-K20 specific)(GO:0042799) |
| 0.1 | 1.2 | GO:0001222 | transcription corepressor binding(GO:0001222) |
| 0.1 | 0.2 | GO:0016635 | oxidoreductase activity, acting on the CH-CH group of donors, quinone or related compound as acceptor(GO:0016635) |
| 0.1 | 0.2 | GO:0004921 | interleukin-11 receptor activity(GO:0004921) interleukin-11 binding(GO:0019970) |
| 0.1 | 0.2 | GO:0004663 | Rab geranylgeranyltransferase activity(GO:0004663) |
| 0.1 | 0.5 | GO:0042500 | aspartic endopeptidase activity, intramembrane cleaving(GO:0042500) |
| 0.1 | 0.6 | GO:0005168 | neurotrophin TRKA receptor binding(GO:0005168) |
| 0.0 | 0.2 | GO:0001069 | regulatory region RNA binding(GO:0001069) |
| 0.0 | 0.5 | GO:0005041 | low-density lipoprotein receptor activity(GO:0005041) |
| 0.0 | 0.2 | GO:0004832 | valine-tRNA ligase activity(GO:0004832) |
| 0.0 | 0.2 | GO:0000832 | inositol hexakisphosphate kinase activity(GO:0000828) inositol hexakisphosphate 5-kinase activity(GO:0000832) inositol hexakisphosphate 1-kinase activity(GO:0052723) inositol hexakisphosphate 3-kinase activity(GO:0052724) |
| 0.0 | 0.3 | GO:0001515 | opioid peptide activity(GO:0001515) |
| 0.0 | 0.5 | GO:0048018 | receptor agonist activity(GO:0048018) |
| 0.0 | 0.5 | GO:0005229 | intracellular calcium activated chloride channel activity(GO:0005229) |
| 0.0 | 0.1 | GO:0004711 | ribosomal protein S6 kinase activity(GO:0004711) |
| 0.0 | 0.2 | GO:0043426 | MRF binding(GO:0043426) |
| 0.0 | 0.5 | GO:0043522 | leucine zipper domain binding(GO:0043522) |
| 0.0 | 3.1 | GO:0005200 | structural constituent of cytoskeleton(GO:0005200) |
| 0.0 | 0.5 | GO:0034713 | type I transforming growth factor beta receptor binding(GO:0034713) |
| 0.0 | 0.1 | GO:0042731 | PH domain binding(GO:0042731) |
| 0.0 | 0.6 | GO:0008253 | 5'-nucleotidase activity(GO:0008253) |
| 0.0 | 1.7 | GO:0017080 | sodium channel regulator activity(GO:0017080) |
| 0.0 | 0.5 | GO:0008601 | protein phosphatase type 2A regulator activity(GO:0008601) |
| 0.0 | 0.5 | GO:0001223 | transcription coactivator binding(GO:0001223) |
| 0.0 | 1.2 | GO:0004715 | non-membrane spanning protein tyrosine kinase activity(GO:0004715) |
| 0.0 | 0.4 | GO:0008656 | cysteine-type endopeptidase activator activity involved in apoptotic process(GO:0008656) |
| 0.0 | 0.1 | GO:0004427 | inorganic diphosphatase activity(GO:0004427) |
| 0.0 | 0.2 | GO:0031690 | adrenergic receptor binding(GO:0031690) |
| 0.0 | 0.2 | GO:0034711 | inhibin binding(GO:0034711) |
| 0.0 | 0.4 | GO:0016857 | racemase and epimerase activity, acting on carbohydrates and derivatives(GO:0016857) |
| 0.0 | 0.3 | GO:0003680 | AT DNA binding(GO:0003680) |
| 0.0 | 0.4 | GO:0019855 | calcium channel inhibitor activity(GO:0019855) |
| 0.0 | 0.4 | GO:0005184 | neuropeptide hormone activity(GO:0005184) |
| 0.0 | 0.6 | GO:0003785 | actin monomer binding(GO:0003785) |
| 0.0 | 0.1 | GO:0035497 | cAMP response element binding(GO:0035497) |
| 0.0 | 1.7 | GO:0003823 | antigen binding(GO:0003823) |
| 0.0 | 0.8 | GO:0031492 | nucleosomal DNA binding(GO:0031492) |
| 0.0 | 0.1 | GO:1990715 | mRNA CDS binding(GO:1990715) |
| 0.0 | 0.1 | GO:0070728 | leucine binding(GO:0070728) |
| 0.0 | 0.3 | GO:0008191 | metalloendopeptidase inhibitor activity(GO:0008191) |
| 0.0 | 0.4 | GO:0005337 | nucleoside transmembrane transporter activity(GO:0005337) |
| 0.0 | 0.6 | GO:0005112 | Notch binding(GO:0005112) |
| 0.0 | 0.1 | GO:0016018 | cyclosporin A binding(GO:0016018) |
| 0.0 | 0.1 | GO:0004813 | alanine-tRNA ligase activity(GO:0004813) |
| 0.0 | 0.3 | GO:0070300 | phosphatidic acid binding(GO:0070300) |
| 0.0 | 0.4 | GO:0005521 | lamin binding(GO:0005521) |
| 0.0 | 0.3 | GO:0048407 | platelet-derived growth factor binding(GO:0048407) |
| 0.0 | 0.6 | GO:0004709 | MAP kinase kinase kinase activity(GO:0004709) |
| 0.0 | 0.2 | GO:0016500 | protein-hormone receptor activity(GO:0016500) |
| 0.0 | 0.2 | GO:0008484 | sulfuric ester hydrolase activity(GO:0008484) |
| 0.0 | 0.4 | GO:0001106 | RNA polymerase II transcription corepressor activity(GO:0001106) |
| 0.0 | 0.0 | GO:0035651 | AP-1 adaptor complex binding(GO:0035650) AP-3 adaptor complex binding(GO:0035651) |
| 0.0 | 4.2 | GO:0001077 | transcriptional activator activity, RNA polymerase II core promoter proximal region sequence-specific binding(GO:0001077) |
| 0.0 | 0.4 | GO:0017017 | MAP kinase tyrosine/serine/threonine phosphatase activity(GO:0017017) |
| 0.0 | 0.4 | GO:0005246 | calcium channel regulator activity(GO:0005246) |
| 0.0 | 0.1 | GO:0019784 | NEDD8-specific protease activity(GO:0019784) |
| 0.0 | 0.4 | GO:0050699 | WW domain binding(GO:0050699) |
| 0.0 | 0.5 | GO:0008748 | N-ethylmaleimide reductase activity(GO:0008748) reduced coenzyme F420 dehydrogenase activity(GO:0043738) sulfur oxygenase reductase activity(GO:0043826) malolactic enzyme activity(GO:0043883) epoxyqueuosine reductase activity(GO:0052693) |
| 0.0 | 0.1 | GO:0017034 | Rap guanyl-nucleotide exchange factor activity(GO:0017034) |
| 0.0 | 0.6 | GO:0004003 | ATP-dependent DNA helicase activity(GO:0004003) |
| 0.0 | 0.1 | GO:0030976 | thiamine pyrophosphate binding(GO:0030976) |
| 0.0 | 0.5 | GO:0005484 | SNAP receptor activity(GO:0005484) |
| 0.0 | 0.9 | GO:0004702 | receptor signaling protein serine/threonine kinase activity(GO:0004702) |
|
|
|
|