| 1.4 |
4.1 |
GO:0001803 |
type III hypersensitivity(GO:0001802) regulation of type III hypersensitivity(GO:0001803) positive regulation of type III hypersensitivity(GO:0001805) |
| 1.0 |
5.2 |
GO:2000255 |
negative regulation of male germ cell proliferation(GO:2000255) |
| 1.0 |
4.9 |
GO:0070327 |
thyroid hormone transport(GO:0070327) |
| 0.9 |
2.8 |
GO:0002586 |
positive regulation of antigen processing and presentation of peptide or polysaccharide antigen via MHC class II(GO:0002582) regulation of antigen processing and presentation of peptide antigen via MHC class II(GO:0002586) positive regulation of antigen processing and presentation of peptide antigen via MHC class II(GO:0002588) |
| 0.8 |
2.3 |
GO:0015889 |
cobalamin transport(GO:0015889) |
| 0.7 |
2.1 |
GO:0014738 |
regulation of muscle hyperplasia(GO:0014738) muscle hyperplasia(GO:0014900) |
| 0.7 |
2.1 |
GO:0001869 |
regulation of complement activation, lectin pathway(GO:0001868) negative regulation of complement activation, lectin pathway(GO:0001869) |
| 0.6 |
1.9 |
GO:1903795 |
regulation of inorganic anion transmembrane transport(GO:1903795) |
| 0.6 |
1.7 |
GO:0030421 |
defecation(GO:0030421) |
| 0.6 |
2.2 |
GO:0071280 |
cellular response to copper ion(GO:0071280) |
| 0.5 |
1.9 |
GO:0032901 |
positive regulation of neurotrophin production(GO:0032901) |
| 0.4 |
1.3 |
GO:0003032 |
detection of oxygen(GO:0003032) |
| 0.4 |
2.0 |
GO:0045657 |
positive regulation of monocyte differentiation(GO:0045657) |
| 0.4 |
2.8 |
GO:0019370 |
leukotriene biosynthetic process(GO:0019370) |
| 0.4 |
1.1 |
GO:1902310 |
positive regulation of peptidyl-serine dephosphorylation(GO:1902310) |
| 0.4 |
1.1 |
GO:1901552 |
positive regulation of endothelial cell development(GO:1901552) positive regulation of establishment of endothelial barrier(GO:1903142) |
| 0.4 |
0.4 |
GO:2000823 |
regulation of androgen receptor activity(GO:2000823) |
| 0.4 |
1.4 |
GO:0071449 |
cellular response to lipid hydroperoxide(GO:0071449) |
| 0.4 |
1.1 |
GO:0061537 |
glycine secretion(GO:0061536) glycine secretion, neurotransmission(GO:0061537) |
| 0.3 |
1.0 |
GO:0070625 |
zymogen granule exocytosis(GO:0070625) |
| 0.3 |
2.9 |
GO:0019800 |
peptide cross-linking via chondroitin 4-sulfate glycosaminoglycan(GO:0019800) |
| 0.3 |
1.2 |
GO:1903416 |
response to glycoside(GO:1903416) |
| 0.3 |
0.9 |
GO:0048389 |
intermediate mesoderm development(GO:0048389) pattern specification involved in mesonephros development(GO:0061227) anterior/posterior pattern specification involved in kidney development(GO:0072098) ureter urothelium development(GO:0072190) |
| 0.3 |
0.9 |
GO:0014063 |
negative regulation of serotonin secretion(GO:0014063) |
| 0.3 |
0.9 |
GO:0060166 |
olfactory pit development(GO:0060166) |
| 0.3 |
1.5 |
GO:0051593 |
response to folic acid(GO:0051593) |
| 0.3 |
0.9 |
GO:0016068 |
regulation of type I hypersensitivity(GO:0001810) type I hypersensitivity(GO:0016068) |
| 0.3 |
1.1 |
GO:0031509 |
telomeric heterochromatin assembly(GO:0031509) negative regulation of chromosome condensation(GO:1902340) |
| 0.3 |
1.1 |
GO:1901252 |
regulation of intracellular transport of viral material(GO:1901252) |
| 0.3 |
1.0 |
GO:0034145 |
positive regulation of toll-like receptor 4 signaling pathway(GO:0034145) |
| 0.3 |
0.8 |
GO:0003245 |
cardiac muscle tissue growth involved in heart morphogenesis(GO:0003245) |
| 0.3 |
0.3 |
GO:0038166 |
angiotensin-activated signaling pathway(GO:0038166) |
| 0.2 |
2.4 |
GO:0018149 |
peptide cross-linking(GO:0018149) |
| 0.2 |
2.3 |
GO:0070574 |
cadmium ion transport(GO:0015691) cadmium ion transmembrane transport(GO:0070574) |
| 0.2 |
0.9 |
GO:0048819 |
regulation of hair follicle maturation(GO:0048819) regulation of catagen(GO:0051794) |
| 0.2 |
2.1 |
GO:0042136 |
neurotransmitter biosynthetic process(GO:0042136) |
| 0.2 |
0.2 |
GO:0002513 |
tolerance induction to self antigen(GO:0002513) |
| 0.2 |
1.1 |
GO:0021905 |
pancreatic A cell development(GO:0003322) forebrain-midbrain boundary formation(GO:0021905) somatic motor neuron fate commitment(GO:0021917) regulation of transcription from RNA polymerase II promoter involved in somatic motor neuron fate commitment(GO:0021918) |
| 0.2 |
0.2 |
GO:0033762 |
response to glucagon(GO:0033762) |
| 0.2 |
0.4 |
GO:0035771 |
interleukin-4-mediated signaling pathway(GO:0035771) |
| 0.2 |
0.7 |
GO:0036233 |
glycine import(GO:0036233) |
| 0.2 |
0.9 |
GO:0050904 |
diapedesis(GO:0050904) |
| 0.2 |
1.3 |
GO:0042270 |
protection from natural killer cell mediated cytotoxicity(GO:0042270) |
| 0.2 |
0.9 |
GO:0042590 |
antigen processing and presentation of exogenous peptide antigen via MHC class I(GO:0042590) |
| 0.2 |
1.1 |
GO:2000668 |
dendritic cell apoptotic process(GO:0097048) regulation of dendritic cell apoptotic process(GO:2000668) |
| 0.2 |
0.6 |
GO:0072554 |
blood vessel lumenization(GO:0072554) |
| 0.2 |
1.0 |
GO:0034441 |
plasma lipoprotein particle oxidation(GO:0034441) |
| 0.2 |
0.6 |
GO:0033364 |
mast cell secretory granule organization(GO:0033364) |
| 0.2 |
1.2 |
GO:1902847 |
macrophage proliferation(GO:0061517) microglial cell proliferation(GO:0061518) regulation of neuronal signal transduction(GO:1902847) positive regulation of tau-protein kinase activity(GO:1902949) |
| 0.2 |
0.4 |
GO:0061344 |
regulation of cell adhesion involved in heart morphogenesis(GO:0061344) positive regulation of ephrin receptor signaling pathway(GO:1901189) |
| 0.2 |
0.6 |
GO:0046122 |
purine deoxyribonucleoside metabolic process(GO:0046122) |
| 0.2 |
2.6 |
GO:0045647 |
negative regulation of erythrocyte differentiation(GO:0045647) |
| 0.2 |
0.6 |
GO:0002309 |
T cell proliferation involved in immune response(GO:0002309) |
| 0.2 |
0.2 |
GO:0006642 |
triglyceride mobilization(GO:0006642) |
| 0.2 |
0.4 |
GO:2000157 |
regulation of protein K48-linked deubiquitination(GO:1903093) negative regulation of protein K48-linked deubiquitination(GO:1903094) negative regulation of ubiquitin-specific protease activity(GO:2000157) |
| 0.2 |
0.4 |
GO:0014062 |
regulation of serotonin secretion(GO:0014062) |
| 0.2 |
1.2 |
GO:1904714 |
regulation of Schwann cell proliferation(GO:0010624) regulation of chaperone-mediated autophagy(GO:1904714) |
| 0.2 |
0.9 |
GO:0048143 |
astrocyte activation(GO:0048143) |
| 0.2 |
0.8 |
GO:0060842 |
arterial endothelial cell differentiation(GO:0060842) |
| 0.2 |
0.6 |
GO:0090425 |
hepatocyte cell migration(GO:0002194) pancreas morphogenesis(GO:0061113) branching involved in pancreas morphogenesis(GO:0061114) acinar cell differentiation(GO:0090425) positive regulation of forebrain neuron differentiation(GO:2000979) |
| 0.2 |
2.0 |
GO:2000653 |
regulation of genetic imprinting(GO:2000653) |
| 0.2 |
0.5 |
GO:0046104 |
thymidine metabolic process(GO:0046104) |
| 0.2 |
0.2 |
GO:0071374 |
cellular response to parathyroid hormone stimulus(GO:0071374) |
| 0.2 |
0.9 |
GO:1903012 |
positive regulation of bone development(GO:1903012) |
| 0.2 |
0.2 |
GO:0006982 |
response to lipid hydroperoxide(GO:0006982) |
| 0.2 |
0.9 |
GO:0007494 |
midgut development(GO:0007494) |
| 0.2 |
0.2 |
GO:0061668 |
mitochondrial ribosome assembly(GO:0061668) |
| 0.2 |
0.5 |
GO:0006691 |
leukotriene metabolic process(GO:0006691) |
| 0.2 |
0.5 |
GO:0060437 |
lung growth(GO:0060437) |
| 0.2 |
0.5 |
GO:2000097 |
regulation of smooth muscle cell-matrix adhesion(GO:2000097) |
| 0.2 |
0.5 |
GO:0002430 |
complement receptor mediated signaling pathway(GO:0002430) |
| 0.2 |
0.5 |
GO:0035633 |
maintenance of blood-brain barrier(GO:0035633) |
| 0.2 |
0.7 |
GO:1904426 |
positive regulation of GTP binding(GO:1904426) regulation of hydrogen:potassium-exchanging ATPase activity(GO:1904451) positive regulation of hydrogen:potassium-exchanging ATPase activity(GO:1904453) |
| 0.2 |
0.5 |
GO:0046598 |
positive regulation of viral entry into host cell(GO:0046598) |
| 0.2 |
1.3 |
GO:0018401 |
peptidyl-proline hydroxylation to 4-hydroxy-L-proline(GO:0018401) |
| 0.2 |
0.5 |
GO:0071104 |
response to interleukin-9(GO:0071104) |
| 0.2 |
0.5 |
GO:0060160 |
negative regulation of dopamine receptor signaling pathway(GO:0060160) |
| 0.2 |
1.0 |
GO:0060718 |
chorionic trophoblast cell differentiation(GO:0060718) |
| 0.2 |
1.0 |
GO:0006957 |
complement activation, alternative pathway(GO:0006957) |
| 0.2 |
1.1 |
GO:0015862 |
uridine transport(GO:0015862) |
| 0.2 |
0.3 |
GO:0031529 |
ruffle organization(GO:0031529) |
| 0.2 |
0.6 |
GO:0060075 |
regulation of resting membrane potential(GO:0060075) |
| 0.2 |
0.5 |
GO:0002408 |
myeloid dendritic cell chemotaxis(GO:0002408) |
| 0.2 |
0.3 |
GO:0072179 |
nephric duct formation(GO:0072179) regulation of DNA demethylation(GO:1901535) negative regulation of DNA demethylation(GO:1901536) |
| 0.2 |
0.5 |
GO:0010896 |
regulation of triglyceride catabolic process(GO:0010896) positive regulation of triglyceride catabolic process(GO:0010898) |
| 0.2 |
0.3 |
GO:0008228 |
opsonization(GO:0008228) |
| 0.2 |
0.2 |
GO:0046544 |
development of secondary male sexual characteristics(GO:0046544) |
| 0.2 |
0.2 |
GO:0070366 |
regulation of hepatocyte differentiation(GO:0070366) |
| 0.2 |
0.8 |
GO:0090292 |
nuclear matrix organization(GO:0043578) nuclear matrix anchoring at nuclear membrane(GO:0090292) |
| 0.2 |
0.8 |
GO:0046864 |
retinol transport(GO:0034633) nose morphogenesis(GO:0043585) isoprenoid transport(GO:0046864) terpenoid transport(GO:0046865) alveolar primary septum development(GO:0061143) |
| 0.2 |
0.8 |
GO:0010387 |
COP9 signalosome assembly(GO:0010387) |
| 0.2 |
0.2 |
GO:0009757 |
carbohydrate mediated signaling(GO:0009756) hexose mediated signaling(GO:0009757) sugar mediated signaling pathway(GO:0010182) glucose mediated signaling pathway(GO:0010255) |
| 0.2 |
2.0 |
GO:0006958 |
complement activation, classical pathway(GO:0006958) |
| 0.2 |
1.4 |
GO:0043568 |
positive regulation of insulin-like growth factor receptor signaling pathway(GO:0043568) |
| 0.1 |
0.4 |
GO:2000501 |
natural killer cell chemotaxis(GO:0035747) regulation of natural killer cell chemotaxis(GO:2000501) |
| 0.1 |
0.3 |
GO:0002679 |
respiratory burst involved in defense response(GO:0002679) |
| 0.1 |
0.3 |
GO:0007210 |
serotonin receptor signaling pathway(GO:0007210) |
| 0.1 |
1.8 |
GO:0042573 |
retinoic acid metabolic process(GO:0042573) |
| 0.1 |
0.4 |
GO:0060392 |
negative regulation of SMAD protein import into nucleus(GO:0060392) |
| 0.1 |
0.9 |
GO:0003433 |
chondrocyte development involved in endochondral bone morphogenesis(GO:0003433) |
| 0.1 |
0.1 |
GO:0031652 |
positive regulation of heat generation(GO:0031652) |
| 0.1 |
0.4 |
GO:0044650 |
virion attachment to host cell(GO:0019062) adhesion of symbiont to host cell(GO:0044650) |
| 0.1 |
1.9 |
GO:0050765 |
negative regulation of phagocytosis(GO:0050765) |
| 0.1 |
0.6 |
GO:0007039 |
protein catabolic process in the vacuole(GO:0007039) |
| 0.1 |
1.4 |
GO:0048711 |
positive regulation of astrocyte differentiation(GO:0048711) |
| 0.1 |
0.4 |
GO:0072356 |
chromosome passenger complex localization to kinetochore(GO:0072356) |
| 0.1 |
0.8 |
GO:0006590 |
thyroid hormone generation(GO:0006590) |
| 0.1 |
0.4 |
GO:0007223 |
Wnt signaling pathway, calcium modulating pathway(GO:0007223) |
| 0.1 |
0.3 |
GO:1903963 |
arachidonic acid secretion(GO:0050482) arachidonate transport(GO:1903963) |
| 0.1 |
0.1 |
GO:0060528 |
secretory columnal luminar epithelial cell differentiation involved in prostate glandular acinus development(GO:0060528) |
| 0.1 |
0.9 |
GO:0001887 |
selenium compound metabolic process(GO:0001887) |
| 0.1 |
0.4 |
GO:1904395 |
regulation of skeletal muscle acetylcholine-gated channel clustering(GO:1904393) positive regulation of skeletal muscle acetylcholine-gated channel clustering(GO:1904395) |
| 0.1 |
0.5 |
GO:0019346 |
homoserine metabolic process(GO:0009092) transsulfuration(GO:0019346) |
| 0.1 |
0.8 |
GO:0043654 |
recognition of apoptotic cell(GO:0043654) |
| 0.1 |
0.5 |
GO:0072697 |
protein localization to cell cortex(GO:0072697) |
| 0.1 |
0.9 |
GO:0048251 |
elastic fiber assembly(GO:0048251) |
| 0.1 |
0.4 |
GO:0006116 |
NADH oxidation(GO:0006116) |
| 0.1 |
2.3 |
GO:0046597 |
negative regulation of viral entry into host cell(GO:0046597) |
| 0.1 |
0.4 |
GO:0042196 |
dichloromethane metabolic process(GO:0018900) chlorinated hydrocarbon metabolic process(GO:0042196) halogenated hydrocarbon metabolic process(GO:0042197) |
| 0.1 |
0.4 |
GO:0010725 |
regulation of primitive erythrocyte differentiation(GO:0010725) |
| 0.1 |
1.7 |
GO:0046688 |
response to copper ion(GO:0046688) |
| 0.1 |
0.9 |
GO:0038028 |
insulin receptor signaling pathway via phosphatidylinositol 3-kinase(GO:0038028) |
| 0.1 |
0.5 |
GO:0097211 |
response to gonadotropin-releasing hormone(GO:0097210) cellular response to gonadotropin-releasing hormone(GO:0097211) |
| 0.1 |
0.6 |
GO:0007171 |
activation of transmembrane receptor protein tyrosine kinase activity(GO:0007171) |
| 0.1 |
0.6 |
GO:0050861 |
positive regulation of B cell receptor signaling pathway(GO:0050861) |
| 0.1 |
0.2 |
GO:0036518 |
chemorepulsion of dopaminergic neuron axon(GO:0036518) |
| 0.1 |
0.5 |
GO:0002481 |
antigen processing and presentation of exogenous peptide antigen via MHC class Ib(GO:0002477) antigen processing and presentation of exogenous protein antigen via MHC class Ib, TAP-dependent(GO:0002481) |
| 0.1 |
0.5 |
GO:0042373 |
vitamin K metabolic process(GO:0042373) |
| 0.1 |
0.7 |
GO:0014054 |
positive regulation of gamma-aminobutyric acid secretion(GO:0014054) |
| 0.1 |
0.2 |
GO:0034729 |
histone H3-K79 methylation(GO:0034729) |
| 0.1 |
0.4 |
GO:1902990 |
mitotic telomere maintenance via semi-conservative replication(GO:1902990) |
| 0.1 |
0.6 |
GO:2001268 |
negative regulation of cysteine-type endopeptidase activity involved in apoptotic signaling pathway(GO:2001268) |
| 0.1 |
1.2 |
GO:0015884 |
folic acid transport(GO:0015884) |
| 0.1 |
0.1 |
GO:0070094 |
positive regulation of glucagon secretion(GO:0070094) |
| 0.1 |
0.8 |
GO:0070458 |
detoxification of nitrogen compound(GO:0051410) cellular detoxification of nitrogen compound(GO:0070458) |
| 0.1 |
0.3 |
GO:1903774 |
positive regulation of viral budding via host ESCRT complex(GO:1903774) |
| 0.1 |
0.7 |
GO:0048934 |
peripheral nervous system neuron differentiation(GO:0048934) peripheral nervous system neuron development(GO:0048935) |
| 0.1 |
0.2 |
GO:0002924 |
negative regulation of humoral immune response mediated by circulating immunoglobulin(GO:0002924) |
| 0.1 |
0.6 |
GO:1904936 |
cerebral cortex GABAergic interneuron migration(GO:0021853) interneuron migration(GO:1904936) |
| 0.1 |
0.6 |
GO:0021764 |
amygdala development(GO:0021764) |
| 0.1 |
0.4 |
GO:0033499 |
galactose catabolic process via UDP-galactose(GO:0033499) glycolytic process from galactose(GO:0061623) |
| 0.1 |
0.5 |
GO:0021797 |
forebrain anterior/posterior pattern specification(GO:0021797) |
| 0.1 |
0.2 |
GO:2000427 |
positive regulation of apoptotic cell clearance(GO:2000427) |
| 0.1 |
0.3 |
GO:0048739 |
cardiac muscle fiber development(GO:0048739) |
| 0.1 |
0.1 |
GO:1904177 |
regulation of adipose tissue development(GO:1904177) |
| 0.1 |
0.3 |
GO:0003199 |
endocardial cushion to mesenchymal transition involved in heart valve formation(GO:0003199) |
| 0.1 |
0.3 |
GO:1900127 |
positive regulation of hyaluronan biosynthetic process(GO:1900127) |
| 0.1 |
0.9 |
GO:0009181 |
purine nucleoside diphosphate catabolic process(GO:0009137) purine ribonucleoside diphosphate catabolic process(GO:0009181) |
| 0.1 |
0.3 |
GO:0046022 |
regulation of transcription from RNA polymerase II promoter, mitotic(GO:0046021) positive regulation of transcription from RNA polymerase II promoter during mitosis(GO:0046022) axial mesoderm morphogenesis(GO:0048319) |
| 0.1 |
0.4 |
GO:1904565 |
response to 1-oleoyl-sn-glycerol 3-phosphate(GO:1904565) cellular response to 1-oleoyl-sn-glycerol 3-phosphate(GO:1904566) |
| 0.1 |
0.4 |
GO:0090241 |
negative regulation of histone H4 acetylation(GO:0090241) |
| 0.1 |
0.3 |
GO:0002302 |
CD8-positive, alpha-beta T cell differentiation involved in immune response(GO:0002302) mesodermal to mesenchymal transition involved in gastrulation(GO:0060809) |
| 0.1 |
0.5 |
GO:0032298 |
positive regulation of DNA-dependent DNA replication initiation(GO:0032298) |
| 0.1 |
0.4 |
GO:0010756 |
regulation of plasminogen activation(GO:0010755) positive regulation of plasminogen activation(GO:0010756) |
| 0.1 |
0.3 |
GO:0060598 |
dichotomous subdivision of terminal units involved in mammary gland duct morphogenesis(GO:0060598) |
| 0.1 |
0.1 |
GO:0061043 |
regulation of vascular wound healing(GO:0061043) |
| 0.1 |
0.8 |
GO:0070234 |
positive regulation of T cell apoptotic process(GO:0070234) |
| 0.1 |
0.3 |
GO:0034162 |
toll-like receptor 9 signaling pathway(GO:0034162) |
| 0.1 |
0.2 |
GO:1903772 |
regulation of viral budding via host ESCRT complex(GO:1903772) |
| 0.1 |
0.4 |
GO:0060253 |
negative regulation of glial cell proliferation(GO:0060253) |
| 0.1 |
0.7 |
GO:0033567 |
DNA replication, Okazaki fragment processing(GO:0033567) |
| 0.1 |
0.3 |
GO:0042228 |
interleukin-8 biosynthetic process(GO:0042228) |
| 0.1 |
0.9 |
GO:0034472 |
snRNA 3'-end processing(GO:0034472) |
| 0.1 |
0.3 |
GO:0006348 |
chromatin silencing at telomere(GO:0006348) |
| 0.1 |
0.3 |
GO:0044778 |
meiotic DNA integrity checkpoint(GO:0044778) |
| 0.1 |
0.9 |
GO:0007271 |
synaptic transmission, cholinergic(GO:0007271) |
| 0.1 |
0.6 |
GO:0072513 |
positive regulation of secondary heart field cardioblast proliferation(GO:0072513) |
| 0.1 |
0.1 |
GO:0061074 |
regulation of neural retina development(GO:0061074) |
| 0.1 |
0.3 |
GO:0045091 |
regulation of single stranded viral RNA replication via double stranded DNA intermediate(GO:0045091) |
| 0.1 |
0.3 |
GO:0010248 |
B cell negative selection(GO:0002352) establishment or maintenance of transmembrane electrochemical gradient(GO:0010248) |
| 0.1 |
0.6 |
GO:0044375 |
regulation of peroxisome size(GO:0044375) |
| 0.1 |
0.3 |
GO:0000715 |
nucleotide-excision repair, DNA damage recognition(GO:0000715) |
| 0.1 |
0.2 |
GO:0060754 |
positive regulation of mast cell chemotaxis(GO:0060754) |
| 0.1 |
0.4 |
GO:0006545 |
glycine biosynthetic process(GO:0006545) |
| 0.1 |
0.7 |
GO:0016480 |
negative regulation of transcription from RNA polymerase III promoter(GO:0016480) |
| 0.1 |
0.5 |
GO:0000098 |
sulfur amino acid catabolic process(GO:0000098) |
| 0.1 |
0.7 |
GO:0006013 |
mannose metabolic process(GO:0006013) |
| 0.1 |
0.3 |
GO:1904996 |
positive regulation of leukocyte adhesion to vascular endothelial cell(GO:1904996) |
| 0.1 |
0.2 |
GO:0060741 |
prostate gland stromal morphogenesis(GO:0060741) |
| 0.1 |
0.9 |
GO:0007042 |
lysosomal lumen acidification(GO:0007042) |
| 0.1 |
0.4 |
GO:0042985 |
negative regulation of amyloid precursor protein biosynthetic process(GO:0042985) |
| 0.1 |
0.3 |
GO:0051582 |
positive regulation of neurotransmitter uptake(GO:0051582) positive regulation of dopamine uptake involved in synaptic transmission(GO:0051586) positive regulation of catecholamine uptake involved in synaptic transmission(GO:0051944) |
| 0.1 |
0.3 |
GO:1904274 |
tricellular tight junction assembly(GO:1904274) |
| 0.1 |
0.4 |
GO:0030576 |
Cajal body organization(GO:0030576) |
| 0.1 |
0.5 |
GO:0008625 |
extrinsic apoptotic signaling pathway via death domain receptors(GO:0008625) |
| 0.1 |
0.3 |
GO:0045819 |
positive regulation of glycogen catabolic process(GO:0045819) |
| 0.1 |
0.2 |
GO:0042663 |
regulation of endodermal cell fate specification(GO:0042663) |
| 0.1 |
0.4 |
GO:2000048 |
negative regulation of cell-cell adhesion mediated by cadherin(GO:2000048) |
| 0.1 |
1.3 |
GO:0019835 |
cytolysis(GO:0019835) |
| 0.1 |
0.6 |
GO:0006621 |
protein retention in ER lumen(GO:0006621) |
| 0.1 |
0.3 |
GO:0021894 |
cerebral cortex GABAergic interneuron development(GO:0021894) |
| 0.1 |
0.3 |
GO:1904879 |
positive regulation of calcium ion transmembrane transport via high voltage-gated calcium channel(GO:1904879) |
| 0.1 |
0.3 |
GO:0046415 |
urate metabolic process(GO:0046415) |
| 0.1 |
1.5 |
GO:0006516 |
glycoprotein catabolic process(GO:0006516) |
| 0.1 |
0.3 |
GO:2000587 |
regulation of platelet-derived growth factor receptor-beta signaling pathway(GO:2000586) negative regulation of platelet-derived growth factor receptor-beta signaling pathway(GO:2000587) |
| 0.1 |
0.5 |
GO:0045198 |
establishment of epithelial cell apical/basal polarity(GO:0045198) |
| 0.1 |
0.3 |
GO:0002667 |
lymphocyte anergy(GO:0002249) regulation of T cell anergy(GO:0002667) T cell anergy(GO:0002870) regulation of lymphocyte anergy(GO:0002911) |
| 0.1 |
0.3 |
GO:0072257 |
metanephric nephron tubule epithelial cell differentiation(GO:0072257) regulation of metanephric nephron tubule epithelial cell differentiation(GO:0072307) |
| 0.1 |
1.5 |
GO:0050995 |
negative regulation of lipid catabolic process(GO:0050995) |
| 0.1 |
0.3 |
GO:0071475 |
cellular hyperosmotic salinity response(GO:0071475) |
| 0.1 |
0.2 |
GO:0061036 |
positive regulation of cartilage development(GO:0061036) |
| 0.1 |
0.3 |
GO:0019230 |
proprioception(GO:0019230) sensory neuron axon guidance(GO:0097374) |
| 0.1 |
0.3 |
GO:0046645 |
positive regulation of gamma-delta T cell differentiation(GO:0045588) positive regulation of gamma-delta T cell activation(GO:0046645) |
| 0.1 |
0.3 |
GO:0032804 |
negative regulation of low-density lipoprotein particle receptor catabolic process(GO:0032804) |
| 0.1 |
0.3 |
GO:0060923 |
cardiac muscle cell fate commitment(GO:0060923) |
| 0.1 |
0.2 |
GO:0060686 |
negative regulation of prostatic bud formation(GO:0060686) |
| 0.1 |
0.1 |
GO:0002566 |
somatic diversification of immune receptors via somatic mutation(GO:0002566) somatic hypermutation of immunoglobulin genes(GO:0016446) |
| 0.1 |
0.8 |
GO:0036159 |
inner dynein arm assembly(GO:0036159) |
| 0.1 |
0.4 |
GO:0006287 |
base-excision repair, gap-filling(GO:0006287) |
| 0.1 |
0.3 |
GO:0031581 |
hemidesmosome assembly(GO:0031581) |
| 0.1 |
0.7 |
GO:0061299 |
retina vasculature morphogenesis in camera-type eye(GO:0061299) |
| 0.1 |
0.3 |
GO:2000346 |
negative regulation of hepatocyte proliferation(GO:2000346) |
| 0.1 |
1.8 |
GO:0008299 |
isoprenoid biosynthetic process(GO:0008299) |
| 0.1 |
0.1 |
GO:0018916 |
nitrobenzene metabolic process(GO:0018916) |
| 0.1 |
0.4 |
GO:0018002 |
N-terminal peptidyl-serine acetylation(GO:0017198) N-terminal peptidyl-glutamic acid acetylation(GO:0018002) peptidyl-serine acetylation(GO:0030920) |
| 0.1 |
0.2 |
GO:2000983 |
regulation of ATP citrate synthase activity(GO:2000983) negative regulation of ATP citrate synthase activity(GO:2000984) |
| 0.1 |
0.3 |
GO:1903026 |
negative regulation of RNA polymerase II regulatory region sequence-specific DNA binding(GO:1903026) positive regulation of oxidative stress-induced neuron intrinsic apoptotic signaling pathway(GO:1903378) |
| 0.1 |
0.4 |
GO:0010759 |
positive regulation of macrophage chemotaxis(GO:0010759) |
| 0.1 |
2.7 |
GO:0030199 |
collagen fibril organization(GO:0030199) |
| 0.1 |
0.3 |
GO:0032788 |
saturated monocarboxylic acid metabolic process(GO:0032788) unsaturated monocarboxylic acid metabolic process(GO:0032789) |
| 0.1 |
1.1 |
GO:0006388 |
tRNA splicing, via endonucleolytic cleavage and ligation(GO:0006388) |
| 0.1 |
0.2 |
GO:2000170 |
positive regulation of peptidyl-cysteine S-nitrosylation(GO:2000170) |
| 0.1 |
0.7 |
GO:0042760 |
very long-chain fatty acid catabolic process(GO:0042760) |
| 0.1 |
0.4 |
GO:0019243 |
methylglyoxal catabolic process to D-lactate via S-lactoyl-glutathione(GO:0019243) methylglyoxal catabolic process(GO:0051596) methylglyoxal catabolic process to lactate(GO:0061727) |
| 0.1 |
1.1 |
GO:0045792 |
negative regulation of cell size(GO:0045792) |
| 0.1 |
0.4 |
GO:2000987 |
positive regulation of fear response(GO:1903367) positive regulation of behavioral fear response(GO:2000987) |
| 0.1 |
0.8 |
GO:0034498 |
early endosome to Golgi transport(GO:0034498) |
| 0.1 |
0.2 |
GO:0043181 |
vacuolar sequestering(GO:0043181) |
| 0.1 |
0.1 |
GO:2000416 |
regulation of eosinophil migration(GO:2000416) positive regulation of eosinophil migration(GO:2000418) |
| 0.1 |
0.1 |
GO:0050862 |
positive regulation of T cell receptor signaling pathway(GO:0050862) |
| 0.1 |
0.3 |
GO:0071220 |
response to bacterial lipopeptide(GO:0070339) cellular response to bacterial lipoprotein(GO:0071220) cellular response to bacterial lipopeptide(GO:0071221) response to diacyl bacterial lipopeptide(GO:0071724) cellular response to diacyl bacterial lipopeptide(GO:0071726) |
| 0.1 |
1.5 |
GO:0030212 |
hyaluronan metabolic process(GO:0030212) |
| 0.1 |
0.1 |
GO:0006059 |
hexitol metabolic process(GO:0006059) |
| 0.1 |
0.6 |
GO:2000194 |
regulation of female gonad development(GO:2000194) |
| 0.1 |
0.7 |
GO:0045040 |
protein import into mitochondrial outer membrane(GO:0045040) |
| 0.1 |
0.7 |
GO:0030388 |
fructose 1,6-bisphosphate metabolic process(GO:0030388) |
| 0.1 |
0.6 |
GO:0090527 |
actin filament reorganization(GO:0090527) |
| 0.1 |
1.6 |
GO:0000028 |
ribosomal small subunit assembly(GO:0000028) |
| 0.1 |
0.5 |
GO:0035188 |
blastocyst hatching(GO:0001835) hatching(GO:0035188) organism emergence from protective structure(GO:0071684) |
| 0.1 |
0.5 |
GO:2001214 |
positive regulation of vasculogenesis(GO:2001214) |
| 0.1 |
0.4 |
GO:0043415 |
positive regulation of skeletal muscle tissue regeneration(GO:0043415) |
| 0.1 |
0.3 |
GO:0006624 |
vacuolar protein processing(GO:0006624) |
| 0.1 |
0.2 |
GO:0042822 |
vitamin B6 metabolic process(GO:0042816) pyridoxal phosphate metabolic process(GO:0042822) pyridoxal phosphate biosynthetic process(GO:0042823) |
| 0.1 |
0.2 |
GO:0051031 |
tRNA transport(GO:0051031) |
| 0.1 |
0.6 |
GO:0060665 |
regulation of branching involved in salivary gland morphogenesis by mesenchymal-epithelial signaling(GO:0060665) |
| 0.1 |
0.3 |
GO:0050678 |
regulation of epithelial cell proliferation(GO:0050678) |
| 0.1 |
0.1 |
GO:0035519 |
protein K29-linked ubiquitination(GO:0035519) |
| 0.1 |
0.1 |
GO:0006566 |
threonine metabolic process(GO:0006566) |
| 0.1 |
0.2 |
GO:0050915 |
sensory perception of sour taste(GO:0050915) |
| 0.1 |
0.2 |
GO:0048597 |
post-embryonic camera-type eye morphogenesis(GO:0048597) |
| 0.1 |
0.5 |
GO:0030432 |
peristalsis(GO:0030432) |
| 0.1 |
0.5 |
GO:0006729 |
tetrahydrobiopterin biosynthetic process(GO:0006729) tetrahydrobiopterin metabolic process(GO:0046146) |
| 0.1 |
0.2 |
GO:0019074 |
viral genome packaging(GO:0019072) viral RNA genome packaging(GO:0019074) |
| 0.1 |
0.2 |
GO:2000348 |
regulation of CD40 signaling pathway(GO:2000348) |
| 0.1 |
0.2 |
GO:0006268 |
DNA unwinding involved in DNA replication(GO:0006268) |
| 0.1 |
0.1 |
GO:0000320 |
re-entry into mitotic cell cycle(GO:0000320) |
| 0.1 |
0.2 |
GO:2000569 |
T-helper 2 cell activation(GO:0035712) positive regulation of T-helper 17 type immune response(GO:2000318) regulation of T-helper 2 cell activation(GO:2000569) positive regulation of T-helper 2 cell activation(GO:2000570) |
| 0.1 |
0.2 |
GO:1904742 |
regulation of telomeric DNA binding(GO:1904742) |
| 0.1 |
0.3 |
GO:0015786 |
UDP-glucose transport(GO:0015786) |
| 0.1 |
0.3 |
GO:0031915 |
positive regulation of synaptic plasticity(GO:0031915) |
| 0.1 |
0.8 |
GO:0022027 |
interkinetic nuclear migration(GO:0022027) |
| 0.1 |
0.3 |
GO:1900170 |
negative regulation of glucocorticoid mediated signaling pathway(GO:1900170) |
| 0.1 |
0.3 |
GO:1990928 |
response to amino acid starvation(GO:1990928) |
| 0.1 |
0.2 |
GO:0008612 |
peptidyl-lysine modification to peptidyl-hypusine(GO:0008612) |
| 0.1 |
0.3 |
GO:0070829 |
heterochromatin maintenance(GO:0070829) |
| 0.1 |
0.1 |
GO:0042074 |
cell migration involved in gastrulation(GO:0042074) |
| 0.1 |
0.2 |
GO:0051315 |
attachment of mitotic spindle microtubules to kinetochore(GO:0051315) |
| 0.1 |
0.3 |
GO:0071404 |
cellular response to lipoprotein particle stimulus(GO:0071402) cellular response to low-density lipoprotein particle stimulus(GO:0071404) |
| 0.1 |
0.4 |
GO:0035360 |
positive regulation of peroxisome proliferator activated receptor signaling pathway(GO:0035360) |
| 0.1 |
0.1 |
GO:0046985 |
positive regulation of hemoglobin biosynthetic process(GO:0046985) |
| 0.1 |
0.2 |
GO:0032513 |
negative regulation of protein phosphatase type 2B activity(GO:0032513) |
| 0.1 |
0.6 |
GO:0043101 |
purine-containing compound salvage(GO:0043101) |
| 0.1 |
0.1 |
GO:0042730 |
fibrinolysis(GO:0042730) |
| 0.1 |
0.1 |
GO:0006356 |
regulation of transcription from RNA polymerase I promoter(GO:0006356) |
| 0.1 |
0.2 |
GO:0015705 |
iodide transport(GO:0015705) |
| 0.1 |
0.4 |
GO:1902969 |
mitotic DNA replication(GO:1902969) |
| 0.1 |
0.2 |
GO:0000447 |
endonucleolytic cleavage in ITS1 to separate SSU-rRNA from 5.8S rRNA and LSU-rRNA from tricistronic rRNA transcript (SSU-rRNA, 5.8S rRNA, LSU-rRNA)(GO:0000447) |
| 0.1 |
0.7 |
GO:0071257 |
cellular response to electrical stimulus(GO:0071257) |
| 0.1 |
0.1 |
GO:0060586 |
multicellular organismal iron ion homeostasis(GO:0060586) |
| 0.1 |
0.4 |
GO:0034227 |
tRNA thio-modification(GO:0034227) |
| 0.1 |
0.3 |
GO:0032836 |
glomerular basement membrane development(GO:0032836) |
| 0.1 |
0.4 |
GO:0097460 |
ferrous iron import(GO:0070627) ferrous iron import into cell(GO:0097460) |
| 0.1 |
0.5 |
GO:0045651 |
positive regulation of macrophage differentiation(GO:0045651) |
| 0.1 |
0.2 |
GO:0015938 |
coenzyme A catabolic process(GO:0015938) nucleoside bisphosphate catabolic process(GO:0033869) ribonucleoside bisphosphate catabolic process(GO:0034031) purine nucleoside bisphosphate catabolic process(GO:0034034) |
| 0.1 |
0.3 |
GO:0042167 |
heme catabolic process(GO:0042167) pigment catabolic process(GO:0046149) |
| 0.1 |
0.3 |
GO:0006451 |
selenocysteine incorporation(GO:0001514) translational readthrough(GO:0006451) |
| 0.1 |
0.1 |
GO:0003273 |
cell migration involved in endocardial cushion formation(GO:0003273) |
| 0.1 |
0.2 |
GO:2000781 |
positive regulation of double-strand break repair(GO:2000781) |
| 0.1 |
0.5 |
GO:0042346 |
positive regulation of NF-kappaB import into nucleus(GO:0042346) |
| 0.1 |
0.1 |
GO:0014873 |
response to muscle activity involved in regulation of muscle adaptation(GO:0014873) |
| 0.1 |
0.2 |
GO:0001866 |
NK T cell proliferation(GO:0001866) |
| 0.1 |
0.2 |
GO:0031990 |
mRNA export from nucleus in response to heat stress(GO:0031990) |
| 0.1 |
0.9 |
GO:0051988 |
regulation of attachment of spindle microtubules to kinetochore(GO:0051988) |
| 0.1 |
0.2 |
GO:0070317 |
negative regulation of G0 to G1 transition(GO:0070317) |
| 0.1 |
0.2 |
GO:0045602 |
negative regulation of endothelial cell differentiation(GO:0045602) |
| 0.1 |
0.5 |
GO:0090050 |
positive regulation of cell migration involved in sprouting angiogenesis(GO:0090050) |
| 0.1 |
0.2 |
GO:0006533 |
aspartate catabolic process(GO:0006533) D-amino acid catabolic process(GO:0019478) |
| 0.1 |
2.1 |
GO:0010595 |
positive regulation of endothelial cell migration(GO:0010595) |
| 0.1 |
0.3 |
GO:0021914 |
negative regulation of smoothened signaling pathway involved in ventral spinal cord patterning(GO:0021914) |
| 0.1 |
0.6 |
GO:0003085 |
negative regulation of systemic arterial blood pressure(GO:0003085) |
| 0.1 |
0.3 |
GO:0002862 |
negative regulation of inflammatory response to antigenic stimulus(GO:0002862) |
| 0.1 |
0.1 |
GO:0046110 |
xanthine metabolic process(GO:0046110) |
| 0.1 |
0.1 |
GO:0090286 |
cytoskeletal anchoring at nuclear membrane(GO:0090286) |
| 0.1 |
1.4 |
GO:0006270 |
DNA replication initiation(GO:0006270) |
| 0.1 |
0.3 |
GO:0051045 |
negative regulation of membrane protein ectodomain proteolysis(GO:0051045) |
| 0.1 |
0.5 |
GO:0033603 |
positive regulation of dopamine secretion(GO:0033603) |
| 0.1 |
0.8 |
GO:0098869 |
cellular oxidant detoxification(GO:0098869) cellular detoxification(GO:1990748) |
| 0.1 |
0.1 |
GO:0060672 |
epithelial cell differentiation involved in embryonic placenta development(GO:0060671) epithelial cell morphogenesis involved in placental branching(GO:0060672) |
| 0.1 |
0.8 |
GO:0070935 |
3'-UTR-mediated mRNA stabilization(GO:0070935) |
| 0.1 |
1.3 |
GO:0034198 |
cellular response to amino acid starvation(GO:0034198) |
| 0.1 |
1.1 |
GO:0010569 |
regulation of double-strand break repair via homologous recombination(GO:0010569) |
| 0.1 |
0.4 |
GO:0000103 |
sulfate assimilation(GO:0000103) |
| 0.1 |
0.1 |
GO:0046322 |
negative regulation of fatty acid oxidation(GO:0046322) |
| 0.1 |
0.4 |
GO:0019532 |
oxalate transport(GO:0019532) |
| 0.1 |
0.1 |
GO:1990481 |
mRNA pseudouridine synthesis(GO:1990481) |
| 0.1 |
0.1 |
GO:0014735 |
regulation of muscle atrophy(GO:0014735) |
| 0.1 |
0.1 |
GO:0045603 |
positive regulation of endothelial cell differentiation(GO:0045603) |
| 0.1 |
0.3 |
GO:2000680 |
regulation of rubidium ion transport(GO:2000680) |
| 0.1 |
0.2 |
GO:1905098 |
negative regulation of guanyl-nucleotide exchange factor activity(GO:1905098) |
| 0.1 |
0.1 |
GO:0002572 |
pro-T cell differentiation(GO:0002572) |
| 0.1 |
0.2 |
GO:0046959 |
habituation(GO:0046959) |
| 0.1 |
1.3 |
GO:0009409 |
response to cold(GO:0009409) |
| 0.1 |
0.3 |
GO:0030951 |
establishment or maintenance of microtubule cytoskeleton polarity(GO:0030951) |
| 0.1 |
0.3 |
GO:0044829 |
positive regulation by host of viral genome replication(GO:0044829) |
| 0.1 |
0.2 |
GO:0045039 |
protein import into mitochondrial inner membrane(GO:0045039) |
| 0.1 |
0.1 |
GO:0045583 |
regulation of cytotoxic T cell differentiation(GO:0045583) positive regulation of cytotoxic T cell differentiation(GO:0045585) |
| 0.1 |
1.2 |
GO:0033235 |
positive regulation of protein sumoylation(GO:0033235) |
| 0.1 |
0.6 |
GO:0032287 |
peripheral nervous system myelin maintenance(GO:0032287) |
| 0.1 |
0.4 |
GO:0002072 |
optic cup morphogenesis involved in camera-type eye development(GO:0002072) |
| 0.1 |
0.1 |
GO:1900158 |
regulation of bone mineralization involved in bone maturation(GO:1900157) negative regulation of bone mineralization involved in bone maturation(GO:1900158) |
| 0.1 |
0.5 |
GO:1902459 |
positive regulation of stem cell population maintenance(GO:1902459) |
| 0.1 |
0.2 |
GO:0032929 |
negative regulation of superoxide anion generation(GO:0032929) |
| 0.1 |
0.3 |
GO:2000210 |
positive regulation of anoikis(GO:2000210) |
| 0.0 |
0.2 |
GO:0070589 |
cell wall mannoprotein biosynthetic process(GO:0000032) mannoprotein metabolic process(GO:0006056) mannoprotein biosynthetic process(GO:0006057) cell wall glycoprotein biosynthetic process(GO:0031506) cell wall biogenesis(GO:0042546) cell wall macromolecule metabolic process(GO:0044036) cell wall macromolecule biosynthetic process(GO:0044038) chain elongation of O-linked mannose residue(GO:0044845) cellular component macromolecule biosynthetic process(GO:0070589) cell wall organization or biogenesis(GO:0071554) |
| 0.0 |
0.2 |
GO:0045002 |
double-strand break repair via single-strand annealing(GO:0045002) |
| 0.0 |
0.6 |
GO:0032060 |
bleb assembly(GO:0032060) |
| 0.0 |
0.2 |
GO:0009227 |
UDP-N-acetylglucosamine catabolic process(GO:0006049) nucleotide-sugar catabolic process(GO:0009227) |
| 0.0 |
0.3 |
GO:0050853 |
B cell receptor signaling pathway(GO:0050853) |
| 0.0 |
0.1 |
GO:0006001 |
fructose catabolic process(GO:0006001) fructose catabolic process to hydroxyacetone phosphate and glyceraldehyde-3-phosphate(GO:0061624) glycolytic process through fructose-1-phosphate(GO:0061625) |
| 0.0 |
0.2 |
GO:1901341 |
activation of store-operated calcium channel activity(GO:0032237) positive regulation of store-operated calcium channel activity(GO:1901341) |
| 0.0 |
0.1 |
GO:0019676 |
ammonia assimilation cycle(GO:0019676) |
| 0.0 |
0.1 |
GO:0035609 |
C-terminal protein deglutamylation(GO:0035609) |
| 0.0 |
1.6 |
GO:0048821 |
erythrocyte development(GO:0048821) |
| 0.0 |
1.3 |
GO:0045746 |
negative regulation of Notch signaling pathway(GO:0045746) |
| 0.0 |
0.3 |
GO:0042511 |
positive regulation of tyrosine phosphorylation of Stat1 protein(GO:0042511) |
| 0.0 |
0.1 |
GO:0061365 |
positive regulation of triglyceride lipase activity(GO:0061365) |
| 0.0 |
0.7 |
GO:0006465 |
signal peptide processing(GO:0006465) |
| 0.0 |
0.0 |
GO:0015864 |
pyrimidine nucleoside transport(GO:0015864) |
| 0.0 |
0.2 |
GO:0070235 |
regulation of activation-induced cell death of T cells(GO:0070235) |
| 0.0 |
0.1 |
GO:0048308 |
organelle inheritance(GO:0048308) Golgi inheritance(GO:0048313) |
| 0.0 |
0.3 |
GO:0006452 |
translational frameshifting(GO:0006452) positive regulation of translational termination(GO:0045905) |
| 0.0 |
0.2 |
GO:0007406 |
negative regulation of neuroblast proliferation(GO:0007406) |
| 0.0 |
0.6 |
GO:0042347 |
negative regulation of NF-kappaB import into nucleus(GO:0042347) |
| 0.0 |
0.1 |
GO:2000630 |
positive regulation of miRNA metabolic process(GO:2000630) |
| 0.0 |
0.2 |
GO:1903867 |
chorion development(GO:0060717) extraembryonic membrane development(GO:1903867) |
| 0.0 |
0.1 |
GO:0045448 |
regulation of mitotic cell cycle, embryonic(GO:0009794) mitotic cell cycle, embryonic(GO:0045448) |
| 0.0 |
0.1 |
GO:0045617 |
negative regulation of keratinocyte differentiation(GO:0045617) |
| 0.0 |
0.1 |
GO:0040016 |
embryonic cleavage(GO:0040016) |
| 0.0 |
0.2 |
GO:0006002 |
fructose 6-phosphate metabolic process(GO:0006002) |
| 0.0 |
0.0 |
GO:0046878 |
regulation of saliva secretion(GO:0046877) positive regulation of saliva secretion(GO:0046878) |
| 0.0 |
0.7 |
GO:0021924 |
cell proliferation in hindbrain(GO:0021534) cell proliferation in external granule layer(GO:0021924) cerebellar granule cell precursor proliferation(GO:0021930) |
| 0.0 |
0.5 |
GO:0072010 |
renal filtration cell differentiation(GO:0061318) glomerular epithelium development(GO:0072010) glomerular visceral epithelial cell differentiation(GO:0072112) glomerular epithelial cell differentiation(GO:0072311) |
| 0.0 |
0.6 |
GO:0060134 |
prepulse inhibition(GO:0060134) |
| 0.0 |
0.5 |
GO:0010574 |
regulation of vascular endothelial growth factor production(GO:0010574) |
| 0.0 |
0.8 |
GO:0010866 |
regulation of triglyceride biosynthetic process(GO:0010866) |
| 0.0 |
0.3 |
GO:0033089 |
positive regulation of T cell differentiation in thymus(GO:0033089) positive regulation of thymocyte aggregation(GO:2000400) |
| 0.0 |
0.3 |
GO:0070286 |
axonemal dynein complex assembly(GO:0070286) |
| 0.0 |
0.2 |
GO:0035372 |
protein localization to microtubule(GO:0035372) |
| 0.0 |
0.1 |
GO:0071260 |
cellular response to mechanical stimulus(GO:0071260) |
| 0.0 |
0.8 |
GO:1903020 |
positive regulation of glycoprotein metabolic process(GO:1903020) |
| 0.0 |
1.7 |
GO:0006749 |
glutathione metabolic process(GO:0006749) |
| 0.0 |
0.3 |
GO:0001516 |
prostaglandin biosynthetic process(GO:0001516) prostanoid biosynthetic process(GO:0046457) |
| 0.0 |
0.3 |
GO:0046102 |
inosine metabolic process(GO:0046102) |
| 0.0 |
0.1 |
GO:0043696 |
dedifferentiation(GO:0043696) cell dedifferentiation(GO:0043697) |
| 0.0 |
0.2 |
GO:0019509 |
L-methionine biosynthetic process from methylthioadenosine(GO:0019509) |
| 0.0 |
0.2 |
GO:2000491 |
positive regulation of hepatic stellate cell activation(GO:2000491) |
| 0.0 |
0.2 |
GO:0010519 |
negative regulation of phospholipase activity(GO:0010519) |
| 0.0 |
0.1 |
GO:0008535 |
respiratory chain complex IV assembly(GO:0008535) |
| 0.0 |
0.1 |
GO:1900186 |
negative regulation of clathrin-mediated endocytosis(GO:1900186) |
| 0.0 |
0.5 |
GO:0001779 |
natural killer cell differentiation(GO:0001779) |
| 0.0 |
0.5 |
GO:1904407 |
positive regulation of nitric oxide biosynthetic process(GO:0045429) positive regulation of nitric oxide metabolic process(GO:1904407) |
| 0.0 |
0.2 |
GO:0016557 |
peroxisome membrane biogenesis(GO:0016557) |
| 0.0 |
0.2 |
GO:0042256 |
mature ribosome assembly(GO:0042256) |
| 0.0 |
0.2 |
GO:0010694 |
positive regulation of alkaline phosphatase activity(GO:0010694) |
| 0.0 |
0.3 |
GO:0032464 |
positive regulation of protein homooligomerization(GO:0032464) |
| 0.0 |
0.1 |
GO:0035793 |
regulation of phosphatidylinositol biosynthetic process(GO:0010511) negative regulation of phosphatidylinositol biosynthetic process(GO:0010512) cell migration involved in metanephros development(GO:0035788) metanephric mesenchymal cell migration(GO:0035789) positive regulation of metanephric mesenchymal cell migration by platelet-derived growth factor receptor-beta signaling pathway(GO:0035793) regulation of metanephric mesenchymal cell migration by platelet-derived growth factor receptor-beta signaling pathway(GO:1900238) regulation of metanephric mesenchymal cell migration(GO:2000589) positive regulation of metanephric mesenchymal cell migration(GO:2000591) |
| 0.0 |
0.1 |
GO:0061418 |
regulation of transcription from RNA polymerase II promoter in response to hypoxia(GO:0061418) |
| 0.0 |
0.6 |
GO:0007194 |
negative regulation of adenylate cyclase activity(GO:0007194) |
| 0.0 |
0.4 |
GO:0051894 |
positive regulation of focal adhesion assembly(GO:0051894) |
| 0.0 |
0.1 |
GO:0009223 |
pyrimidine deoxyribonucleotide catabolic process(GO:0009223) |
| 0.0 |
0.4 |
GO:0010388 |
cullin deneddylation(GO:0010388) |
| 0.0 |
0.1 |
GO:0009068 |
aspartate family amino acid catabolic process(GO:0009068) |
| 0.0 |
0.9 |
GO:0002474 |
antigen processing and presentation of peptide antigen via MHC class I(GO:0002474) |
| 0.0 |
0.2 |
GO:0006780 |
uroporphyrinogen III biosynthetic process(GO:0006780) |
| 0.0 |
1.8 |
GO:0019882 |
antigen processing and presentation(GO:0019882) |
| 0.0 |
0.2 |
GO:0000097 |
sulfur amino acid biosynthetic process(GO:0000097) |
| 0.0 |
0.2 |
GO:0098903 |
regulation of membrane repolarization during action potential(GO:0098903) |
| 0.0 |
0.5 |
GO:0006614 |
SRP-dependent cotranslational protein targeting to membrane(GO:0006614) |
| 0.0 |
0.1 |
GO:0035791 |
platelet-derived growth factor receptor-beta signaling pathway(GO:0035791) |
| 0.0 |
0.7 |
GO:0099517 |
anterograde synaptic vesicle transport(GO:0048490) synaptic vesicle cytoskeletal transport(GO:0099514) synaptic vesicle transport along microtubule(GO:0099517) |
| 0.0 |
0.4 |
GO:2000480 |
negative regulation of cAMP-dependent protein kinase activity(GO:2000480) |
| 0.0 |
0.2 |
GO:0033314 |
mitotic DNA replication checkpoint(GO:0033314) |
| 0.0 |
0.1 |
GO:0042726 |
flavin-containing compound metabolic process(GO:0042726) |
| 0.0 |
0.6 |
GO:0045824 |
negative regulation of innate immune response(GO:0045824) |
| 0.0 |
0.1 |
GO:0050689 |
negative regulation of interferon-beta biosynthetic process(GO:0045358) negative regulation of defense response to virus by host(GO:0050689) |
| 0.0 |
0.2 |
GO:0032049 |
cardiolipin biosynthetic process(GO:0032049) |
| 0.0 |
0.1 |
GO:1904211 |
membrane protein proteolysis involved in retrograde protein transport, ER to cytosol(GO:1904211) |
| 0.0 |
0.1 |
GO:0051967 |
negative regulation of synaptic transmission, glutamatergic(GO:0051967) |
| 0.0 |
0.2 |
GO:0001834 |
trophectodermal cell proliferation(GO:0001834) |
| 0.0 |
0.3 |
GO:0002673 |
regulation of acute inflammatory response(GO:0002673) |
| 0.0 |
0.4 |
GO:0001731 |
formation of translation preinitiation complex(GO:0001731) |
| 0.0 |
0.6 |
GO:1901522 |
positive regulation of transcription from RNA polymerase II promoter involved in cellular response to chemical stimulus(GO:1901522) |
| 0.0 |
0.3 |
GO:1902231 |
positive regulation of intrinsic apoptotic signaling pathway in response to DNA damage(GO:1902231) |
| 0.0 |
0.1 |
GO:0033159 |
negative regulation of protein import into nucleus, translocation(GO:0033159) |
| 0.0 |
0.1 |
GO:0042796 |
snRNA transcription from RNA polymerase III promoter(GO:0042796) |
| 0.0 |
0.1 |
GO:0014046 |
dopamine secretion(GO:0014046) regulation of dopamine secretion(GO:0014059) |
| 0.0 |
0.1 |
GO:0006842 |
tricarboxylic acid transport(GO:0006842) succinate transport(GO:0015744) citrate transport(GO:0015746) |
| 0.0 |
0.6 |
GO:0032981 |
NADH dehydrogenase complex assembly(GO:0010257) mitochondrial respiratory chain complex I assembly(GO:0032981) mitochondrial respiratory chain complex I biogenesis(GO:0097031) |
| 0.0 |
0.1 |
GO:0030223 |
neutrophil differentiation(GO:0030223) |
| 0.0 |
0.4 |
GO:0006120 |
mitochondrial electron transport, NADH to ubiquinone(GO:0006120) |
| 0.0 |
0.2 |
GO:0007089 |
traversing start control point of mitotic cell cycle(GO:0007089) |
| 0.0 |
1.0 |
GO:0000027 |
ribosomal large subunit assembly(GO:0000027) |
| 0.0 |
1.7 |
GO:0006754 |
ATP biosynthetic process(GO:0006754) |
| 0.0 |
0.1 |
GO:0043117 |
positive regulation of vascular permeability(GO:0043117) |
| 0.0 |
0.2 |
GO:0009142 |
nucleoside triphosphate biosynthetic process(GO:0009142) |
| 0.0 |
0.1 |
GO:0072344 |
rescue of stalled ribosome(GO:0072344) |
| 0.0 |
0.4 |
GO:0000244 |
spliceosomal tri-snRNP complex assembly(GO:0000244) |
| 0.0 |
0.1 |
GO:0006953 |
acute-phase response(GO:0006953) |
| 0.0 |
0.4 |
GO:0001893 |
maternal placenta development(GO:0001893) |
| 0.0 |
0.1 |
GO:0006968 |
cellular defense response(GO:0006968) |
| 0.0 |
0.5 |
GO:0045662 |
negative regulation of myoblast differentiation(GO:0045662) |
| 0.0 |
0.1 |
GO:0006549 |
isoleucine metabolic process(GO:0006549) |
| 0.0 |
0.1 |
GO:1902268 |
negative regulation of polyamine transmembrane transport(GO:1902268) |
| 0.0 |
0.4 |
GO:0006744 |
ubiquinone metabolic process(GO:0006743) ubiquinone biosynthetic process(GO:0006744) quinone biosynthetic process(GO:1901663) |
| 0.0 |
0.0 |
GO:0010039 |
response to iron ion(GO:0010039) |
| 0.0 |
0.4 |
GO:0097034 |
mitochondrial respiratory chain complex IV assembly(GO:0033617) mitochondrial respiratory chain complex IV biogenesis(GO:0097034) |
| 0.0 |
0.2 |
GO:0035767 |
endothelial cell chemotaxis(GO:0035767) |
| 0.0 |
0.3 |
GO:0048672 |
positive regulation of collateral sprouting(GO:0048672) |
| 0.0 |
0.1 |
GO:0043388 |
positive regulation of DNA binding(GO:0043388) |
| 0.0 |
0.3 |
GO:1900107 |
regulation of nodal signaling pathway(GO:1900107) |
| 0.0 |
0.4 |
GO:0048240 |
sperm capacitation(GO:0048240) |
| 0.0 |
0.2 |
GO:0015812 |
gamma-aminobutyric acid transport(GO:0015812) |
| 0.0 |
0.1 |
GO:0006432 |
phenylalanyl-tRNA aminoacylation(GO:0006432) |
| 0.0 |
0.3 |
GO:0008608 |
attachment of spindle microtubules to kinetochore(GO:0008608) |
| 0.0 |
0.1 |
GO:0018343 |
protein farnesylation(GO:0018343) |
| 0.0 |
0.3 |
GO:0035092 |
sperm chromatin condensation(GO:0035092) |
| 0.0 |
0.4 |
GO:0035414 |
negative regulation of catenin import into nucleus(GO:0035414) |
| 0.0 |
0.1 |
GO:0014835 |
myoblast differentiation involved in skeletal muscle regeneration(GO:0014835) |
| 0.0 |
0.1 |
GO:0036066 |
protein O-linked fucosylation(GO:0036066) |
| 0.0 |
0.0 |
GO:1901187 |
regulation of ephrin receptor signaling pathway(GO:1901187) |
| 0.0 |
0.1 |
GO:0021523 |
somatic motor neuron differentiation(GO:0021523) |
| 0.0 |
0.2 |
GO:0006105 |
succinate metabolic process(GO:0006105) |
| 0.0 |
0.2 |
GO:2000672 |
negative regulation of motor neuron apoptotic process(GO:2000672) |
| 0.0 |
0.0 |
GO:1903546 |
protein localization to photoreceptor outer segment(GO:1903546) |
| 0.0 |
0.2 |
GO:0061032 |
visceral serous pericardium development(GO:0061032) |
| 0.0 |
0.2 |
GO:0015868 |
purine ribonucleotide transport(GO:0015868) |
| 0.0 |
0.1 |
GO:0046294 |
formaldehyde catabolic process(GO:0046294) |
| 0.0 |
0.2 |
GO:0032485 |
regulation of Ral protein signal transduction(GO:0032485) |
| 0.0 |
0.1 |
GO:0010464 |
regulation of mesenchymal cell proliferation(GO:0010464) |
| 0.0 |
0.4 |
GO:0001945 |
lymph vessel development(GO:0001945) |
| 0.0 |
0.1 |
GO:0016561 |
protein import into peroxisome matrix, translocation(GO:0016561) |
| 0.0 |
0.1 |
GO:0075525 |
viral translational termination-reinitiation(GO:0075525) |
| 0.0 |
0.2 |
GO:0002063 |
chondrocyte development(GO:0002063) |
| 0.0 |
0.3 |
GO:0006183 |
GTP biosynthetic process(GO:0006183) |
| 0.0 |
1.1 |
GO:0051310 |
metaphase plate congression(GO:0051310) |
| 0.0 |
0.1 |
GO:1901727 |
positive regulation of histone deacetylase activity(GO:1901727) |
| 0.0 |
0.1 |
GO:0046061 |
dATP catabolic process(GO:0046061) |
| 0.0 |
0.4 |
GO:2000009 |
negative regulation of protein localization to cell surface(GO:2000009) |
| 0.0 |
0.1 |
GO:0032463 |
negative regulation of protein homooligomerization(GO:0032463) |
| 0.0 |
0.2 |
GO:0031282 |
regulation of guanylate cyclase activity(GO:0031282) |
| 0.0 |
0.3 |
GO:0001886 |
endothelial cell morphogenesis(GO:0001886) |
| 0.0 |
0.2 |
GO:1900745 |
positive regulation of p38MAPK cascade(GO:1900745) |
| 0.0 |
0.1 |
GO:0035751 |
regulation of lysosomal lumen pH(GO:0035751) |
| 0.0 |
0.1 |
GO:0006931 |
substrate-dependent cell migration, cell attachment to substrate(GO:0006931) |
| 0.0 |
0.2 |
GO:0030224 |
monocyte differentiation(GO:0030224) |
| 0.0 |
0.1 |
GO:0006071 |
glycerol metabolic process(GO:0006071) |
| 0.0 |
0.2 |
GO:0032534 |
regulation of microvillus assembly(GO:0032534) |
| 0.0 |
0.1 |
GO:0015888 |
thiamine transport(GO:0015888) |
| 0.0 |
0.2 |
GO:2001223 |
negative regulation of neuron migration(GO:2001223) |
| 0.0 |
0.2 |
GO:0016255 |
attachment of GPI anchor to protein(GO:0016255) |
| 0.0 |
0.2 |
GO:0048678 |
response to axon injury(GO:0048678) |
| 0.0 |
0.8 |
GO:0009880 |
embryonic pattern specification(GO:0009880) |
| 0.0 |
0.2 |
GO:0071354 |
response to interleukin-6(GO:0070741) cellular response to interleukin-6(GO:0071354) |
| 0.0 |
0.1 |
GO:0035999 |
tetrahydrofolate interconversion(GO:0035999) |
| 0.0 |
0.3 |
GO:0043552 |
positive regulation of phosphatidylinositol 3-kinase activity(GO:0043552) |
| 0.0 |
0.4 |
GO:0042775 |
mitochondrial ATP synthesis coupled electron transport(GO:0042775) |
| 0.0 |
0.4 |
GO:0009312 |
oligosaccharide biosynthetic process(GO:0009312) |
| 0.0 |
0.6 |
GO:0000038 |
very long-chain fatty acid metabolic process(GO:0000038) |
| 0.0 |
0.3 |
GO:0045063 |
T-helper 1 cell differentiation(GO:0045063) |
| 0.0 |
0.1 |
GO:0043928 |
exonucleolytic nuclear-transcribed mRNA catabolic process involved in deadenylation-dependent decay(GO:0043928) |
| 0.0 |
0.1 |
GO:1900017 |
positive regulation of cytokine production involved in inflammatory response(GO:1900017) |
| 0.0 |
0.3 |
GO:0006706 |
steroid catabolic process(GO:0006706) |
| 0.0 |
0.1 |
GO:0046341 |
CDP-diacylglycerol metabolic process(GO:0046341) |
| 0.0 |
0.1 |
GO:0006207 |
'de novo' pyrimidine nucleobase biosynthetic process(GO:0006207) pyrimidine nucleobase biosynthetic process(GO:0019856) |
| 0.0 |
0.2 |
GO:0042118 |
endothelial cell activation(GO:0042118) |
| 0.0 |
0.1 |
GO:0010510 |
regulation of acetyl-CoA biosynthetic process from pyruvate(GO:0010510) |
| 0.0 |
0.1 |
GO:0001880 |
Mullerian duct regression(GO:0001880) |
| 0.0 |
0.1 |
GO:0045176 |
apical protein localization(GO:0045176) |
| 0.0 |
0.1 |
GO:0019695 |
choline metabolic process(GO:0019695) |
| 0.0 |
0.1 |
GO:1904707 |
positive regulation of vascular smooth muscle cell proliferation(GO:1904707) |
| 0.0 |
0.1 |
GO:0045716 |
positive regulation of low-density lipoprotein particle receptor biosynthetic process(GO:0045716) |
| 0.0 |
0.1 |
GO:0006041 |
glucosamine metabolic process(GO:0006041) |
| 0.0 |
0.1 |
GO:0030035 |
microspike assembly(GO:0030035) |
| 0.0 |
0.1 |
GO:0038203 |
TORC2 signaling(GO:0038203) |
| 0.0 |
0.7 |
GO:0033119 |
negative regulation of RNA splicing(GO:0033119) |
| 0.0 |
0.0 |
GO:0006000 |
fructose metabolic process(GO:0006000) |
| 0.0 |
0.1 |
GO:0070649 |
formin-nucleated actin cable assembly(GO:0070649) |
| 0.0 |
0.1 |
GO:0006701 |
progesterone biosynthetic process(GO:0006701) |
| 0.0 |
1.2 |
GO:0048663 |
neuron fate commitment(GO:0048663) |
| 0.0 |
0.5 |
GO:0045026 |
plasma membrane fusion(GO:0045026) |
| 0.0 |
0.6 |
GO:0097320 |
membrane tubulation(GO:0097320) |
| 0.0 |
0.2 |
GO:0018065 |
protein-cofactor linkage(GO:0018065) |
| 0.0 |
0.2 |
GO:0070475 |
rRNA base methylation(GO:0070475) |
| 0.0 |
0.2 |
GO:0006020 |
inositol metabolic process(GO:0006020) |
| 0.0 |
0.2 |
GO:0007440 |
foregut morphogenesis(GO:0007440) embryonic foregut morphogenesis(GO:0048617) |
| 0.0 |
0.8 |
GO:0032330 |
regulation of chondrocyte differentiation(GO:0032330) |
| 0.0 |
0.3 |
GO:0015909 |
long-chain fatty acid transport(GO:0015909) |
| 0.0 |
0.2 |
GO:0010606 |
positive regulation of cytoplasmic mRNA processing body assembly(GO:0010606) |
| 0.0 |
0.7 |
GO:0034723 |
DNA replication-dependent nucleosome assembly(GO:0006335) DNA replication-dependent nucleosome organization(GO:0034723) |
| 0.0 |
0.0 |
GO:0042994 |
cytoplasmic sequestering of transcription factor(GO:0042994) |
| 0.0 |
0.1 |
GO:0006478 |
peptidyl-tyrosine sulfation(GO:0006478) |
| 0.0 |
0.1 |
GO:0042891 |
antibiotic transport(GO:0042891) |
| 0.0 |
0.2 |
GO:0031274 |
positive regulation of pseudopodium assembly(GO:0031274) |
| 0.0 |
0.3 |
GO:0009083 |
branched-chain amino acid catabolic process(GO:0009083) |
| 0.0 |
0.1 |
GO:0070269 |
pyroptosis(GO:0070269) |
| 0.0 |
0.2 |
GO:0035269 |
protein O-linked mannosylation(GO:0035269) |
| 0.0 |
0.1 |
GO:0000491 |
small nucleolar ribonucleoprotein complex assembly(GO:0000491) box C/D snoRNP assembly(GO:0000492) |
| 0.0 |
0.1 |
GO:0072538 |
T-helper 17 type immune response(GO:0072538) |
| 0.0 |
0.0 |
GO:2000065 |
negative regulation of glucocorticoid metabolic process(GO:0031944) regulation of glucocorticoid biosynthetic process(GO:0031946) negative regulation of glucocorticoid biosynthetic process(GO:0031947) negative regulation of aldosterone metabolic process(GO:0032345) negative regulation of aldosterone biosynthetic process(GO:0032348) regulation of cortisol biosynthetic process(GO:2000064) negative regulation of cortisol biosynthetic process(GO:2000065) |
| 0.0 |
0.2 |
GO:0009263 |
deoxyribonucleotide biosynthetic process(GO:0009263) |
| 0.0 |
0.3 |
GO:0035116 |
embryonic hindlimb morphogenesis(GO:0035116) |
| 0.0 |
0.7 |
GO:0032728 |
positive regulation of interferon-beta production(GO:0032728) |
| 0.0 |
0.3 |
GO:0006825 |
copper ion transport(GO:0006825) |
| 0.0 |
0.1 |
GO:0060136 |
embryonic process involved in female pregnancy(GO:0060136) |
| 0.0 |
0.2 |
GO:0060712 |
spongiotrophoblast layer development(GO:0060712) |
| 0.0 |
0.4 |
GO:0003016 |
respiratory system process(GO:0003016) |
| 0.0 |
0.2 |
GO:0035814 |
negative regulation of renal sodium excretion(GO:0035814) |
| 0.0 |
0.8 |
GO:0006635 |
fatty acid beta-oxidation(GO:0006635) |
| 0.0 |
0.2 |
GO:0070207 |
protein homotrimerization(GO:0070207) |
| 0.0 |
0.1 |
GO:0035428 |
hexose transmembrane transport(GO:0035428) |
| 0.0 |
0.1 |
GO:0033108 |
mitochondrial respiratory chain complex assembly(GO:0033108) |
| 0.0 |
0.3 |
GO:0016180 |
snRNA processing(GO:0016180) |
| 0.0 |
0.2 |
GO:0033599 |
regulation of mammary gland epithelial cell proliferation(GO:0033599) |
| 0.0 |
0.1 |
GO:0006787 |
porphyrin-containing compound catabolic process(GO:0006787) tetrapyrrole catabolic process(GO:0033015) |
| 0.0 |
0.1 |
GO:1903301 |
positive regulation of glucokinase activity(GO:0033133) positive regulation of hexokinase activity(GO:1903301) |
| 0.0 |
0.1 |
GO:0060613 |
fat pad development(GO:0060613) |
| 0.0 |
0.2 |
GO:0000054 |
ribosomal subunit export from nucleus(GO:0000054) ribosome localization(GO:0033750) establishment of ribosome localization(GO:0033753) |
| 0.0 |
0.1 |
GO:0003383 |
apical constriction(GO:0003383) |
| 0.0 |
0.0 |
GO:0090032 |
negative regulation of hormone metabolic process(GO:0032351) negative regulation of hormone biosynthetic process(GO:0032353) negative regulation of steroid hormone biosynthetic process(GO:0090032) |
| 0.0 |
0.2 |
GO:0044243 |
collagen catabolic process(GO:0030574) multicellular organism catabolic process(GO:0044243) |
| 0.0 |
0.1 |
GO:0017196 |
N-terminal peptidyl-methionine acetylation(GO:0017196) |
| 0.0 |
1.1 |
GO:0002181 |
cytoplasmic translation(GO:0002181) |
| 0.0 |
0.1 |
GO:0006995 |
cellular response to nitrogen starvation(GO:0006995) cellular response to nitrogen levels(GO:0043562) |
| 0.0 |
0.2 |
GO:0007141 |
male meiosis I(GO:0007141) |
| 0.0 |
0.2 |
GO:0031340 |
positive regulation of vesicle fusion(GO:0031340) |
| 0.0 |
0.3 |
GO:0032611 |
interleukin-1 beta production(GO:0032611) |
| 0.0 |
0.1 |
GO:0090155 |
negative regulation of sphingolipid biosynthetic process(GO:0090155) cellular sphingolipid homeostasis(GO:0090156) |
| 0.0 |
0.2 |
GO:0043923 |
positive regulation by host of viral transcription(GO:0043923) |
| 0.0 |
0.1 |
GO:0034219 |
carbohydrate transmembrane transport(GO:0034219) |
| 0.0 |
0.1 |
GO:0061009 |
common bile duct development(GO:0061009) |
| 0.0 |
0.1 |
GO:0014886 |
transition between slow and fast fiber(GO:0014886) |
| 0.0 |
0.3 |
GO:1902042 |
negative regulation of extrinsic apoptotic signaling pathway via death domain receptors(GO:1902042) |
| 0.0 |
0.1 |
GO:0034393 |
positive regulation of smooth muscle cell apoptotic process(GO:0034393) |
| 0.0 |
0.2 |
GO:0071470 |
cellular response to osmotic stress(GO:0071470) |
| 0.0 |
0.2 |
GO:0042989 |
sequestering of actin monomers(GO:0042989) |
| 0.0 |
0.1 |
GO:0048312 |
intracellular distribution of mitochondria(GO:0048312) |
| 0.0 |
0.2 |
GO:0032508 |
DNA duplex unwinding(GO:0032508) |
| 0.0 |
0.2 |
GO:0016926 |
protein desumoylation(GO:0016926) |
| 0.0 |
0.1 |
GO:0071243 |
cellular response to arsenic-containing substance(GO:0071243) |
| 0.0 |
0.9 |
GO:0006661 |
phosphatidylinositol biosynthetic process(GO:0006661) |
| 0.0 |
0.1 |
GO:0015825 |
L-serine transport(GO:0015825) |
| 0.0 |
0.1 |
GO:0071712 |
ER-associated misfolded protein catabolic process(GO:0071712) |
| 0.0 |
0.1 |
GO:0002014 |
vasoconstriction of artery involved in ischemic response to lowering of systemic arterial blood pressure(GO:0002014) |
| 0.0 |
0.0 |
GO:0006269 |
DNA replication, synthesis of RNA primer(GO:0006269) |
| 0.0 |
0.1 |
GO:0035994 |
response to muscle stretch(GO:0035994) |
| 0.0 |
0.3 |
GO:0006044 |
N-acetylglucosamine metabolic process(GO:0006044) |
| 0.0 |
0.1 |
GO:0000185 |
activation of MAPKKK activity(GO:0000185) |
| 0.0 |
0.5 |
GO:0035456 |
response to interferon-beta(GO:0035456) |
| 0.0 |
0.1 |
GO:0007220 |
Notch receptor processing(GO:0007220) |
| 0.0 |
0.1 |
GO:0021511 |
spinal cord patterning(GO:0021511) |
| 0.0 |
0.5 |
GO:0016578 |
histone deubiquitination(GO:0016578) |
| 0.0 |
0.1 |
GO:0006903 |
vesicle targeting(GO:0006903) |
| 0.0 |
0.1 |
GO:0061179 |
negative regulation of insulin secretion involved in cellular response to glucose stimulus(GO:0061179) |
| 0.0 |
0.0 |
GO:1902630 |
regulation of membrane hyperpolarization(GO:1902630) |
| 0.0 |
0.1 |
GO:0010884 |
positive regulation of lipid storage(GO:0010884) |
| 0.0 |
0.5 |
GO:0006414 |
translational elongation(GO:0006414) |
| 0.0 |
0.2 |
GO:0010225 |
response to UV-C(GO:0010225) |
| 0.0 |
0.0 |
GO:0022410 |
circadian sleep/wake cycle process(GO:0022410) circadian sleep/wake cycle, sleep(GO:0050802) |
| 0.0 |
0.1 |
GO:0035553 |
oxidative RNA demethylation(GO:0035513) oxidative single-stranded RNA demethylation(GO:0035553) |
| 0.0 |
0.2 |
GO:0034340 |
response to type I interferon(GO:0034340) |
| 0.0 |
0.1 |
GO:0046835 |
carbohydrate phosphorylation(GO:0046835) |
| 0.0 |
0.4 |
GO:1903077 |
negative regulation of protein localization to plasma membrane(GO:1903077) negative regulation of protein localization to cell periphery(GO:1904376) |
| 0.0 |
0.1 |
GO:0000022 |
mitotic spindle elongation(GO:0000022) spindle midzone assembly(GO:0051255) mitotic spindle midzone assembly(GO:0051256) |
| 0.0 |
0.1 |
GO:0016080 |
synaptic vesicle targeting(GO:0016080) |
| 0.0 |
0.1 |
GO:0033299 |
secretion of lysosomal enzymes(GO:0033299) |
| 0.0 |
0.1 |
GO:0071340 |
skeletal muscle acetylcholine-gated channel clustering(GO:0071340) |
| 0.0 |
0.2 |
GO:0006658 |
phosphatidylserine metabolic process(GO:0006658) |
| 0.0 |
0.7 |
GO:0007229 |
integrin-mediated signaling pathway(GO:0007229) |
| 0.0 |
0.1 |
GO:0007221 |
positive regulation of transcription of Notch receptor target(GO:0007221) |
| 0.0 |
0.1 |
GO:0097286 |
iron ion import(GO:0097286) |
| 0.0 |
0.2 |
GO:0043162 |
ubiquitin-dependent protein catabolic process via the multivesicular body sorting pathway(GO:0043162) |
| 0.0 |
0.1 |
GO:2000191 |
regulation of fatty acid transport(GO:2000191) |
| 0.0 |
0.2 |
GO:0019369 |
arachidonic acid metabolic process(GO:0019369) |
| 0.0 |
0.4 |
GO:0048791 |
calcium ion-regulated exocytosis of neurotransmitter(GO:0048791) |
| 0.0 |
0.6 |
GO:0050728 |
negative regulation of inflammatory response(GO:0050728) |
| 0.0 |
0.1 |
GO:0071157 |
negative regulation of cell cycle arrest(GO:0071157) |
| 0.0 |
0.1 |
GO:0006384 |
transcription initiation from RNA polymerase III promoter(GO:0006384) |
| 0.0 |
0.3 |
GO:0007205 |
protein kinase C-activating G-protein coupled receptor signaling pathway(GO:0007205) |
| 0.0 |
0.1 |
GO:0002082 |
regulation of oxidative phosphorylation(GO:0002082) |
| 0.0 |
0.0 |
GO:0002931 |
response to ischemia(GO:0002931) |
| 0.0 |
0.1 |
GO:0051418 |
interphase microtubule nucleation by interphase microtubule organizing center(GO:0051415) microtubule nucleation by microtubule organizing center(GO:0051418) |
| 0.0 |
0.2 |
GO:0071577 |
zinc II ion transmembrane transport(GO:0071577) |
| 0.0 |
0.0 |
GO:0006667 |
sphinganine metabolic process(GO:0006667) |
| 0.0 |
0.1 |
GO:0060216 |
definitive hemopoiesis(GO:0060216) |
| 0.0 |
0.1 |
GO:0014823 |
response to activity(GO:0014823) |
| 0.0 |
0.1 |
GO:1900364 |
regulation of mRNA polyadenylation(GO:1900363) negative regulation of mRNA polyadenylation(GO:1900364) |
| 0.0 |
0.2 |
GO:2000060 |
positive regulation of protein ubiquitination involved in ubiquitin-dependent protein catabolic process(GO:2000060) |
| 0.0 |
0.3 |
GO:0019915 |
lipid storage(GO:0019915) |
| 0.0 |
0.1 |
GO:1990564 |
protein polyufmylation(GO:1990564) protein K69-linked ufmylation(GO:1990592) |
| 0.0 |
0.6 |
GO:0042274 |
ribosomal small subunit biogenesis(GO:0042274) |
| 0.0 |
0.0 |
GO:0007258 |
JUN phosphorylation(GO:0007258) |
| 0.0 |
0.1 |
GO:0018206 |
peptidyl-methionine modification(GO:0018206) |
| 0.0 |
0.1 |
GO:0090557 |
establishment of endothelial intestinal barrier(GO:0090557) |
| 0.0 |
0.2 |
GO:0007095 |
mitotic G2 DNA damage checkpoint(GO:0007095) |
| 0.0 |
0.2 |
GO:0045070 |
positive regulation of viral genome replication(GO:0045070) |
| 0.0 |
0.1 |
GO:0010972 |
negative regulation of G2/M transition of mitotic cell cycle(GO:0010972) |
| 0.0 |
0.0 |
GO:0060330 |
regulation of response to interferon-gamma(GO:0060330) |
| 0.0 |
0.0 |
GO:0060011 |
Sertoli cell proliferation(GO:0060011) |
| 0.0 |
0.1 |
GO:2000650 |
negative regulation of sodium ion transmembrane transport(GO:1902306) negative regulation of sodium ion transmembrane transporter activity(GO:2000650) |
| 0.0 |
0.3 |
GO:1904031 |
positive regulation of cyclin-dependent protein kinase activity(GO:1904031) |
| 0.0 |
0.6 |
GO:0006165 |
nucleoside diphosphate phosphorylation(GO:0006165) |
| 0.0 |
0.5 |
GO:0042098 |
T cell proliferation(GO:0042098) |
| 0.0 |
0.1 |
GO:0030575 |
nuclear body organization(GO:0030575) |
| 0.0 |
0.1 |
GO:0031145 |
anaphase-promoting complex-dependent catabolic process(GO:0031145) |
| 0.0 |
0.1 |
GO:0070914 |
UV-damage excision repair(GO:0070914) |
| 0.0 |
0.1 |
GO:0046135 |
pyrimidine nucleoside catabolic process(GO:0046135) |
| 0.0 |
0.1 |
GO:0015908 |
fatty acid transport(GO:0015908) |
| 0.0 |
0.1 |
GO:1904294 |
positive regulation of ERAD pathway(GO:1904294) |
| 0.0 |
0.2 |
GO:0033866 |
coenzyme A biosynthetic process(GO:0015937) nucleoside bisphosphate biosynthetic process(GO:0033866) ribonucleoside bisphosphate biosynthetic process(GO:0034030) purine nucleoside bisphosphate biosynthetic process(GO:0034033) |
| 0.0 |
0.0 |
GO:0000393 |
spliceosomal conformational changes to generate catalytic conformation(GO:0000393) |
| 0.0 |
0.1 |
GO:0048680 |
positive regulation of axon regeneration(GO:0048680) |
| 0.0 |
0.0 |
GO:0071169 |
establishment of protein localization to chromatin(GO:0071169) |
| 0.0 |
0.0 |
GO:0009649 |
entrainment of circadian clock(GO:0009649) |
| 0.0 |
0.0 |
GO:0030210 |
heparin biosynthetic process(GO:0030210) |
| 0.0 |
0.1 |
GO:0018026 |
peptidyl-lysine monomethylation(GO:0018026) |
| 0.0 |
0.1 |
GO:0030579 |
ubiquitin-dependent SMAD protein catabolic process(GO:0030579) |
| 0.0 |
0.0 |
GO:0014877 |
response to inactivity(GO:0014854) response to muscle inactivity(GO:0014870) response to muscle inactivity involved in regulation of muscle adaptation(GO:0014877) response to denervation involved in regulation of muscle adaptation(GO:0014894) |
| 0.0 |
0.0 |
GO:0045059 |
positive thymic T cell selection(GO:0045059) |
| 0.0 |
0.1 |
GO:0019236 |
response to pheromone(GO:0019236) |
| 0.0 |
0.0 |
GO:0046469 |
platelet activating factor biosynthetic process(GO:0006663) platelet activating factor metabolic process(GO:0046469) |
| 0.0 |
0.1 |
GO:0034497 |
protein localization to pre-autophagosomal structure(GO:0034497) |
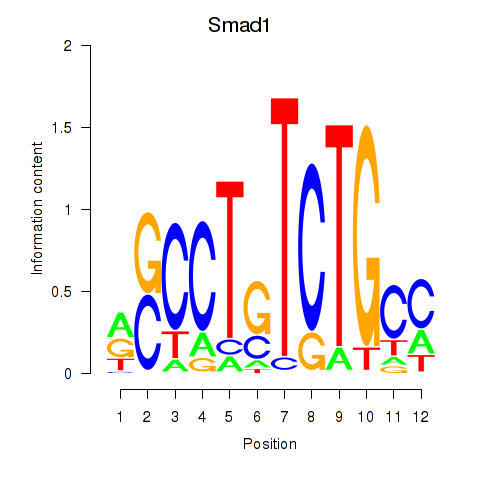
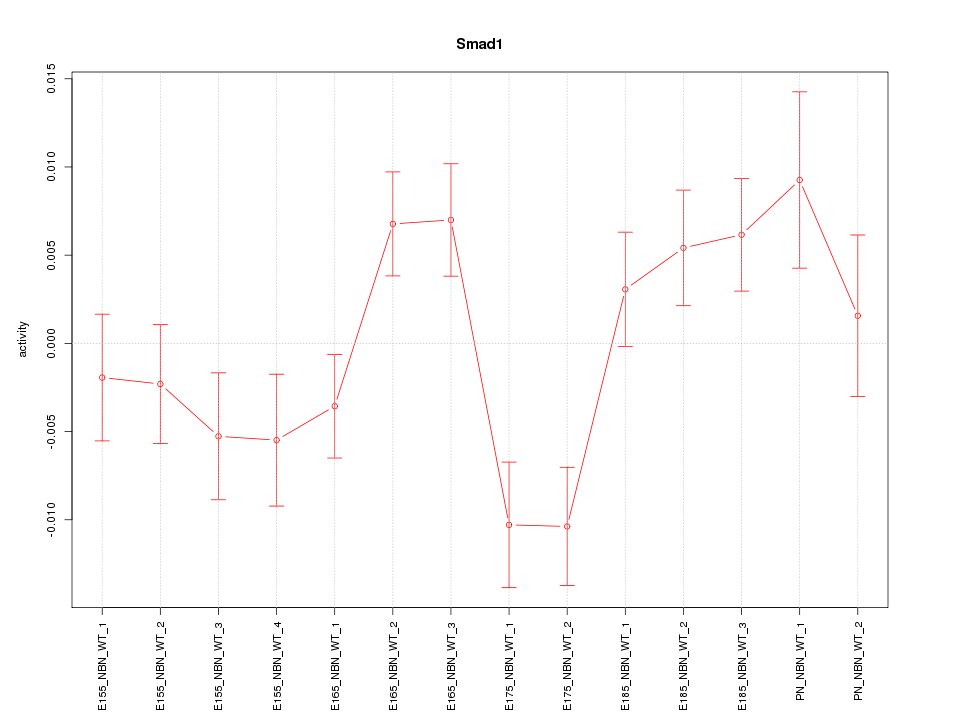
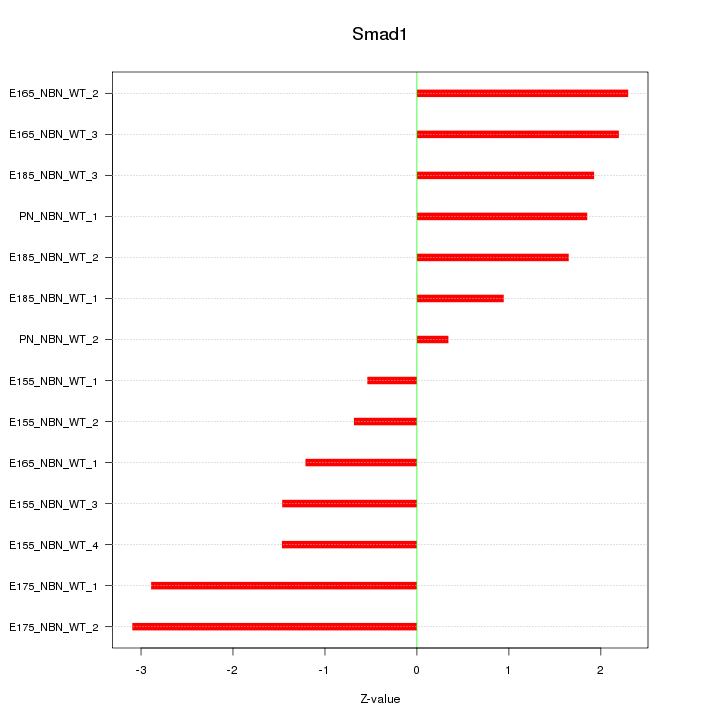

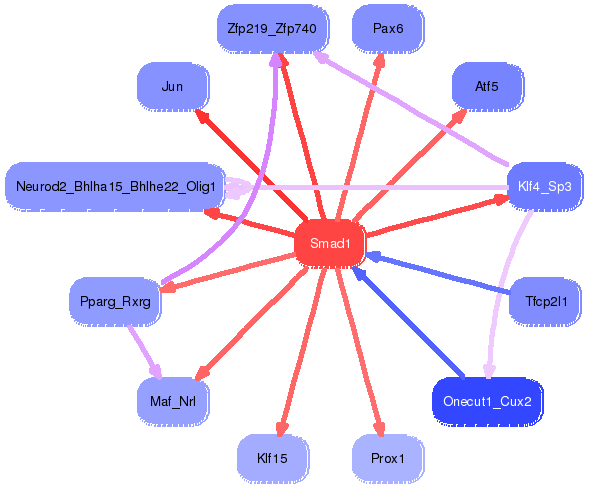