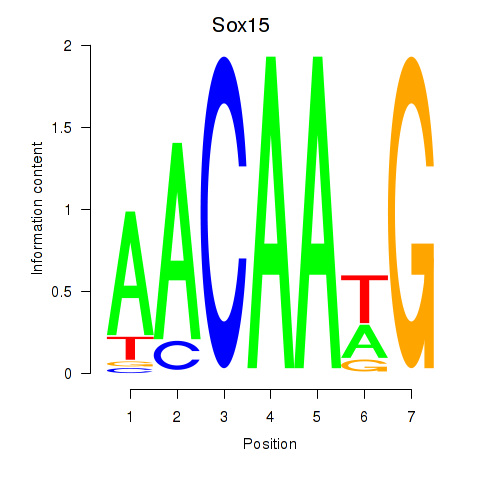
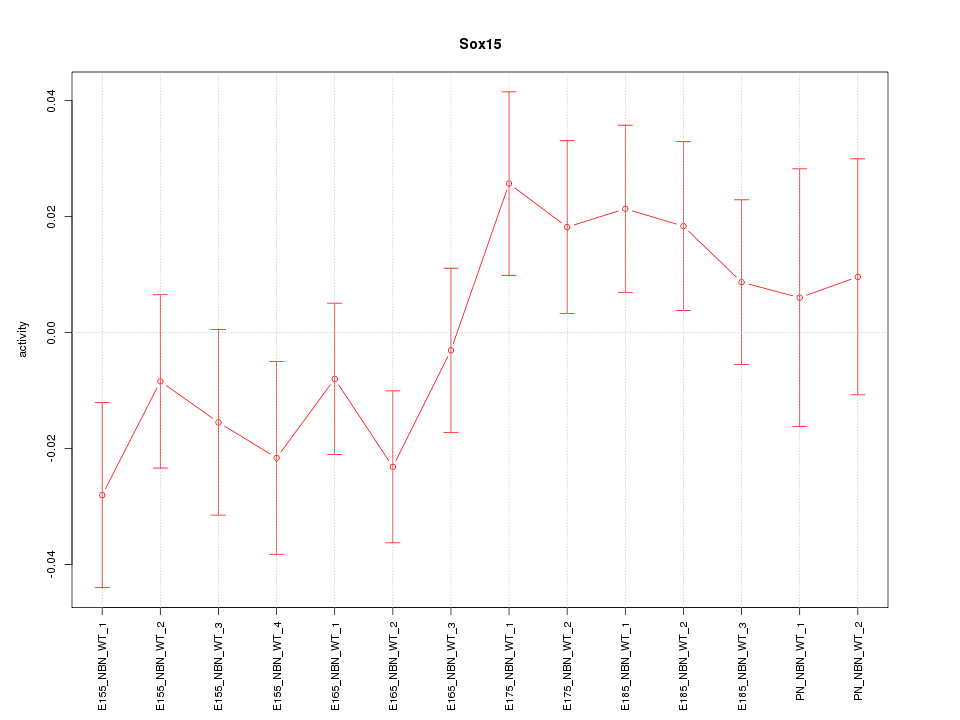
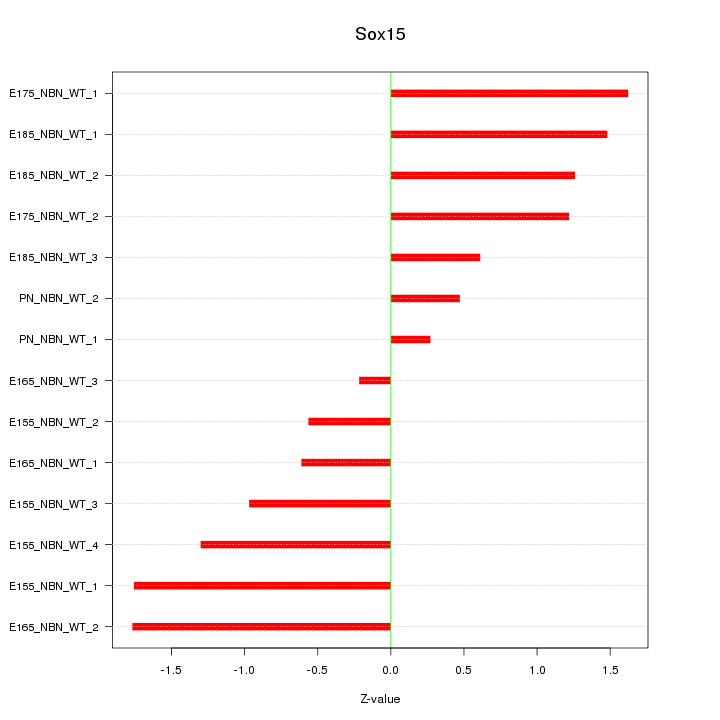
Motif ID: Sox15
Z-value: 1.139
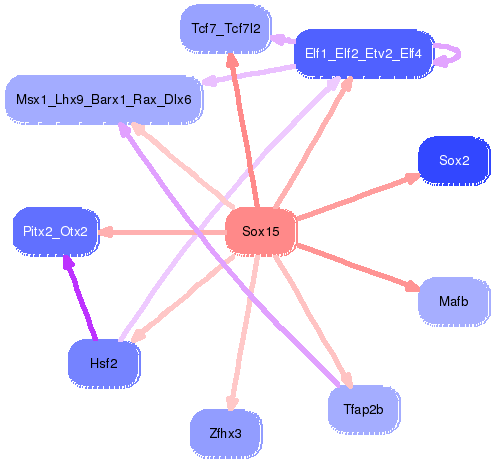
Transcription factors associated with Sox15:
| Gene Symbol | Entrez ID | Gene Name |
|---|---|---|
| Sox15 | ENSMUSG00000041287.5 | Sox15 |

Top targets:
Gene overrepresentation in biological_process category:
| Log-likelihood per target | Total log-likelihood | Term | Description |
|---|---|---|---|
| 1.2 | 11.1 | GO:0060665 | regulation of branching involved in salivary gland morphogenesis by mesenchymal-epithelial signaling(GO:0060665) |
| 0.4 | 1.8 | GO:0046684 | response to pyrethroid(GO:0046684) |
| 0.3 | 1.2 | GO:0034285 | response to sucrose(GO:0009744) response to disaccharide(GO:0034285) |
| 0.3 | 0.9 | GO:0030827 | negative regulation of cGMP metabolic process(GO:0030824) negative regulation of cGMP biosynthetic process(GO:0030827) negative regulation of guanylate cyclase activity(GO:0031283) |
| 0.2 | 0.6 | GO:0002842 | T cell mediated immune response to tumor cell(GO:0002424) regulation of T cell mediated immune response to tumor cell(GO:0002840) positive regulation of T cell mediated immune response to tumor cell(GO:0002842) positive regulation of cell-cell adhesion mediated by integrin(GO:0033634) |
| 0.2 | 0.8 | GO:0072697 | protein localization to cell cortex(GO:0072697) |
| 0.2 | 1.0 | GO:0045578 | negative regulation of B cell differentiation(GO:0045578) |
| 0.2 | 4.7 | GO:0001573 | ganglioside metabolic process(GO:0001573) |
| 0.2 | 1.3 | GO:0005513 | detection of calcium ion(GO:0005513) |
| 0.2 | 0.5 | GO:0035435 | phosphate ion transmembrane transport(GO:0035435) |
| 0.1 | 0.7 | GO:1900122 | positive regulation of receptor binding(GO:1900122) |
| 0.1 | 0.6 | GO:1904192 | prostate gland stromal morphogenesis(GO:0060741) cholangiocyte apoptotic process(GO:1902488) regulation of cholangiocyte apoptotic process(GO:1904192) negative regulation of cholangiocyte apoptotic process(GO:1904193) |
| 0.1 | 0.6 | GO:0050904 | diapedesis(GO:0050904) |
| 0.1 | 0.9 | GO:0061304 | retinal blood vessel morphogenesis(GO:0061304) |
| 0.1 | 0.9 | GO:0051461 | protein import into peroxisome matrix, docking(GO:0016560) regulation of corticotropin secretion(GO:0051459) positive regulation of corticotropin secretion(GO:0051461) |
| 0.1 | 0.9 | GO:0045200 | establishment or maintenance of neuroblast polarity(GO:0045196) establishment of neuroblast polarity(GO:0045200) |
| 0.1 | 0.5 | GO:0051387 | negative regulation of neurotrophin TRK receptor signaling pathway(GO:0051387) |
| 0.1 | 0.6 | GO:2000809 | neuroligin clustering involved in postsynaptic membrane assembly(GO:0097118) positive regulation of synaptic vesicle clustering(GO:2000809) |
| 0.1 | 0.6 | GO:0048852 | diencephalon morphogenesis(GO:0048852) |
| 0.1 | 1.7 | GO:0018279 | N-acetylneuraminate metabolic process(GO:0006054) protein N-linked glycosylation via asparagine(GO:0018279) |
| 0.1 | 0.7 | GO:1903608 | protein localization to cytoplasmic stress granule(GO:1903608) |
| 0.1 | 0.5 | GO:0048625 | myoblast fate commitment(GO:0048625) |
| 0.1 | 0.2 | GO:0048686 | regulation of sprouting of injured axon(GO:0048686) regulation of axon extension involved in regeneration(GO:0048690) |
| 0.1 | 0.4 | GO:0051694 | pointed-end actin filament capping(GO:0051694) |
| 0.1 | 0.5 | GO:0021546 | rhombomere development(GO:0021546) |
| 0.1 | 0.2 | GO:0007158 | neuron cell-cell adhesion(GO:0007158) |
| 0.0 | 0.2 | GO:0010593 | negative regulation of lamellipodium assembly(GO:0010593) |
| 0.0 | 0.3 | GO:0000160 | phosphorelay signal transduction system(GO:0000160) |
| 0.0 | 0.4 | GO:0031642 | negative regulation of myelination(GO:0031642) negative regulation of excitatory postsynaptic potential(GO:0090394) negative regulation of receptor catabolic process(GO:2000645) |
| 0.0 | 0.1 | GO:0014877 | response to inactivity(GO:0014854) response to muscle inactivity(GO:0014870) response to muscle inactivity involved in regulation of muscle adaptation(GO:0014877) response to denervation involved in regulation of muscle adaptation(GO:0014894) |
| 0.0 | 0.8 | GO:0045956 | positive regulation of calcium ion-dependent exocytosis(GO:0045956) |
| 0.0 | 1.3 | GO:0032728 | positive regulation of interferon-beta production(GO:0032728) |
| 0.0 | 0.2 | GO:2000325 | nuclear-transcribed mRNA catabolic process, no-go decay(GO:0070966) regulation of ligand-dependent nuclear receptor transcription coactivator activity(GO:2000325) positive regulation of ligand-dependent nuclear receptor transcription coactivator activity(GO:2000327) |
| 0.0 | 0.1 | GO:1903966 | monounsaturated fatty acid metabolic process(GO:1903964) monounsaturated fatty acid biosynthetic process(GO:1903966) |
| 0.0 | 0.3 | GO:0046085 | adenosine metabolic process(GO:0046085) |
| 0.0 | 1.0 | GO:0090162 | establishment of epithelial cell polarity(GO:0090162) |
| 0.0 | 0.1 | GO:0097274 | urea homeostasis(GO:0097274) |
| 0.0 | 0.6 | GO:2000772 | regulation of cellular senescence(GO:2000772) |
| 0.0 | 0.1 | GO:0021521 | ventral spinal cord interneuron specification(GO:0021521) cell fate specification involved in pattern specification(GO:0060573) |
| 0.0 | 0.2 | GO:0061436 | establishment of skin barrier(GO:0061436) |
| 0.0 | 0.1 | GO:1900220 | semaphorin-plexin signaling pathway involved in bone trabecula morphogenesis(GO:1900220) |
| 0.0 | 0.0 | GO:0003162 | atrioventricular node development(GO:0003162) |
| 0.0 | 1.1 | GO:0001885 | endothelial cell development(GO:0001885) |
| 0.0 | 0.2 | GO:0050860 | negative regulation of T cell receptor signaling pathway(GO:0050860) |
| 0.0 | 1.4 | GO:0030168 | platelet activation(GO:0030168) |
| 0.0 | 0.5 | GO:0021522 | spinal cord motor neuron differentiation(GO:0021522) |
| 0.0 | 2.5 | GO:0031032 | actomyosin structure organization(GO:0031032) |
| 0.0 | 0.1 | GO:0070307 | lens fiber cell development(GO:0070307) |
| 0.0 | 0.0 | GO:1904059 | regulation of locomotor rhythm(GO:1904059) |
Gene overrepresentation in cellular_component category:
| Log-likelihood per target | Total log-likelihood | Term | Description |
|---|---|---|---|
| 0.3 | 1.4 | GO:0033093 | Weibel-Palade body(GO:0033093) |
| 0.2 | 0.9 | GO:0017071 | intracellular cyclic nucleotide activated cation channel complex(GO:0017071) |
| 0.2 | 4.7 | GO:0008305 | integrin complex(GO:0008305) protein complex involved in cell adhesion(GO:0098636) |
| 0.2 | 0.6 | GO:0035867 | alphav-beta3 integrin-IGF-1-IGF1R complex(GO:0035867) |
| 0.2 | 0.9 | GO:0005587 | collagen type IV trimer(GO:0005587) network-forming collagen trimer(GO:0098642) collagen network(GO:0098645) basement membrane collagen trimer(GO:0098651) |
| 0.2 | 0.7 | GO:0097165 | nuclear stress granule(GO:0097165) |
| 0.2 | 11.4 | GO:0009925 | basal plasma membrane(GO:0009925) |
| 0.1 | 0.6 | GO:0030485 | smooth muscle contractile fiber(GO:0030485) |
| 0.1 | 1.0 | GO:0033269 | internode region of axon(GO:0033269) |
| 0.1 | 0.6 | GO:0036056 | filtration diaphragm(GO:0036056) slit diaphragm(GO:0036057) |
| 0.1 | 1.8 | GO:0034706 | voltage-gated sodium channel complex(GO:0001518) sodium channel complex(GO:0034706) |
| 0.1 | 0.3 | GO:0042585 | germinal vesicle(GO:0042585) |
| 0.1 | 0.9 | GO:0044327 | dendritic spine head(GO:0044327) |
| 0.1 | 0.3 | GO:0032426 | stereocilium tip(GO:0032426) |
| 0.1 | 0.5 | GO:0070369 | beta-catenin-TCF7L2 complex(GO:0070369) |
| 0.1 | 0.6 | GO:0031528 | anchored component of external side of plasma membrane(GO:0031362) microvillus membrane(GO:0031528) |
| 0.1 | 0.8 | GO:0031045 | dense core granule(GO:0031045) |
| 0.0 | 0.3 | GO:0002116 | semaphorin receptor complex(GO:0002116) |
| 0.0 | 0.4 | GO:0005865 | striated muscle thin filament(GO:0005865) |
| 0.0 | 0.9 | GO:0014704 | intercalated disc(GO:0014704) |
| 0.0 | 1.3 | GO:0008076 | voltage-gated potassium channel complex(GO:0008076) |
| 0.0 | 2.0 | GO:0005923 | bicellular tight junction(GO:0005923) |
| 0.0 | 0.9 | GO:0005881 | cytoplasmic microtubule(GO:0005881) |
Gene overrepresentation in molecular_function category:
| Log-likelihood per target | Total log-likelihood | Term | Description |
|---|---|---|---|
| 2.8 | 11.2 | GO:0005008 | hepatocyte growth factor-activated receptor activity(GO:0005008) |
| 0.3 | 1.7 | GO:0003835 | beta-galactoside alpha-2,6-sialyltransferase activity(GO:0003835) |
| 0.3 | 1.2 | GO:0097642 | calcitonin family receptor activity(GO:0097642) |
| 0.3 | 1.0 | GO:0019911 | structural constituent of myelin sheath(GO:0019911) |
| 0.2 | 0.9 | GO:0005052 | peroxisome matrix targeting signal-1 binding(GO:0005052) |
| 0.2 | 1.4 | GO:0019865 | immunoglobulin binding(GO:0019865) |
| 0.1 | 0.5 | GO:0005315 | inorganic phosphate transmembrane transporter activity(GO:0005315) |
| 0.1 | 0.6 | GO:0070699 | type II activin receptor binding(GO:0070699) |
| 0.1 | 0.9 | GO:0042500 | aspartic endopeptidase activity, intramembrane cleaving(GO:0042500) |
| 0.1 | 1.8 | GO:0031402 | sodium ion binding(GO:0031402) |
| 0.1 | 1.3 | GO:0015269 | calcium-activated potassium channel activity(GO:0015269) |
| 0.1 | 0.5 | GO:0005049 | nuclear export signal receptor activity(GO:0005049) |
| 0.1 | 0.7 | GO:0070679 | inositol 1,4,5 trisphosphate binding(GO:0070679) |
| 0.1 | 0.9 | GO:0048407 | platelet-derived growth factor binding(GO:0048407) |
| 0.1 | 0.6 | GO:0030296 | protein tyrosine kinase activator activity(GO:0030296) |
| 0.0 | 0.3 | GO:0000155 | phosphorelay sensor kinase activity(GO:0000155) |
| 0.0 | 0.2 | GO:0030156 | benzodiazepine receptor binding(GO:0030156) |
| 0.0 | 0.4 | GO:0005523 | tropomyosin binding(GO:0005523) |
| 0.0 | 0.2 | GO:0005030 | neurotrophin receptor activity(GO:0005030) |
| 0.0 | 0.9 | GO:0032794 | GTPase activating protein binding(GO:0032794) |
| 0.0 | 0.1 | GO:0032896 | palmitoyl-CoA 9-desaturase activity(GO:0032896) |
| 0.0 | 0.4 | GO:0004438 | phosphatidylinositol-3-phosphatase activity(GO:0004438) |
| 0.0 | 0.6 | GO:0043539 | protein serine/threonine kinase activator activity(GO:0043539) |
| 0.0 | 0.6 | GO:0043747 | protein-N-terminal asparagine amidohydrolase activity(GO:0008418) UDP-3-O-[3-hydroxymyristoyl] N-acetylglucosamine deacetylase activity(GO:0008759) iprodione amidohydrolase activity(GO:0018748) (3,5-dichlorophenylurea)acetate amidohydrolase activity(GO:0018749) 4'-(2-hydroxyisopropyl)phenylurea amidohydrolase activity(GO:0034571) didemethylisoproturon amidohydrolase activity(GO:0034573) N-isopropylacetanilide amidohydrolase activity(GO:0034576) N-cyclohexylformamide amidohydrolase activity(GO:0034781) isonicotinic acid hydrazide hydrolase activity(GO:0034876) cis-aconitamide amidase activity(GO:0034882) gamma-N-formylaminovinylacetate hydrolase activity(GO:0034885) N2-acetyl-L-lysine deacetylase activity(GO:0043747) O-succinylbenzoate synthase activity(GO:0043748) indoleacetamide hydrolase activity(GO:0043864) N-acetylcitrulline deacetylase activity(GO:0043909) N-acetylgalactosamine-6-phosphate deacetylase activity(GO:0047419) diacetylchitobiose deacetylase activity(GO:0052773) chitooligosaccharide deacetylase activity(GO:0052790) |
| 0.0 | 0.9 | GO:0051721 | protein phosphatase 2A binding(GO:0051721) |
| 0.0 | 0.8 | GO:0005544 | calcium-dependent phospholipid binding(GO:0005544) |
| 0.0 | 0.4 | GO:0035198 | miRNA binding(GO:0035198) |
| 0.0 | 0.2 | GO:0051022 | Rho GDP-dissociation inhibitor binding(GO:0051022) |
| 0.0 | 0.7 | GO:0017091 | AU-rich element binding(GO:0017091) |
| 0.0 | 0.9 | GO:0017080 | sodium channel regulator activity(GO:0017080) |
| 0.0 | 0.1 | GO:0005212 | structural constituent of eye lens(GO:0005212) |
| 0.0 | 0.3 | GO:0008253 | 5'-nucleotidase activity(GO:0008253) |
| 0.0 | 0.2 | GO:0044323 | retinoic acid-responsive element binding(GO:0044323) |
| 0.0 | 1.3 | GO:0000979 | RNA polymerase II core promoter sequence-specific DNA binding(GO:0000979) |
| 0.0 | 0.7 | GO:0017022 | myosin binding(GO:0017022) |
| 0.0 | 0.7 | GO:0030374 | ligand-dependent nuclear receptor transcription coactivator activity(GO:0030374) |