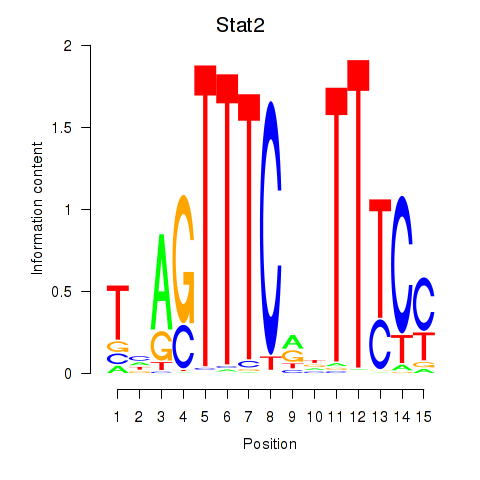
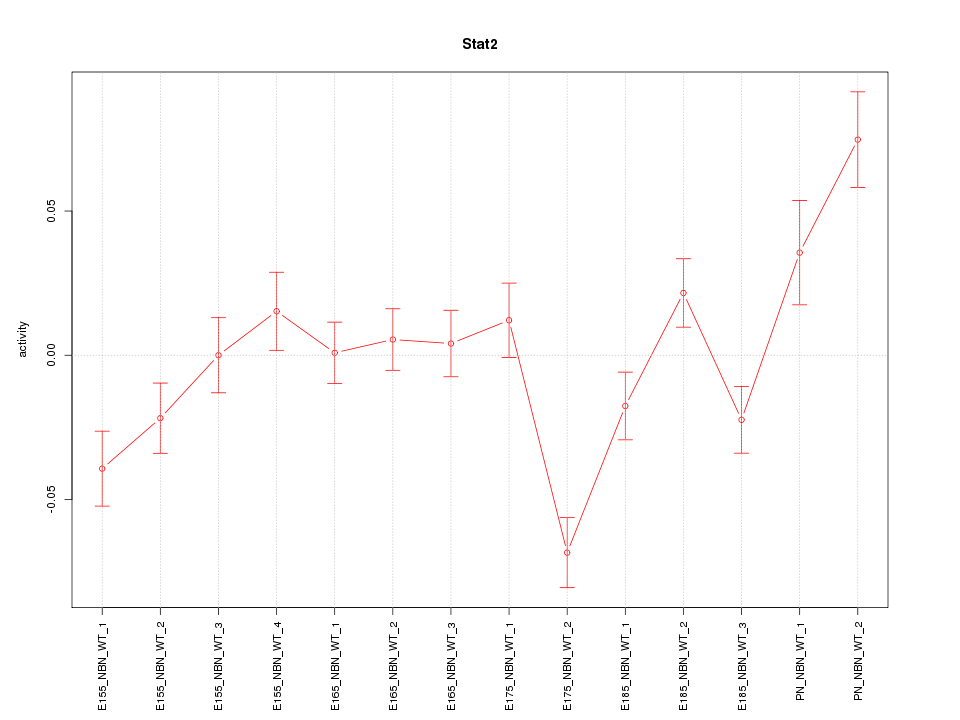
Motif ID: Stat2
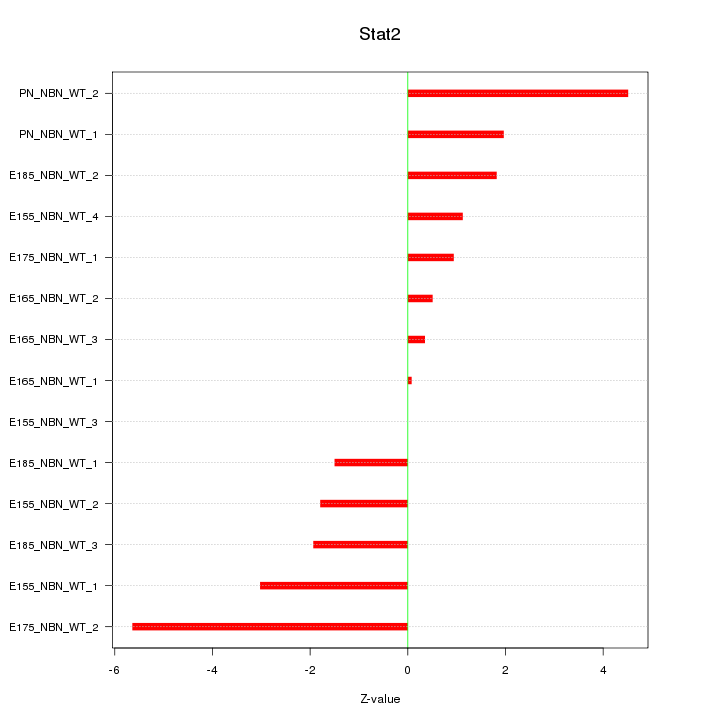
Z-value: 2.394
Transcription factors associated with Stat2:
| Gene Symbol | Entrez ID | Gene Name |
|---|---|---|
| Stat2 | ENSMUSG00000040033.9 | Stat2 |
Activity-expression correlation:
| Gene Symbol | Promoter | Pearson corr. coef. | P-value | Plot |
|---|---|---|---|---|
| Stat2 | mm10_v2_chr10_+_128270546_128270577 | -0.60 | 2.4e-02 | Click! |

Top targets:
Gene overrepresentation in biological_process category:
| Log-likelihood per target | Total log-likelihood | Term | Description |
|---|---|---|---|
| 2.1 | 6.4 | GO:2000562 | negative regulation of interferon-gamma secretion(GO:1902714) negative regulation of CD4-positive, alpha-beta T cell proliferation(GO:2000562) |
| 1.6 | 4.9 | GO:0002578 | negative regulation of antigen processing and presentation(GO:0002578) |
| 1.5 | 4.4 | GO:1902524 | negative regulation of interferon-alpha production(GO:0032687) interferon-alpha biosynthetic process(GO:0045349) regulation of interferon-alpha biosynthetic process(GO:0045354) negative regulation of interferon-beta biosynthetic process(GO:0045358) positive regulation of protein K48-linked ubiquitination(GO:1902524) |
| 1.4 | 5.6 | GO:1901252 | regulation of intracellular transport of viral material(GO:1901252) |
| 1.0 | 4.0 | GO:1900122 | positive regulation of receptor binding(GO:1900122) |
| 1.0 | 2.9 | GO:0042560 | 10-formyltetrahydrofolate catabolic process(GO:0009258) folic acid-containing compound catabolic process(GO:0009397) pteridine-containing compound catabolic process(GO:0042560) |
| 0.9 | 2.8 | GO:1904139 | microglial cell migration(GO:1904124) regulation of microglial cell migration(GO:1904139) |
| 0.9 | 3.7 | GO:0044565 | dendritic cell proliferation(GO:0044565) |
| 0.9 | 2.7 | GO:0002741 | positive regulation of cytokine secretion involved in immune response(GO:0002741) |
| 0.8 | 32.9 | GO:0045071 | negative regulation of viral genome replication(GO:0045071) |
| 0.8 | 0.8 | GO:0034124 | regulation of MyD88-dependent toll-like receptor signaling pathway(GO:0034124) |
| 0.7 | 2.2 | GO:0060364 | frontal suture morphogenesis(GO:0060364) |
| 0.7 | 1.4 | GO:0050713 | negative regulation of interleukin-1 beta secretion(GO:0050713) |
| 0.7 | 2.0 | GO:0035441 | cell migration involved in vasculogenesis(GO:0035441) metanephric glomerular mesangium development(GO:0072223) metanephric glomerular mesangial cell proliferation involved in metanephros development(GO:0072262) |
| 0.6 | 1.9 | GO:0070944 | neutrophil mediated killing of bacterium(GO:0070944) |
| 0.6 | 4.9 | GO:0031666 | positive regulation of lipopolysaccharide-mediated signaling pathway(GO:0031666) |
| 0.6 | 3.9 | GO:0060330 | regulation of response to interferon-gamma(GO:0060330) |
| 0.5 | 1.6 | GO:0019441 | tryptophan catabolic process(GO:0006569) tryptophan catabolic process to kynurenine(GO:0019441) quinolinate biosynthetic process(GO:0019805) indole-containing compound catabolic process(GO:0042436) indolalkylamine catabolic process(GO:0046218) kynurenine metabolic process(GO:0070189) |
| 0.5 | 1.5 | GO:0045404 | positive regulation of interleukin-4 biosynthetic process(GO:0045404) |
| 0.5 | 3.4 | GO:0090336 | positive regulation of brown fat cell differentiation(GO:0090336) |
| 0.4 | 1.3 | GO:0060340 | positive regulation of type I interferon-mediated signaling pathway(GO:0060340) |
| 0.4 | 11.6 | GO:0032728 | positive regulation of interferon-beta production(GO:0032728) |
| 0.4 | 10.9 | GO:0035456 | response to interferon-beta(GO:0035456) |
| 0.4 | 2.3 | GO:0045627 | positive regulation of T-helper 1 cell differentiation(GO:0045627) |
| 0.4 | 2.3 | GO:0035989 | tendon development(GO:0035989) |
| 0.4 | 1.2 | GO:0002302 | CD8-positive, alpha-beta T cell differentiation involved in immune response(GO:0002302) mesodermal to mesenchymal transition involved in gastrulation(GO:0060809) |
| 0.4 | 2.3 | GO:0003383 | apical constriction(GO:0003383) |
| 0.4 | 2.9 | GO:0048625 | myoblast fate commitment(GO:0048625) |
| 0.3 | 1.0 | GO:0001580 | detection of chemical stimulus involved in sensory perception of bitter taste(GO:0001580) |
| 0.3 | 2.7 | GO:2000781 | positive regulation of double-strand break repair(GO:2000781) |
| 0.3 | 1.6 | GO:1900170 | negative regulation of glucocorticoid mediated signaling pathway(GO:1900170) |
| 0.3 | 2.0 | GO:0090091 | positive regulation of extracellular matrix disassembly(GO:0090091) |
| 0.3 | 0.8 | GO:0060392 | negative regulation of SMAD protein import into nucleus(GO:0060392) |
| 0.3 | 1.8 | GO:0042590 | antigen processing and presentation of exogenous peptide antigen via MHC class I(GO:0042590) |
| 0.2 | 2.3 | GO:2000051 | negative regulation of non-canonical Wnt signaling pathway(GO:2000051) |
| 0.2 | 1.4 | GO:0097368 | establishment of Sertoli cell barrier(GO:0097368) |
| 0.2 | 0.7 | GO:0006533 | aspartate catabolic process(GO:0006533) D-amino acid catabolic process(GO:0019478) |
| 0.2 | 0.8 | GO:0031509 | telomeric heterochromatin assembly(GO:0031509) negative regulation of chromosome condensation(GO:1902340) |
| 0.2 | 0.6 | GO:0033634 | positive regulation of cell-cell adhesion mediated by integrin(GO:0033634) |
| 0.2 | 1.5 | GO:0071474 | cellular hyperosmotic response(GO:0071474) |
| 0.2 | 0.9 | GO:2000668 | dendritic cell apoptotic process(GO:0097048) regulation of dendritic cell apoptotic process(GO:2000668) |
| 0.2 | 1.6 | GO:0032876 | negative regulation of DNA endoreduplication(GO:0032876) |
| 0.2 | 0.5 | GO:0045351 | type I interferon biosynthetic process(GO:0045351) |
| 0.1 | 1.6 | GO:0033004 | negative regulation of mast cell activation(GO:0033004) |
| 0.1 | 1.0 | GO:0032020 | ISG15-protein conjugation(GO:0032020) |
| 0.1 | 1.0 | GO:0043569 | negative regulation of insulin-like growth factor receptor signaling pathway(GO:0043569) |
| 0.1 | 6.0 | GO:0046825 | regulation of protein export from nucleus(GO:0046825) |
| 0.1 | 0.6 | GO:0010991 | negative regulation of SMAD protein complex assembly(GO:0010991) |
| 0.1 | 3.5 | GO:0016082 | synaptic vesicle priming(GO:0016082) |
| 0.1 | 1.0 | GO:0090086 | negative regulation of protein deubiquitination(GO:0090086) |
| 0.1 | 0.5 | GO:0015959 | diadenosine polyphosphate metabolic process(GO:0015959) |
| 0.1 | 0.8 | GO:1904936 | cerebral cortex GABAergic interneuron migration(GO:0021853) interneuron migration(GO:1904936) |
| 0.1 | 0.6 | GO:0006543 | glutamine catabolic process(GO:0006543) |
| 0.1 | 1.4 | GO:0050930 | induction of positive chemotaxis(GO:0050930) |
| 0.1 | 0.7 | GO:0051611 | negative regulation of neurotransmitter uptake(GO:0051581) serotonin uptake(GO:0051610) regulation of serotonin uptake(GO:0051611) negative regulation of serotonin uptake(GO:0051612) |
| 0.1 | 1.0 | GO:1903608 | protein localization to cytoplasmic stress granule(GO:1903608) |
| 0.1 | 1.0 | GO:0021684 | cerebellar granular layer formation(GO:0021684) cerebellar granule cell differentiation(GO:0021707) |
| 0.1 | 1.7 | GO:0042088 | T-helper 1 type immune response(GO:0042088) |
| 0.1 | 0.7 | GO:0010818 | T cell chemotaxis(GO:0010818) |
| 0.1 | 0.7 | GO:0042118 | endothelial cell activation(GO:0042118) |
| 0.1 | 0.3 | GO:1902990 | mitotic telomere maintenance via semi-conservative replication(GO:1902990) |
| 0.1 | 2.4 | GO:1901522 | positive regulation of transcription from RNA polymerase II promoter involved in cellular response to chemical stimulus(GO:1901522) |
| 0.1 | 0.4 | GO:0006957 | complement activation, alternative pathway(GO:0006957) |
| 0.1 | 0.7 | GO:0045292 | mRNA cis splicing, via spliceosome(GO:0045292) |
| 0.1 | 0.5 | GO:0042126 | nitrate metabolic process(GO:0042126) |
| 0.1 | 2.2 | GO:0034723 | DNA replication-dependent nucleosome assembly(GO:0006335) DNA replication-dependent nucleosome organization(GO:0034723) |
| 0.1 | 1.5 | GO:0055070 | copper ion homeostasis(GO:0055070) |
| 0.1 | 0.2 | GO:0019085 | early viral transcription(GO:0019085) late viral transcription(GO:0019086) |
| 0.1 | 0.2 | GO:0071360 | cellular response to exogenous dsRNA(GO:0071360) |
| 0.1 | 0.8 | GO:0070914 | UV-damage excision repair(GO:0070914) |
| 0.1 | 0.2 | GO:0071033 | nuclear retention of pre-mRNA at the site of transcription(GO:0071033) CUT catabolic process(GO:0071034) CUT metabolic process(GO:0071043) polyadenylation-dependent snoRNA 3'-end processing(GO:0071051) |
| 0.1 | 0.3 | GO:0060762 | regulation of branching involved in mammary gland duct morphogenesis(GO:0060762) |
| 0.1 | 0.2 | GO:0010756 | positive regulation of plasminogen activation(GO:0010756) |
| 0.1 | 3.1 | GO:0042632 | cholesterol homeostasis(GO:0042632) sterol homeostasis(GO:0055092) |
| 0.1 | 0.3 | GO:1902410 | mitotic cytokinetic process(GO:1902410) |
| 0.1 | 0.4 | GO:0032782 | bile acid secretion(GO:0032782) |
| 0.0 | 2.1 | GO:0006376 | mRNA splice site selection(GO:0006376) |
| 0.0 | 0.2 | GO:0002121 | inter-male aggressive behavior(GO:0002121) |
| 0.0 | 0.3 | GO:0046688 | response to copper ion(GO:0046688) |
| 0.0 | 4.5 | GO:0016579 | protein deubiquitination(GO:0016579) |
| 0.0 | 0.3 | GO:0051204 | protein insertion into mitochondrial membrane(GO:0051204) |
| 0.0 | 0.3 | GO:0016584 | nucleosome positioning(GO:0016584) |
| 0.0 | 1.7 | GO:0043392 | negative regulation of DNA binding(GO:0043392) |
| 0.0 | 0.3 | GO:0002548 | monocyte chemotaxis(GO:0002548) |
| 0.0 | 2.2 | GO:0006513 | protein monoubiquitination(GO:0006513) |
| 0.0 | 0.1 | GO:0001866 | NK T cell proliferation(GO:0001866) |
| 0.0 | 2.0 | GO:0097194 | execution phase of apoptosis(GO:0097194) |
| 0.0 | 0.8 | GO:0046677 | response to antibiotic(GO:0046677) |
| 0.0 | 0.2 | GO:0046485 | ether lipid metabolic process(GO:0046485) |
| 0.0 | 0.3 | GO:0030953 | astral microtubule organization(GO:0030953) |
| 0.0 | 1.2 | GO:0006998 | nuclear envelope organization(GO:0006998) |
| 0.0 | 0.2 | GO:0036065 | fucosylation(GO:0036065) |
| 0.0 | 0.4 | GO:0043171 | peptide catabolic process(GO:0043171) |
| 0.0 | 1.1 | GO:0030032 | lamellipodium assembly(GO:0030032) |
| 0.0 | 0.5 | GO:0001919 | regulation of receptor recycling(GO:0001919) |
| 0.0 | 1.3 | GO:0002244 | hematopoietic progenitor cell differentiation(GO:0002244) |
Gene overrepresentation in cellular_component category:
| Log-likelihood per target | Total log-likelihood | Term | Description |
|---|---|---|---|
| 0.8 | 4.0 | GO:1990357 | terminal web(GO:1990357) |
| 0.6 | 1.9 | GO:1990682 | CSF1-CSF1R complex(GO:1990682) |
| 0.5 | 1.9 | GO:0043020 | NADPH oxidase complex(GO:0043020) |
| 0.4 | 4.0 | GO:1990712 | HFE-transferrin receptor complex(GO:1990712) |
| 0.4 | 1.4 | GO:1990111 | spermatoproteasome complex(GO:1990111) |
| 0.3 | 2.9 | GO:0070369 | beta-catenin-TCF7L2 complex(GO:0070369) |
| 0.3 | 2.3 | GO:0033269 | internode region of axon(GO:0033269) |
| 0.3 | 1.4 | GO:0042406 | extrinsic component of endoplasmic reticulum membrane(GO:0042406) |
| 0.3 | 1.0 | GO:0097165 | nuclear stress granule(GO:0097165) |
| 0.2 | 1.6 | GO:0042629 | mast cell granule(GO:0042629) |
| 0.2 | 2.3 | GO:0098643 | fibrillar collagen trimer(GO:0005583) banded collagen fibril(GO:0098643) |
| 0.2 | 1.1 | GO:0042825 | TAP complex(GO:0042825) |
| 0.2 | 1.8 | GO:0020003 | symbiont-containing vacuole(GO:0020003) |
| 0.1 | 6.0 | GO:0005637 | nuclear inner membrane(GO:0005637) |
| 0.1 | 0.5 | GO:0008537 | proteasome activator complex(GO:0008537) |
| 0.1 | 0.8 | GO:0031465 | Cul4B-RING E3 ubiquitin ligase complex(GO:0031465) |
| 0.1 | 5.2 | GO:0005788 | endoplasmic reticulum lumen(GO:0005788) |
| 0.1 | 0.3 | GO:0070557 | PCNA-p21 complex(GO:0070557) |
| 0.1 | 0.9 | GO:0043657 | host(GO:0018995) host cell part(GO:0033643) host cell(GO:0043657) |
| 0.1 | 3.1 | GO:0000788 | nuclear nucleosome(GO:0000788) |
| 0.1 | 8.3 | GO:0016363 | nuclear matrix(GO:0016363) |
| 0.1 | 0.3 | GO:0071006 | U2-type catalytic step 1 spliceosome(GO:0071006) |
| 0.1 | 1.1 | GO:0005614 | interstitial matrix(GO:0005614) |
| 0.1 | 0.6 | GO:0034098 | VCP-NPL4-UFD1 AAA ATPase complex(GO:0034098) |
| 0.1 | 23.2 | GO:0045177 | apical part of cell(GO:0045177) |
| 0.1 | 2.2 | GO:0016592 | mediator complex(GO:0016592) |
| 0.1 | 0.5 | GO:0043083 | synaptic cleft(GO:0043083) |
| 0.1 | 3.5 | GO:0042734 | presynaptic membrane(GO:0042734) |
| 0.1 | 0.8 | GO:0000177 | cytoplasmic exosome (RNase complex)(GO:0000177) |
| 0.0 | 1.0 | GO:0030914 | STAGA complex(GO:0030914) |
| 0.0 | 0.9 | GO:0009925 | basal plasma membrane(GO:0009925) |
| 0.0 | 0.1 | GO:0031084 | BLOC-2 complex(GO:0031084) |
| 0.0 | 0.2 | GO:0008024 | cyclin/CDK positive transcription elongation factor complex(GO:0008024) |
| 0.0 | 2.4 | GO:0072562 | blood microparticle(GO:0072562) |
| 0.0 | 2.0 | GO:0031519 | PcG protein complex(GO:0031519) |
| 0.0 | 0.3 | GO:0005677 | chromatin silencing complex(GO:0005677) |
| 0.0 | 1.3 | GO:0010494 | cytoplasmic stress granule(GO:0010494) |
| 0.0 | 1.1 | GO:0001726 | ruffle(GO:0001726) |
| 0.0 | 1.5 | GO:0032587 | ruffle membrane(GO:0032587) |
| 0.0 | 0.4 | GO:0034451 | centriolar satellite(GO:0034451) |
| 0.0 | 1.2 | GO:0005643 | nuclear pore(GO:0005643) |
| 0.0 | 0.2 | GO:0042405 | nuclear inclusion body(GO:0042405) |
| 0.0 | 1.2 | GO:0045111 | intermediate filament cytoskeleton(GO:0045111) |
| 0.0 | 0.6 | GO:0031901 | early endosome membrane(GO:0031901) |
| 0.0 | 1.9 | GO:0005770 | late endosome(GO:0005770) |
| 0.0 | 1.3 | GO:0009897 | external side of plasma membrane(GO:0009897) |
| 0.0 | 0.3 | GO:0031305 | integral component of mitochondrial inner membrane(GO:0031305) |
Gene overrepresentation in molecular_function category:
| Log-likelihood per target | Total log-likelihood | Term | Description |
|---|---|---|---|
| 1.1 | 6.4 | GO:0016936 | galactoside binding(GO:0016936) |
| 1.0 | 2.9 | GO:0016155 | formyltetrahydrofolate dehydrogenase activity(GO:0016155) |
| 0.8 | 3.1 | GO:0047844 | deoxycytidine deaminase activity(GO:0047844) |
| 0.6 | 8.3 | GO:0016443 | bidentate ribonuclease III activity(GO:0016443) |
| 0.6 | 1.7 | GO:0048019 | receptor antagonist activity(GO:0048019) |
| 0.6 | 7.3 | GO:0008191 | metalloendopeptidase inhibitor activity(GO:0008191) |
| 0.5 | 5.5 | GO:0016920 | pyroglutamyl-peptidase activity(GO:0016920) |
| 0.5 | 1.6 | GO:0016174 | NAD(P)H oxidase activity(GO:0016174) |
| 0.5 | 4.0 | GO:0039706 | co-receptor binding(GO:0039706) |
| 0.5 | 2.0 | GO:0097200 | cysteine-type endopeptidase activity involved in execution phase of apoptosis(GO:0097200) |
| 0.5 | 1.0 | GO:0005110 | frizzled-2 binding(GO:0005110) |
| 0.5 | 1.9 | GO:0016175 | superoxide-generating NADPH oxidase activity(GO:0016175) |
| 0.5 | 9.9 | GO:0003950 | NAD+ ADP-ribosyltransferase activity(GO:0003950) |
| 0.4 | 2.1 | GO:0001069 | regulatory region RNA binding(GO:0001069) |
| 0.4 | 1.6 | GO:0038049 | glucocorticoid receptor activity(GO:0004883) transcription factor activity, ligand-activated RNA polymerase II transcription factor binding(GO:0038049) glucocorticoid-activated RNA polymerase II transcription factor binding transcription factor activity(GO:0038051) |
| 0.4 | 2.0 | GO:0038085 | vascular endothelial growth factor binding(GO:0038085) |
| 0.4 | 1.1 | GO:0016493 | C-C chemokine receptor activity(GO:0016493) |
| 0.4 | 1.1 | GO:0070052 | collagen V binding(GO:0070052) |
| 0.3 | 6.0 | GO:0005521 | lamin binding(GO:0005521) |
| 0.2 | 3.2 | GO:0031386 | protein tag(GO:0031386) |
| 0.2 | 2.4 | GO:0004886 | 9-cis retinoic acid receptor activity(GO:0004886) |
| 0.2 | 2.0 | GO:0038062 | protein tyrosine kinase collagen receptor activity(GO:0038062) |
| 0.2 | 0.7 | GO:0003884 | D-amino-acid oxidase activity(GO:0003884) aspartate oxidase activity(GO:0015922) |
| 0.2 | 4.3 | GO:0005044 | scavenger receptor activity(GO:0005044) |
| 0.2 | 3.1 | GO:0017128 | phospholipid scramblase activity(GO:0017128) |
| 0.2 | 1.0 | GO:0004839 | ubiquitin activating enzyme activity(GO:0004839) |
| 0.2 | 0.7 | GO:0001011 | transcription factor activity, sequence-specific DNA binding, RNA polymerase recruiting(GO:0001011) transcription factor activity, TFIIB-class binding(GO:0001087) |
| 0.2 | 1.1 | GO:0046978 | TAP1 binding(GO:0046978) TAP2 binding(GO:0046979) |
| 0.2 | 0.5 | GO:0047710 | bis(5'-adenosyl)-triphosphatase activity(GO:0047710) |
| 0.2 | 0.5 | GO:0003692 | left-handed Z-DNA binding(GO:0003692) |
| 0.2 | 0.5 | GO:0098809 | nitrite reductase activity(GO:0098809) |
| 0.1 | 1.9 | GO:1904264 | ubiquitin protein ligase activity involved in ERAD pathway(GO:1904264) |
| 0.1 | 0.9 | GO:0045028 | G-protein coupled nucleotide receptor activity(GO:0001608) G-protein coupled adenosine receptor activity(GO:0001609) G-protein coupled purinergic nucleotide receptor activity(GO:0045028) |
| 0.1 | 0.6 | GO:0004359 | glutaminase activity(GO:0004359) |
| 0.1 | 2.9 | GO:0045295 | gamma-catenin binding(GO:0045295) |
| 0.1 | 1.4 | GO:0050897 | cobalt ion binding(GO:0050897) |
| 0.1 | 1.2 | GO:0052872 | 3-(3-hydroxyphenyl)propionate hydroxylase activity(GO:0008688) 4-chlorobenzaldehyde oxidase activity(GO:0018471) 3,5-xylenol methylhydroxylase activity(GO:0018630) phenylacetate hydroxylase activity(GO:0018631) 4-nitrophenol 4-monooxygenase activity(GO:0018632) dimethyl sulfide monooxygenase activity(GO:0018633) alpha-pinene monooxygenase [NADH] activity(GO:0018634) phenanthrene 9,10-monooxygenase activity(GO:0018636) 1-hydroxy-2-naphthoate hydroxylase activity(GO:0018637) toluene 4-monooxygenase activity(GO:0018638) xylene monooxygenase activity(GO:0018639) dibenzothiophene monooxygenase activity(GO:0018640) 6-hydroxy-3-methyl-2-oxo-1,2-dihydroquinoline 6-monooxygenase activity(GO:0018641) chlorophenol 4-monooxygenase activity(GO:0018642) carbon disulfide oxygenase activity(GO:0018643) toluene 2-monooxygenase activity(GO:0018644) 1-hydroxy-2-oxolimonene 1,2-monooxygenase activity(GO:0018646) phenanthrene 1,2-monooxygenase activity(GO:0018647) tetrahydrofuran hydroxylase activity(GO:0018649) styrene monooxygenase activity(GO:0018650) toluene-4-sulfonate monooxygenase activity(GO:0018651) toluene-sulfonate methyl-monooxygenase activity(GO:0018652) 3-methyl-2-oxo-1,2-dihydroquinoline 6-monooxygenase activity(GO:0018653) 2-hydroxy-phenylacetate hydroxylase activity(GO:0018654) 2-oxo-delta3-4,5,5-trimethylcyclopentenylacetyl-CoA 1,2-monooxygenase activity(GO:0018655) phenanthrene 3,4-monooxygenase activity(GO:0018656) toluene 3-monooxygenase activity(GO:0018657) 4-hydroxyphenylacetate,NADH:oxygen oxidoreductase (3-hydroxylating) activity(GO:0018660) limonene monooxygenase activity(GO:0019113) 2-methylnaphthalene hydroxylase activity(GO:0034526) 1-methylnaphthalene hydroxylase activity(GO:0034534) bisphenol A hydroxylase A activity(GO:0034560) salicylate 5-hydroxylase activity(GO:0034785) isobutylamine N-hydroxylase activity(GO:0034791) branched-chain dodecylbenzene sulfonate monooxygenase activity(GO:0034802) 3-HSA hydroxylase activity(GO:0034819) 4-hydroxypyridine-3-hydroxylase activity(GO:0034894) 2-octaprenyl-3-methyl-6-methoxy-1,4-benzoquinol hydroxylase activity(GO:0043719) 6-hydroxynicotinate 3-monooxygenase activity(GO:0043731) tocotrienol omega-hydroxylase activity(GO:0052872) thalianol hydroxylase activity(GO:0080014) |
| 0.1 | 16.8 | GO:0001078 | transcriptional repressor activity, RNA polymerase II core promoter proximal region sequence-specific binding(GO:0001078) |
| 0.1 | 0.6 | GO:0036435 | K48-linked polyubiquitin binding(GO:0036435) |
| 0.1 | 0.3 | GO:0030337 | DNA polymerase processivity factor activity(GO:0030337) dinucleotide insertion or deletion binding(GO:0032139) |
| 0.1 | 4.2 | GO:0005547 | phosphatidylinositol-3,4,5-trisphosphate binding(GO:0005547) |
| 0.1 | 2.2 | GO:0070566 | adenylyltransferase activity(GO:0070566) |
| 0.1 | 0.5 | GO:0061133 | endopeptidase activator activity(GO:0061133) |
| 0.1 | 0.5 | GO:0004971 | AMPA glutamate receptor activity(GO:0004971) |
| 0.1 | 0.3 | GO:0008475 | procollagen-lysine 5-dioxygenase activity(GO:0008475) |
| 0.1 | 1.1 | GO:0004694 | eukaryotic translation initiation factor 2alpha kinase activity(GO:0004694) |
| 0.1 | 4.6 | GO:0016836 | hydro-lyase activity(GO:0016836) |
| 0.1 | 2.3 | GO:0005201 | extracellular matrix structural constituent(GO:0005201) |
| 0.1 | 0.5 | GO:0034046 | poly(G) binding(GO:0034046) |
| 0.1 | 0.3 | GO:0016724 | ferroxidase activity(GO:0004322) oxidoreductase activity, oxidizing metal ions, oxygen as acceptor(GO:0016724) |
| 0.1 | 0.2 | GO:0000403 | Y-form DNA binding(GO:0000403) |
| 0.1 | 2.2 | GO:0035035 | histone acetyltransferase binding(GO:0035035) |
| 0.1 | 4.5 | GO:0033613 | activating transcription factor binding(GO:0033613) |
| 0.1 | 0.4 | GO:0005138 | interleukin-6 receptor binding(GO:0005138) |
| 0.0 | 1.5 | GO:0005507 | copper ion binding(GO:0005507) |
| 0.0 | 0.5 | GO:0032036 | myosin heavy chain binding(GO:0032036) |
| 0.0 | 1.0 | GO:0043422 | protein kinase B binding(GO:0043422) |
| 0.0 | 0.4 | GO:0015168 | glycerol transmembrane transporter activity(GO:0015168) glycerol channel activity(GO:0015254) |
| 0.0 | 0.2 | GO:0016714 | oxidoreductase activity, acting on paired donors, with incorporation or reduction of molecular oxygen, reduced pteridine as one donor, and incorporation of one atom of oxygen(GO:0016714) |
| 0.0 | 0.1 | GO:0019153 | protein-disulfide reductase (glutathione) activity(GO:0019153) |
| 0.0 | 0.6 | GO:0070628 | proteasome binding(GO:0070628) |
| 0.0 | 0.1 | GO:0000900 | translation repressor activity, nucleic acid binding(GO:0000900) |
| 0.0 | 1.3 | GO:0030332 | cyclin binding(GO:0030332) |
| 0.0 | 0.2 | GO:0097322 | 7SK snRNA binding(GO:0097322) |
| 0.0 | 0.7 | GO:0070064 | proline-rich region binding(GO:0070064) |
| 0.0 | 1.7 | GO:0000979 | RNA polymerase II core promoter sequence-specific DNA binding(GO:0000979) |
| 0.0 | 0.6 | GO:0042826 | histone deacetylase binding(GO:0042826) |
| 0.0 | 1.6 | GO:0004197 | cysteine-type endopeptidase activity(GO:0004197) |
| 0.0 | 1.9 | GO:0003727 | single-stranded RNA binding(GO:0003727) |
| 0.0 | 1.9 | GO:0008083 | growth factor activity(GO:0008083) |
| 0.0 | 0.6 | GO:0017091 | AU-rich element binding(GO:0017091) |
| 0.0 | 1.3 | GO:0042393 | histone binding(GO:0042393) |
| 0.0 | 0.6 | GO:0050699 | WW domain binding(GO:0050699) |
| 0.0 | 1.7 | GO:0019838 | growth factor binding(GO:0019838) |
| 0.0 | 0.8 | GO:0003684 | damaged DNA binding(GO:0003684) |
| 0.0 | 1.8 | GO:0001948 | glycoprotein binding(GO:0001948) |
| 0.0 | 5.6 | GO:0005525 | GTP binding(GO:0005525) |
| 0.0 | 0.7 | GO:0030374 | ligand-dependent nuclear receptor transcription coactivator activity(GO:0030374) |
| 0.0 | 1.0 | GO:0003697 | single-stranded DNA binding(GO:0003697) |
| 0.0 | 0.3 | GO:0035257 | nuclear hormone receptor binding(GO:0035257) |
| 0.0 | 1.0 | GO:0003682 | chromatin binding(GO:0003682) |
| 0.0 | 0.9 | GO:0043851 | rRNA (adenine-N6,N6-)-dimethyltransferase activity(GO:0000179) rRNA (uridine-2'-O-)-methyltransferase activity(GO:0008650) rRNA (adenine-N6-)-methyltransferase activity(GO:0008988) rRNA (cytosine-C5-)-methyltransferase activity(GO:0009383) selenocysteine methyltransferase activity(GO:0016205) rRNA (adenine) methyltransferase activity(GO:0016433) rRNA (cytosine) methyltransferase activity(GO:0016434) rRNA (guanine) methyltransferase activity(GO:0016435) 1-phenanthrol methyltransferase activity(GO:0018707) protein-arginine N5-methyltransferase activity(GO:0019702) dimethylarsinite methyltransferase activity(GO:0034541) 4,5-dihydroxybenzo(a)pyrene methyltransferase activity(GO:0034807) 1-hydroxypyrene methyltransferase activity(GO:0034931) 1-hydroxy-6-methoxypyrene methyltransferase activity(GO:0034933) demethylmenaquinone methyltransferase activity(GO:0043770) cobalt-precorrin-6B C5-methyltransferase activity(GO:0043776) cobalt-precorrin-7 C15-methyltransferase activity(GO:0043777) cobalt-precorrin-5B C1-methyltransferase activity(GO:0043780) cobalt-precorrin-3 C17-methyltransferase activity(GO:0043782) dimethylamine methyltransferase activity(GO:0043791) hydroxyneurosporene-O-methyltransferase activity(GO:0043803) tRNA (adenine-57, 58-N(1)-) methyltransferase activity(GO:0043827) methylamine-specific methylcobalamin:coenzyme M methyltransferase activity(GO:0043833) trimethylamine methyltransferase activity(GO:0043834) methanol-specific methylcobalamin:coenzyme M methyltransferase activity(GO:0043851) monomethylamine methyltransferase activity(GO:0043852) P-methyltransferase activity(GO:0051994) Se-methyltransferase activity(GO:0051995) 2-phytyl-1,4-naphthoquinone methyltransferase activity(GO:0052624) tRNA (uracil-2'-O-)-methyltransferase activity(GO:0052665) tRNA (cytosine-2'-O-)-methyltransferase activity(GO:0052666) phosphomethylethanolamine N-methyltransferase activity(GO:0052667) tRNA (cytosine-3-)-methyltransferase activity(GO:0052735) rRNA (cytosine-2'-O-)-methyltransferase activity(GO:0070677) rRNA (cytosine-N4-)-methyltransferase activity(GO:0071424) trihydroxyferuloyl spermidine O-methyltransferase activity(GO:0080012) |
| 0.0 | 1.5 | GO:0051015 | actin filament binding(GO:0051015) |